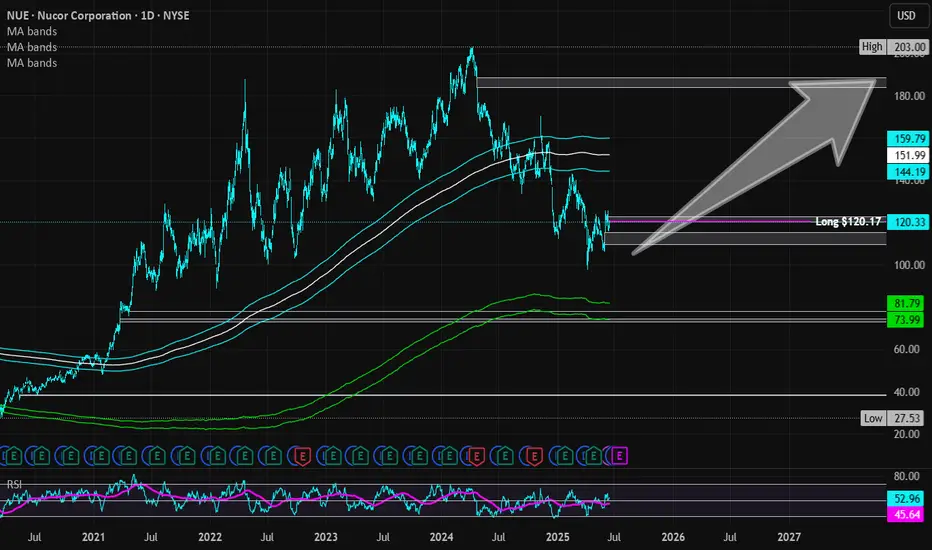
Nucor | NUE | Long at $120.17Nucor NYSE:NUE , a US manufacture of steel and steel products, will likely capitalize on reduced foreign competition as tariffs become reality. The CEO also recently stated that the steelmaker's order backlog is the largest in its history and is increasing prices. So, while there is a potential for short-term downside as tariff "unknowns" are negotiated, the longer-term upside may be there for those who are patient... but time will tell.
Basic Fundamentals:
Current P/E: 21x
Forward P/E: 15-16x
Earnings are forecast to grow 29.6% per year
Projected Revenue in 2025: $32.3 billion
[*} Projected Revenue in 2028: $39.4 billion
Debt-to-Equity: 0.4x (healthy)
Dividend Yield: 1.8%
Technical Analysis:
Riding below the historical simple moving average and there is risk the daily price gap near $109 will close before moving higher. If there is a "crash" in price, $70s is absolutely possible which will be a "steel" if fundamentals do not change.
Targets in 2027:
$142.00 (+18.2%)
$187.00 (+55.6%)
Industrial
Rockwell Automation | ROK | Long at $268.96Rockwell Automation NYSE:ROK appears to be gaining upward momentum once again. With two price gaps above (highest near $333+) and the historical simple moving average lines showing a positive change, this company could be poised to fill the gaps soon. A strong billion-dollar company with rising revenue, but stay cautious of the slightly high debt, insider selling, and changing economy / tariff implications.
At $268.96, NYSE:ROK is in a personal buy-zone.
Targets:
$300.00
$333.00

Columbus McKinnon Corp | CMCO | Long at $14.90Columbus McKinnon Corp NASDAQ:CMCO is a stock that is highly cyclical, moving in "boom and bust" cycles every 3-5 years. As indicated by its entry into my "crash" simple moving average area (currently between $11 and $13), it may be nearing the end of its bust cycle (time will tell). With a book value at $31, debt-to-equity of 0.6x (healthy), quick ratio over 1 (healthy), insiders buying over $1 million in the past 6 months, a 2% dividend yield, and earning forecast to grow after 2025, NASDAQ:CMCO may be a hidden gem for double-digit returns in the coming years. But every investment is a risk.
Thus, at $14.90, NASDAQ:CMCO is in a personal buy zone.
Targets:
$25.00 (+67.8%)
$30.00 (+101.3%)

Why Did 3M Stock Soar Despite Tariff Clouds?Shares of industrial giant 3M Co. experienced a significant rally following the release of its first-quarter 2025 financial results. The surge was primarily driven by the company reporting adjusted earnings and total net sales that exceeded Wall Street's expectations. This performance signaled a stronger operational footing than analysts had anticipated.
The positive results stemmed from several key factors highlighted in the report. 3M demonstrated solid organic sales growth and achieved notable adjusted operating margin expansion. This margin improvement reflects the effectiveness of management's ongoing cost-cutting initiatives and strategic focus on operational efficiency, contributing directly to double-digit growth in earnings per share during the quarter.
While the company did warn about potential future impacts on 2025 profit due to rising global trade tensions and tariffs, management also detailed proactive strategies to mitigate these risks. Plans include supply chain adjustments, pricing actions, and leveraging their global manufacturing network, potentially increasing U.S. production. The company maintained its full-year adjusted earnings guidance, notably stating that this outlook already incorporates the anticipated tariff effects. Investors likely responded positively to the combination of strong quarterly performance and clear actions to address identified headwinds.

Cleveland-Cliffs (CLF) BUY SETUPlooking for a strong recovery on us steel sector in 2025 and 2026.
trade carefully.
good luck.

Commodity Outlook: Finding antivenoms in the Year of the SnakeWe are about a month into the Chinese Year of the Snake. The preceding Year of the Dragon (10 February 2024 to 28 January 2025) brought significant momentum to the asset class with broad commodities rising 10%, precious metals rising 36%, industrial metals rising 12%, and even energy and agriculture mustering a late gain (close to 2% each)1. However, the Year of the Snake presents several macro challenges for commodities. Renewed trade protectionism from the US, under the new Trump Administration, is likely to dampen global trade. Additionally, higher bond yields and a strong US dollar create further headwinds for the commodities market. China’s reticence to stimulate big is also holding back the asset class.
Despite these headwinds, we have identified several micro factors that could provide support for certain commodities—what we refer to as our ‘antivenoms’. We remain optimistic about precious metals, aluminium, and European natural gas. Additionally, some of the macroeconomic challenges may ultimately prove less severe than initially anticipated, creating potential upside opportunities for commodities that currently reflect bearish sentiment.
Strong US dollar
The recent strength of the US dollar has historically correlated with weaker commodity prices. While this pattern has been inconsistent post-COVID-19, the dollar's resurgence could once again pressure commodities. Historical data suggests a strong dollar often aligns with declining commodity values.
Trump’s trade policies and market impact
Donald Trump’s return to the presidency introduces uncertainty into trade and commodity markets. Trump's first presidency saw a trade war with China and other nations, negatively impacting global trade and commodity prices. While extreme tariff measures have often been bargaining tactics, the risk of real implementation remains. In his second term, some tariffs were announced and then delayed; at the time of writing, we still have no real guide as to whether they will be implemented or when. This uncertainty is already dampening market sentiment and increasing long-term interest rates, further constraining commodities.
Economic and inflationary concerns
Tariffs could raise inflation in the US while simultaneously depressing global commodity prices due to reduced demand. This dynamic may complicate the Federal Reserve’s (Fed) efforts to control inflation, potentially leading to prolonged high interest rates.
Climate policy reversals
Trump has vowed to withdraw from the Paris Climate Agreement and declared a “national energy emergency,” reversing climate regulations and boosting fossil fuel production. His administration is expected to cancel a $6 billion Department of Energy program aimed at industrial emissions reduction and repeal incentives for electric vehicles. These changes could suppress demand for critical materials used in clean technology, such as base metals.
At the same time, deregulation of oil, gas, and mining operations may increase the supply of key commodities like copper, aluminium, nickel, and cobalt. Major projects, such as Rio Tinto’s copper mine in Arizona, could proceed after years of delays. While immediate production increases are unlikely in 2025, long-term supply growth is possible.
Geopolitical risks and energy markets
A ceasefire between Israel and Hamas, brokered just before Trump's inauguration, has eased some geopolitical risk, though its stability remains uncertain. As we write, a peace deal between Russia and Ukraine is being brokered by the US. Short-term oil price spikes are possible if sanctions are initially tightened to get parties to the negotiating table but, ultimately, we could see easing oil and gas prices if a deal is hashed out.
The US has been pressuring Europe to purchase more American natural gas, but Russia’s LNG shipments to the EU remain significant. A resolution of the Russia-Ukraine war could weaken US leverage in energy negotiations, making Europe less dependent on American gas.
Stricter enforcement of Iranian oil sanctions under Trump could drive oil prices higher. However, OPEC2 members may counteract this by increasing supply, potentially offsetting price gains.
China’s economic strategy and commodity demand
China remains the world’s largest consumer of commodities, yet its recent economic weakness has limited demand growth. Unlike previous economic cycles where China launched large stimulus measures, its current approach focuses on smaller, targeted interventions. The government has stabilised the real estate sector but remains wary of excessive stimulus due to debt concerns.
China is investing heavily in clean technology and renewable energy infrastructure, supporting metal prices despite weak real estate demand. US tariffs on China could accelerate its push toward energy independence, promoting domestic adoption of solar, battery, and electric vehicle technologies.
Trade tensions could escalate into retaliatory actions, such as China restricting exports of critical materials, as seen with gallium, germanium, and graphite in response to semiconductor disputes. Further restrictions could impact global supply chains for energy transition materials.
China’s depreciating Yuan complicates economic policy. The People’s Bank of China has been intervening to stabilise the currency, limiting its ability to cut interest rates. While a policy shift to boost growth led to short-term market gains in 2024, further action remains constrained by currency pressures.
Conclusion
In the Year of the Snake, we are searching for antivenoms to counter the potential threats posed by trade wars, a strong US dollar, and a China that may be unable or unwilling to overcome its economic weakness.
We see strong opportunities in gold, silver, aluminium, copper, zinc and European natural gas, as each of these has compelling drivers that could withstand broader headwinds in the commodity complex.
As policies become clearer, we may find that our fears were overstated, potentially paving the way for a relief rally across the broader commodity complex. Until then, we place our confidence in these antivenoms.

Amazon Consolidating on Support to $365Amazon checked back into support today. If you want it, this is the area to buy it. Target $365.
Nasdaq Industrial also checked support today, so pretty likely AMZN will hold and rise along with INDS.
Good luck!

Airbnb Looking to RunAirbnb looks poised to run to $250. This company has very seasonal revenue so don't expect much for q1, but ABNB being in the INDS index, which is currently consolidating for it's bull run, means ABNB is likely to finally have it's day.
Good luck!

Stanley Black & Decker | SWK | Long at $85.00Stanley Black and Decker NYSE:SWK breached my selected historical simple moving average and may likely be forming an upward channel into an overall positive reversal. It's "obeying" the simple moving average lines so far, with a nice bounce off the base at $85. Earnings and cash flow are expected to grow into 2026, but caution should be used if the economy slows further... It currently has a dividend yield of 3.74%. While I wouldn't be surprised if the price dipped to close out the price gap in the low $80s, NYSE:SWK is in a personal buy zone at $85.00.
Target #1 = $100
Target #2 = $114
Target #3 = $125
Target #4 = $137

Caterpillar (CAT): Construction Strength Amid Industrial SlumpCharting Caterpillar can be challenging, given the complexity of its price structure, but it’s fascinating to see how well it respects Elliott wave theory and trend channels. Despite the difficulties, the adherence to these principles makes the analysis quite promising.
The construction sector for Caterpillar remains robust, while the true growth catalyst is expected from a recovery in the mining industry, driven by demand from China and other regions. However, it’s not all positive: industrial activity in the U.S. has been sluggish, with the Institute for Supply Management Purchasing Managers' Index falling below 50 in 21 of the last 22 months—marking one of the worst streaks on record. This industrial downturn certainly adds pressure.
On a higher time frame, there’s not much new to add. However, we are looking for Caterpillar to move higher to complete wave (3). As shown in the zoomed-in chart (the chart in the left frame), we can observe how accurately the price is moving within the trendline. The "best-case" scenario for us would involve a push above the channel, followed by a sell-off. If this happens, it will provide a clearer indication that a larger correction—wave (4)—is imminent.

gold-silver-ratio
As You can see an apex which showed bullish absorption was cutted the bearish style, to be tested if it will sustain strength. Now we see a rising wedge with shortening of time in the upper area and no shortening no expension of time at the lower boundaries.
This leads to the conclusion, that gold is sold and silver is bought.
Silver and copper are industrial metals. When they show strength vs. gold the markets are in an early stage of a big trend with a lot of bredth indicators moving to the upside soon.

3M Position Trade✨ NEW: 3M...UT (3M, 3D) ✨ POSITION TRADE ✨
BLO1 @ 74.34
BLO2 @ 50.99 (Wealth Trade - I may never let this position go)
TP1 @ 112.53 (shave 25% from BLO 1)
TP2 @ 175.83 (shave 25% from BLO 1)
TP3@ 215.82 (shave 25% from BLO 1)
3M Co. is a technology company that creates industrial, safety, and consumer products. They operate under different segments such as Safety and Industrial, Transportation and Electronics, Health Care, and Consumer.
Recently, the company has faced a major challenge involving around 260,000 pending lawsuits due to their military earplugs malfunctioning. The outcome of these legal proceedings could greatly impact 3M, either causing severe consequences or presenting a unique investment opportunity.
Our team predicts that despite the uncertainty, institutions will likely intervene and purchase 3M's stock as it returns to its established pattern of gradual and steady growth, also known as the company's intrinsic or true value. However, it is important to acknowledge that the future outcome is still subject to change and could sway in either direction.
Here is my strategy: I plan to sell 25% of my BLO1 holdings at every take profit point, while keeping the remaining amount for a long-term investment. However, I have no plans to sell any of my BLO2 holdings and will be holding them for the long term. This is commonly referred to as the "diamond hand strategy."
Happy Trading‼️

Topping Pattern Example (Head and Shoulders)Hunstman is a chemical manufacturer whose earnings have plummeted over 85% compared to the first half of 2022. The chart is a prime example of a large head & shoulders pattern. Analysts expect its earning to remain depressed and the chart shows signs of Distribution over the past 2 years.

Bull flag breakout on Deere and CompanyBull flag breakout on Deere and Company. I will wait to see if there is a retest of the upper trendline which was acting as resistance

Texas Instruments (TXN) - Is the stock overvalued?About Texas Instruments
Texas Instruments (TXN) is a technology company that designs and manufactures a wide range of products, including analog and embedded processing chips. The company operates in two segments, Analog and Embedded Processing, and its products are used in various applications, including automotive, communication infrastructure, industrial, and personal electronics.
Strong financial performance in recent years
In recent years, Texas Instruments has seen strong financial performance, driven by strong demand for its products and increasing demand for its embedded processing solutions. The company has consistently delivered revenue and earnings growth, driven by its broad portfolio of products and its ability to continuously innovate and bring new products to market.
Is Texas Instruments (TXN) stock overvalued?
From a technical perspective, the stock price of Texas Instruments has been in an uptrend since the beginning of 2020, and has outperformed the S&P 500 index over that time period. The stock price has consistently made higher highs and higher lows, indicating strong bullish sentiment. In addition, the stock has consistently traded above its 200-day moving average, which is often used as a measure of long-term trend.
The Relative Strength Index (RSI) is a momentum oscillator that measures the strength of a stock's price action. The RSI for Texas Instruments is currently in bullish territory, indicating that the stock is overbought and may be due for a pullback. However, the RSI can remain in overbought territory for an extended period of time, so it is important to consider other technical indicators when making a trading decision.
One potential area of concern for the stock is its valuation. Texas Instruments currently trades at a premium to its historical valuation, which could indicate that the market is pricing in high expectations for future growth. In addition, the stock's price-to-earnings (P/E) ratio is higher than the industry average, which could make it vulnerable to a pullback if the company's earnings growth slows or if the market becomes more cautious.
Conclusion
In conclusion, Texas Instruments has demonstrated strong financial performance and technical strength in recent years. However, investors should be aware of the stock's elevated valuation and consider other factors, such as the company's earnings growth and the overall market sentiment, when making a trading decision. It is always recommended to consult with a financial advisor before making any investment decisions.
Disclaimer
Norvestio AS only offers analysis based on analyst estimates and historical data, and our articles are never meant to be taken as financial advice. It doesn’t represent an advice to buy or sell any stock, and it doesn’t take into consideration your goals or financial position.

Legrand (LR.pa) bearish scenario:The technical figure Channel Up can be found in the daily chart of the French company Legrand (LR.pa). Legrand is a French industrial group. It is one of the world leaders in electrical and digital building infrastructures and connected solutions. Legrand is established in 90 countries and its products are distributed in nearly 180. It generates 85% of its sales internationally. The group has expanded its product range in sustainable development and energy saving technologies, and has developed new products for EV charging/electric vehicles, lighting control and datacenters. The Channel Up broke through the support line on 23/12/2022. If the price holds below this level, you can have a possible bearish price movement with a forecast for the next 17 days towards 71.80 EUR. Your stop-loss order, according to experts, should be placed at 85.88 EUR if you decide to enter this position.
Legrand, a world leader in electrical, digital infrastructure and connected solutions, has announced its acquisition of Encelium, an Ontario, Canada-based manufacturer of advanced commercial lighting controls. The acquisition of Encelium brand and products, which takes effect immediately, comes as part of Legrand's ongoing global strategy to further strengthen its position in the commercial lighting control sector. A leader in this category, Encelium is already an integral component within thousands of buildings, supporting the needs of occupants, tenants, and facilities managers through people-centric lighting and energy efficiency.
Risk Disclosure: Trading Foreign Exchange (Forex) and Contracts of Difference (CFD's) carries a high level of risk. By registering and signing up, any client affirms their understanding of their own personal accountability for all transactions performed within their account and recognizes the risks associated with trading on such markets and on such sites. Furthermore, one understands that the company carries zero influence over transactions, markets, and trading signals, therefore, cannot be held liable nor guarantee any profits or losses.

6/5/22 WMWaste Management, Inc. ( NYSE:WM )
Sector: Industrial Services (Environmental Services)
Market Capitalization: $66.068B
Current Price: $159.12
Breakout price: $160.10
Buy Zone (Top/Bottom Range): $158.40-$153.25
Price Target: $166.20-$168.80 (1st), $188.70-$190.10 (2nd)
Estimated Duration to Target: 55-59d (1st), 166-176d (2nd)
Contract of Interest: $WM 1/20/23 160c, $WM 7/15/22 160c
Trade price as of publish date: $4.20/contract, $11.50/contract

Lion Industries MYX:LIONIND #4235Short term
Look forward LionInd (4235) breaks above first resistance 0.62, support at 0.57
Resistance 2: 0.74
#bursa #lionind #metal #industrysector

GE Retirement PlanPost-correction GE could retest the median on its current declining fork, fundamentally they are a company that makes things, real things that the world needs right now, and in the future.
This is an extremely long term chart with little near term trading implication, but if we see a bullish pull from that median I wouldn't hesitate to invest in diverse large industrials like this.

Stock Indexes have peaked. A slow roll-over has begun.In this video:
* Current price action of the dollar coinciding with that of the markets and an understanding that the Fed may raise interest rates soon, all indicate that the broader markets will begin to roll over and turn bearish.
* Cryptos may still have time to complete one more bullish cycle before the markets turns extremely bearish.

$IR: Is the ESG Era Upon Us?ESG (Environmental, Social and Governance) is a buzzword in the investment community that has begun to pick up steam. Will the dollar continue to appreciate giving a buffer for US spending bills and a liking for stocks with a lot of domestic potential? Time will tell. Good luck trader

DJI Dow Jones Industrial Average Santa Rally?The Santa Rally is set to start on Monday, Dec. 27.
This period gave positive return for the S&P 500 78.9% of the time.
Since 1950, the average return of the Santa rally was 1.33%.
How do you think this will be reflected in theDJI index?
The reasons could be optimism over the new year ahead or holiday spending.

$ORLY: Oh-oh-oh-oh-maybeeee? ♬O'Reilly along with other automotive retail are potentially showing promise after the XRT rout. Being in a higher market cap than comparative retail stocks could help ORLY benefit in a deflationary environment assuming the dollar trends higher in the intermediate - long term. Gas or electric and an ever growing group of DYI'ers automotive retail stands to benefit long term in my opinion.
