BITCOIN Has Unfinished Business Below $74K! Will It Return?Key Disclaimer: Inefficiencies Don’t Need to Be Filled
Let’s set the stage clearly: inefficiencies like the one at $73,624.98–$74,420.69 for BTCUSD do not HAVE to be filled.
They’re a TENDENCY, not a rule, an intriguing opportunity to explore high-probability zones. If Bitcoin doesn’t return to this level, no harm is done; but this is a very good opportunity to analyze the term, as such... let’s break it down.
What Is an Inefficiency?
An inefficiency, or sometimes a fair value gap (FVG), is a price range with "minimal" trading activity, often caused by a rapid move—here, a rally—creating a liquidity imbalance. On the weekly BTCUSD chart, this area between wicks spans $73,624.98 to $74,420.69, likely formed during a sharp rally around April 2025.
This untested range makes it a potential target for future price action, as markets often seek to resolve such imbalances. Notably, the price has already approached this zone, and there’s a chance it may never return. However, around $74,400, there are still some “unfinished things to do”, untested liquidity, or orders, which could draw the price back if conditions align.
Why Do Inefficiencies Attract Price?
Inefficiencies often act as magnets for price due to:
Liquidity Seeking: Markets revisit areas with unfilled liquidity (stop-loss or pending orders) to balance supply and demand.
Market Memory: Traders and algorithms, target these levels, reinforcing their significance.
Mean Reversion: After rapid rallies, the price may retrace to test imbalances before continuing. (atm we are probably too far from it but still keep this area in your minds)
Institutional Activity: Large players might re-enter at these levels, making them key zones for reversals or consolidation.
Historically, assets tends to revisit such areas, as the chart notes.
BTCUSD Context: $103,000 with Bullish Momentum
As of May 10, 2025, BTCUSD is at ~$103,200 on the weekly chart, on the way to confirm a weekly breakout above $100,000, supported by higher highs, an ascending channel, and macro factors ( for example ETF inflows), signaling quite a strong momentum.
The inefficiency at $73,624.98–$74,420.69 is 28–29% below the current price, a deep pullback that might require a catalyst like a macro correction, negative crypto news, or profit-taking. Given the price has already approached this zone, it may not return, but the “unfinished business” around $74,400 keeps it on the radar. Still, strong trends can bypass inefficiencies, and factors like time decay or adoption may drive prices higher.
Trading Approach, Short-, Mid-Term Investors Take Your Profits!
This formation of inefficiency is not a prediction to short, it’s an opportunity to monitor.
Still, if you’re a short- to mid-term investor, it might be a smart move to take some profits here and observe what unfolds next.
Right now, we’re potentially seeing a double top forming around major psychological levels. And to be honest, the inefficiency below (shown on the chart) still lingers in the back of my mind.
People often ask me: “When is a good time to take profits?”
My answer? Now. It is a perfect example and it fits to all assets.
And here's why. There are clear scenarios that help remove the guesswork:
1. You sell now, and the price continues to rally higher.
That’s not a problem. By selling, you’ve reduced your risk, and securing your profits - always a smart move.
If the price breaks above $100K, you can always buy it back after a confirmed breakout and retest.
That’s a strong sign that investors are willing to pay higher prices for BTC, and historically, after such breakouts (like with the $50K level in August 2024), the market tends to come back to retest that breakout zone.
Of course, if you’re a long-term investor with a 3-5+ year horizon, you may choose to ride it out. In that case, trying to time this might just be over-managing your position. There’s always a chance BTC won’t retest $100K again.
2. The best-case scenario if you take profits now:
You get the chance to buy back lower.
If the market pulls back, keep that inefficiency level in mind—there’s also a mid-term trendline, previous yearly highs, and other technical elements that haven’t been tested yet.
Traders’ psychology hasn’t really been pushed to the limits at this stage, and in my view, the crypto market loves to test limits.
So if you’re a short- or mid-term investor who bought in at lower levels, this is a good time to seriously consider locking in some profits.
Step back, and let the price action guide the next move.
Listen—just listen.
Conclusion
Inefficiencies like the one between $73,624 and $74,420 don’t demand to be filled—but they’re worth understanding, tracking, and learning from. Whether price revisits that zone or not, the real value lies in recognizing where the market has moved too fast and what that might mean if momentum shifts.
Right now, BTCUSD is strong. But strength can fade, sentiment can shift, and “unfinished business” below still holds weight for traders who think in probabilities, not certainties.
If you’re in profit—especially from lower levels—this might be one of those moments to pause, and make sure greed isn’t driving your next decision.
Whether this zone becomes just a memory or a brilliant case study, it’s already a valuable example of how understanding market structure helps you stay a step ahead—not a step behind.
Stay alert. Stay humble. And as said… listen.
Cheers,
Vaido
Inefficientpricing

Nasdaq LOWERNasdaq will try to come intro discounted area of Price. Fair value gap lower is a target which is helpful to have in your charts as well. It's likely price will gravitate towards it.

SellPrice has been rallying to RTO after break of market structure on the weekly. Price is currently on the weekly OB, and the best price to take short positions, is at the H4 OB as it fills up the inefficiency left previously. Potential targets include 1647 and 1628

Trade Alert 450 pips GBPAUD Keep a watch out for the GBPUSD we could see a massive trade develop in a short time of over 450 pips. I will keep this in the watch list as the develops over the next few days to weeks you should also.

GBPAUD: going long from hereImbalance + L VN + bottom of the range + an extra secret confluence :-D (PM if you wanna know more...)

SELL GBPUSDThis pair is in a clear downtrend from Monthly, Weekly and Daily timeframe
On H4, it has been on a retracement whereby it returned to OB and started dropping.
Now we've seen BMS for H4,and lower timeframes to sell. Therefore we're going to re enter sells when price returns to H2/H3 OB, or wait for another BMS on H4, then enter at retest of BMS or RTO that will have led to break of structure.

SELL GOLDFrom the monthly and weekly timeframe we're clearly bullish to 1907 area.
Daily and H4: we've broken structure to sell at 1850.
Therefore we'll be looking for sells from the M15 OB at 1855 and at retest of BMS at 1851. Targets indicated on the chart

SELL GOLDFrom the monthly timeframe we're clearly bullish to 1907 area.
Daily: we're bullish between 1867 and 1850 range.
H4: we're bearish because we have broken market structure and price returned to OB 1862.5 which seems to respect.
1st Bearish signal will be h4 candle close below 1858.9
2nd signal will be break of 1850.6.
This will give us a drop to 1845, then 1828.5, the 1788.

SELL GOLDGold has continued to obey our prediction. 1872 was a perfect entry although there was stop hunt above but we were not caught up. Looking for re entries to ride all the way down to 1828. All the best

SELL GOLDGold is very few pips away from the weekly OB at 1872.8. We'll be looking for sells here targeting the retracement. Since it's long term bullish, we'll take buys at 1830/1810 targeting 1900s and 2034 highs.
Areas of interest marked on the chart. All the best

Sell CHFJPYWe are currently at equal lows or consolidation on H4. There are higher chances that price will drop to the daily OB. We will take short term sells at the H4 OB and Long term buys at the daily OB. Target is 127.80

SMART MONEY US100 The US100 is still in a Bearish Market Structure but the price need a little retracement to get some more liquidity and after the targets is still at lower lows

BUY GOLDI'm looking at 2 scenarios. One, H4 candle close above 1765, then retest on M15 to add buys, or, two, Return to the 1D OB at 1738 where I have a Pending order to go long.

USD CAD - 1.258 rejection as plannedHello,
See below the previous analysis from a couple of days back;
The key level here was 1.258X where the range of price will interact with the 0.382% Fibonacci, also a pivot point in the bullish structure;
Where;
1. Price respects the imbalance upon the price reactive levels.
2. Price had offered a selling range from the reactive top of the structure and needed to find a key demand to offer a discount.
Here is the idea.
Weekly Chart
Weekly Structure has offered a heavily discounted buy opportunity to take a new position or additional upon current longs.
Refer to the volume chart to assist for volume traders - this shows the key driver for the change of hands which occurred at 1.21X zone.
Monthly
USOIL
Refer to the correlation of the US OIL chart and compare USDCAD for inverse correlation.
Attached are the key monthly and fibonacci zones intertwined.
About me;
Student of Lupacapitalpartners - imbalance analyst.
Supplyanddemand trader
Technical approach to charting
Work in Investment banking, LDN - 3years in credit.
Many thanks,
XYHLX

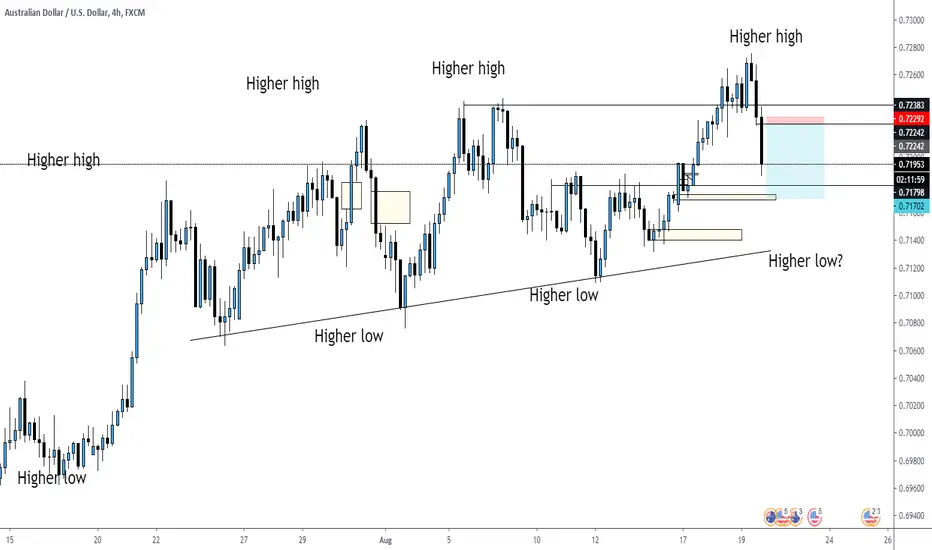
Inefficiency Created - Took it up now to take it back downWe've been in this ascending market for a while now with AUDUSD. Just took a 1:12 trade on the way up and it's time to trade the pullback!
Inefficiency created and it's time to set our orders and simply wait!
EUR/USD Long - Closing out a Monster position +29% ROI!!!!!!We have just closed a Monster long position in EUR/USD with a RR Achieved of 1:29.
We have banked + 29% ROI since 4th July 2020. Using strict risk methodology of -1%.
We have 10% left running on our long EUR/USD with our stops adjusted, locking in positive R Also.
__
This trade was a combination of Wyckoff methodology, Price Inefficiency and Order Blocks.
Please feel free to join our FREE Trading community where you will see the trade broken down across multiple timeframes, or send us a private message for any questions or queries.
Best Wishes
Phantom
__
OANDA:EURUSD
