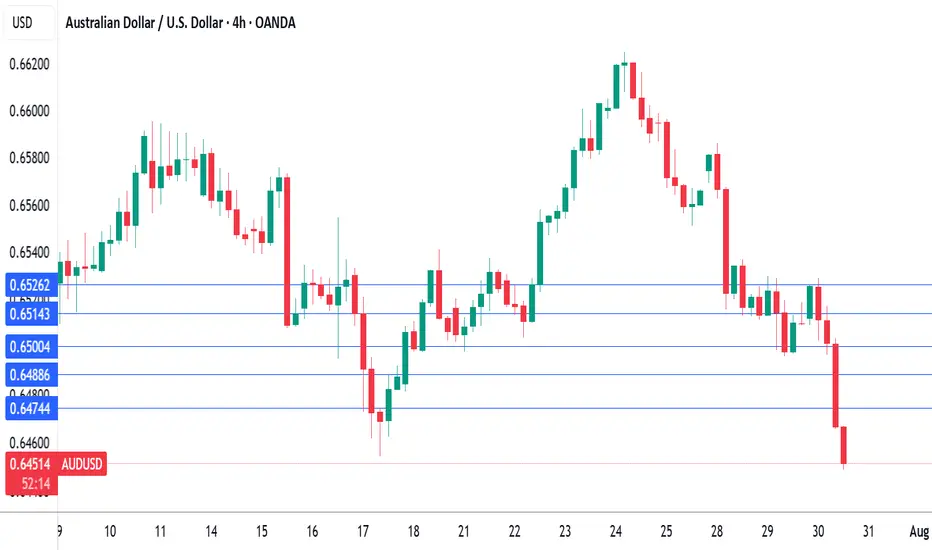
Australia inflation gauge hits 20-month high, Aussie gains grounThe Australian dollar has extended its gains on Monday. In the North American session, AUD/USD is trading at 0.6483 up 0.22% on the day. The US dollar made inroads last week against all the major currencies except the yen and gained 1.5% against the Australian dollar.
Australia's Melbourne Institute inflation guage soared 0.9% m/m in July, up sharply from 0.1% in June and marking the highest rise since Dec. 2023. The MI gauge, which provides a monthly guide to consumer inflation (official CPI is published quarterly), will no doubt raise concerns at the Reserve Bank of Australia, which has been cautious about cutting rates due to inflation worries.
Last week, CPI for the second quarter eased to 1.9%, down from 2.2% in Q1 and just below the central bank's target of 2%-3%. This cements a rate cut at the Aug. 12 meeting, after the RBA shocked the markets last month when it held rates. The markets had widely priced in a rate cut but the RBA defended its non-move, saying it wanted to see additional inflation data.
The week ended with a softer-than-expected US employment report. Nonfarm payrolls for July rose by only 73 thousand, missing the market estimate of 110 thousand. Adding to the bad news, the June and May reports were both revised sharply lower, down by a combined 258 thousand. The unemployment rate ticked higher to 4.2%, up from 4.1%.
The weak July reading and the downward revisions indicate that the labor market may be cooling more quickly than initially anticipated. The weak numbers support the case for the Fed to lower interest rates at the next rate meeting in September. The likelihood of a cut has climbed to 75%, compared to 63% on Thursday.
The soft jobs report should serve as a wake-up call regarding the effect of US tariffs on the economy, as the employment picture is worse than previously thought.
Inflation

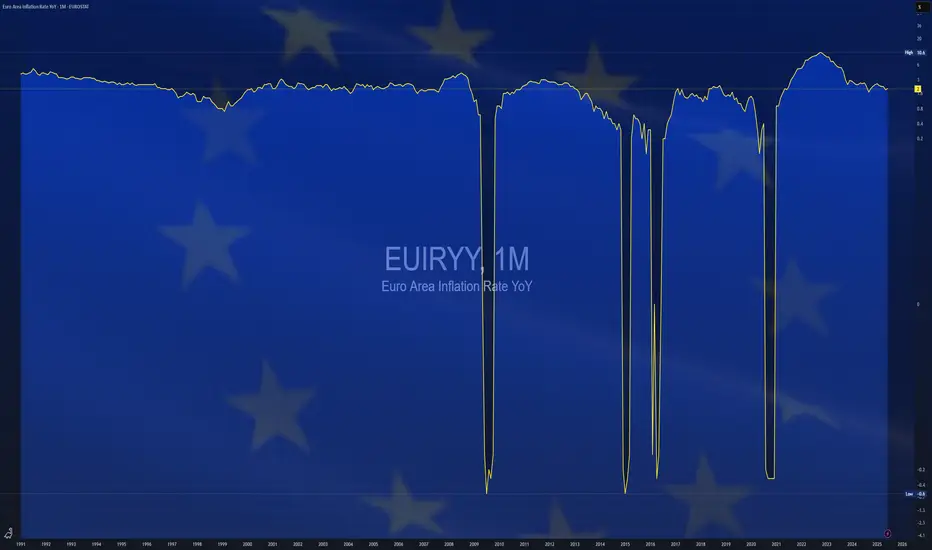
$EUIRYY -Europe CPI (July/2025)ECONOMICS:EUIRYY
July/2025
source: EUROSTAT
- Eurozone consumer price inflation held steady at 2.0% year-on-year in July 2025, unchanged from June but slightly above market expectations of 1.9%, according to preliminary estimates.
This marks the second consecutive month that inflation has aligned with the European Central Bank’s official target.
A slowdown in services inflation (3.1% vs 3.3% in June) helped offset faster price increases in food, alcohol & tobacco (3.3% vs 3.1%) and non-energy industrial goods (0.8% vs 0.5%).
Energy prices continued to decline, falling by 2.5% following a 2.6% drop in June.
Meanwhile, core inflation—which excludes energy, food, alcohol, and tobacco—remained unchanged at 2.3%, its lowest level since January 2022.
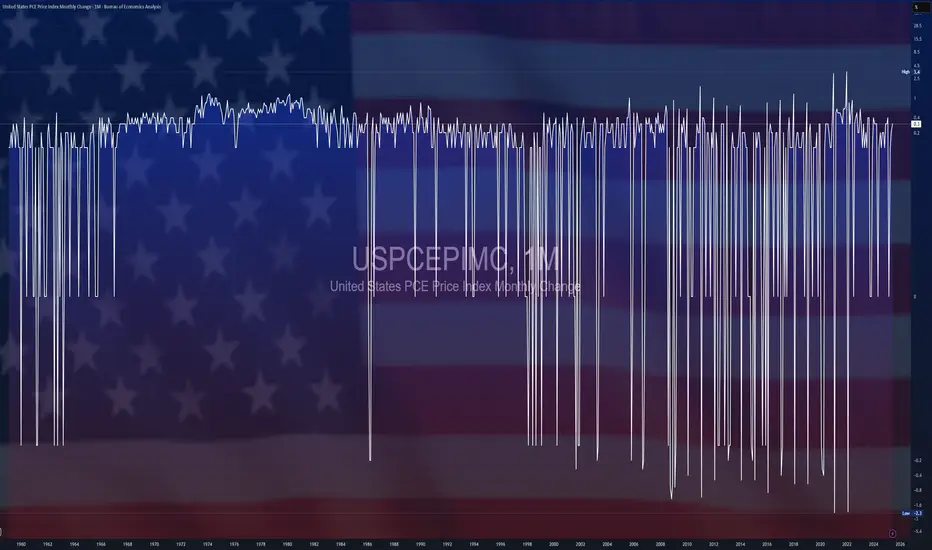
$USPCEPIMC -U.S PCE Prices Rise (June/2025)ECONOMICS:USPCEPIMC
June/2025
source: U.S. Bureau of Economic Analysis
- The US PCE price index rose by 0.3% mom in June, the largest increase in four months, and in line with expectations, led by prices for goods.
The core PCE index also went up 0.3%, aligning with forecasts.
However, both the headline and core annual inflation rates topped forecasts, reaching 2.6% and 2.8%, respectively.
Meanwhile, both personal income and spending edged up 0.3%.
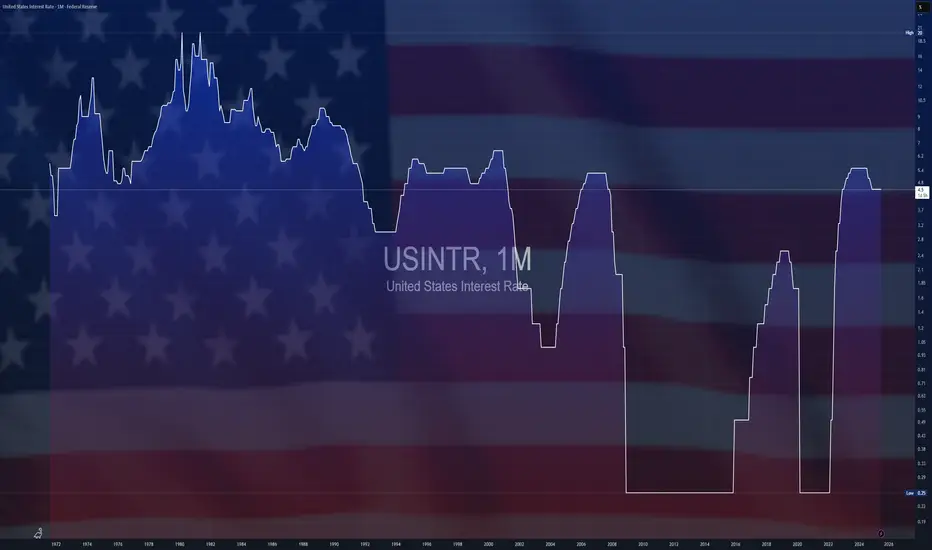
$USINTR -Feds Leaves Rates Steady (July/2025)ECONOMICS:USINTR
July/2025
source: Federal Reserve
- The Federal Reserve held rates steady at 4.25%–4.50% for a fifth straight meeting, defying President Trump’s demands for cuts even after positive GDP growth .
Still, two governors dissented in favor of a cut—the first such dual dissent since 1993.
Policymakers observed that, fluctuations in net exports continue to influence the data, and recent indicators point to a moderation in economic activity during the first half of the year.
The unemployment rate remains low, while Inflation somewhat elevated.
Australian inflation lower than forecast, Fed up nextThe Australian dollar is showing limited movement. In the European session, AUD/USD is trading at 0.6500, down 0.15% on the day.
Australia's inflation rate for the second quarter came in lower than expected. Headline CPI dropped to 2.1% y/y, down from 2.4% in the prior two quarters and falling to its lowest level since Q1 2021. This was just below the market estimate of 2.2%. Quarterly, CPI rose 0.7% in Q2, down from 0.9% in Q1 and below the market estimate of 0.8%.
Services inflation continued to decline and fell to 3.3% from 3.7%. The drop in CPI was driven by a sharp drop in automotive fuel costs. The RBA's key gauge for core CPI, the trimmed mean, slowed to 2.7% from 2.9%, matching the market forecast. This was the lowest level since Q4 2021.
The positive inflation report is a reassuring sign that inflation is under control and should cement a rate cut at the Aug. 12 meeting. The Reserve Bank of Australia stunned the markets earlier this month when it held rates, as a quarter-point cut had been all but certain. Bank policymakers said at that meeting that they wanted to wait for more inflation data to make sure that inflation was contained and today's inflation report should reassure even the hawkish members that a rate cut is the right move at the August meeting.
The Federal Reserve meets today and is widely expected to maintain the benchmark rate for a fifth straight meeting. Investors will be looking for clues regarding the September meeting, as the markets have priced in a rate cut at 63%, according to CME's FedWatch.
Surely the RBA Must Cut Rates Now?The RBA defied expectations of a cut in July, despite soft trimmed mean inflation figures in the monthly CPI report. The quarterly figures have now dropped, which I suspect leaves little wriggle room to hold at 2.85% in August. I 6ake a look at the quarterly and monthly inflation prints that matter, then wrap up on AUD/USD.
Matt Simpson, Market Analyst at City Index and Forex.com

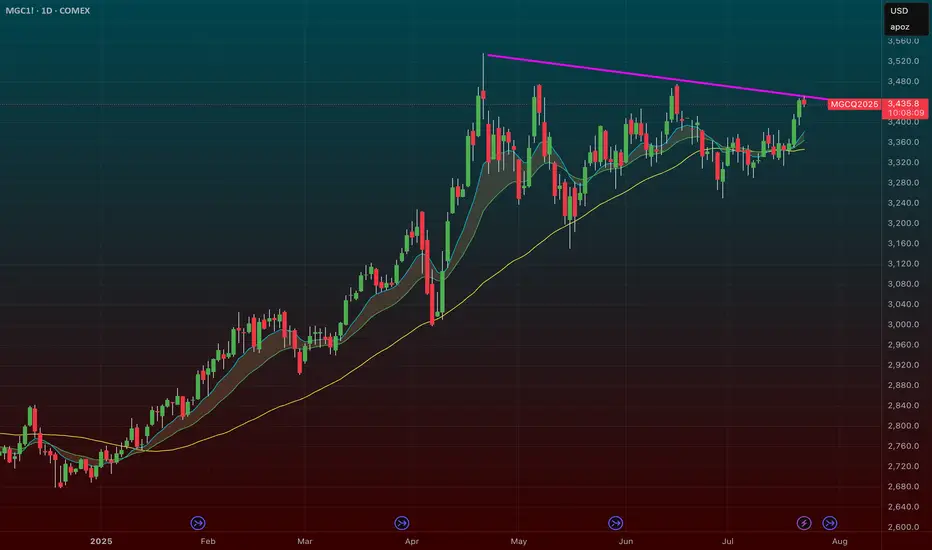
$GLD / $GC – Gold Poised for Breakout as Hard Assets FlexAMEX:GLD / SET:GC – Gold Poised for Breakout as Hard Assets Flex
Gold is setting up for a major breakout, and the broader market is finally catching on to the hard asset trade. Whether it’s inflation ticking up or the never-ending government deficit spending, the market is starting to signal something big.
🔹 Macro Tailwinds:
Inflation pressures + record deficit = a perfect storm for gold.
The dollar is under pressure — metals ( AMEX:GLD , AMEX:SLV , SET:GC ) are responding.
This theme isn’t going away anytime soon.
🔹 Technical Setup:
AMEX:GLD and SET:GC (Gold Futures) are coiled tightly just under breakout levels.
Volume is steady, and momentum is building under the surface.
A move through current resistance could send this entire trade into overdrive.
🔹 My Positioning:
1️⃣ Options: Long AMEX:GLD calls with 1-month expiration — slow mover, but clean structure.
2️⃣ Futures: Trading SET:GC contracts on the breakout side.
3️⃣ Silver Exposure: Still holding partials in AMEX:SLV — it’s following gold’s lead but with more juice.
Why I’m Focused Here:
This is not a one-day theme — hard assets are becoming a rotation trade.
If this confirms, we could see multi-week upside in precious metals.
It’s rare to get clean technicals that align this well with macro.
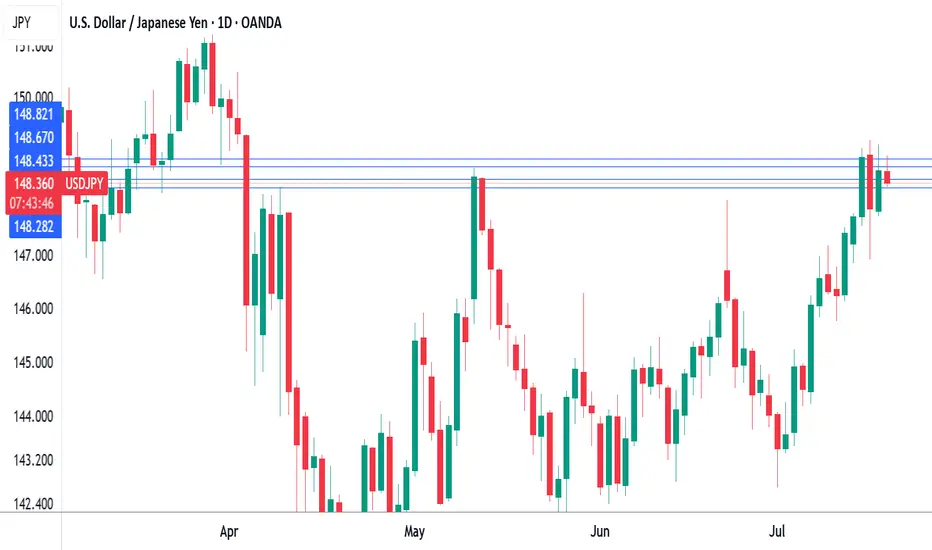
Japan's core CPI cools as expectedThe Japanese yen is showing little movement on Friday. In the North American session, USD/JPY is trading at 148.69, up 0.06% on the day. On the data calendar, Japan's inflation rate eased in June. It's a light day in the US, highlighted by UoM consumer sentiment and inflation expectations.
Inflation in Japan fell in June as expected and the yen is showing little movement today. Headline CPI dropped to 3.3% y/y from 3.5% in May, matching the consensus. This was the lowest level since Nov. 2024, as prices for electricity and gasoline rose more slowly in June. FoodThe inflation numbers come just before an election for Japan's Upper House of Parliament on Sunday. The ruling coalition is in danger of losing its majority, and if that happens, it will likely impact yields and the yen next week.
The Bank of Japan meets next on July 31 and is expected to continue its wait-and-see approach and hold interest rates. The BoJ hiked rates in January but hopes for a series of rate increases were dashed after US President Trump promised and delivered tariffs on many US trading partners, including Japan.
Trade talks between the US and Japan have bogged down and Trump has threatened to hit Japan with 25% tariffs if an agreement isn't reached by Aug. 1. In this uncertain environment, the BoJ isn't likely to raise interest rates. prices were up 7.2%, the most since March, as rice prices soared 100%. Monthly, CPI eased to 0.1%, down from 0.3% in May. Core inflation, which excludes fresh food but includes energy, fell to 3.3% from 3.7%, in line with the consensus and the lowest pace since March.
USD/JPY is testing resistance at 148.66. Above, there is resistance at 1.4882
148.44 and 148.28 are the next support levels
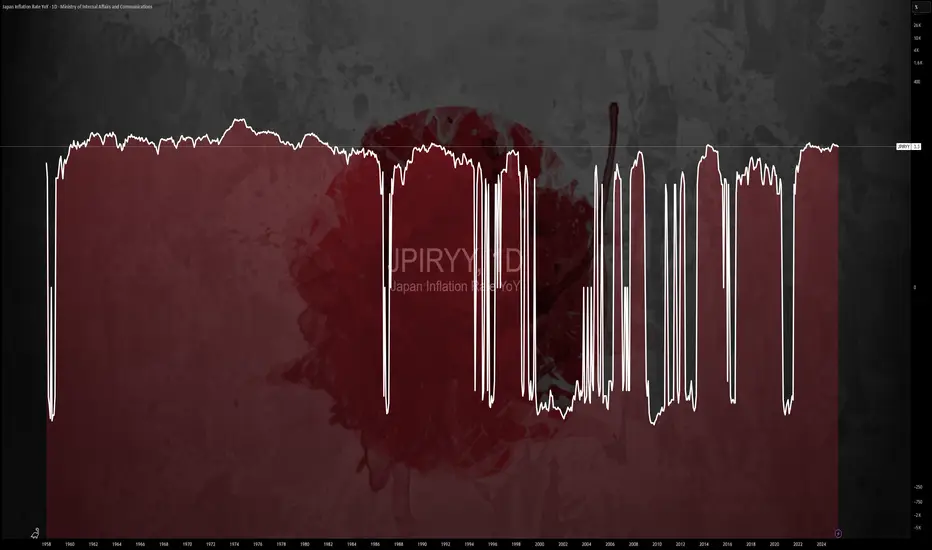
$JPIRYY -Japan Inflation Hits 7-Month Low (June/2025)ECONOMICS:JPIRYY 3.3%
June/2025
source: Ministry of Internal Affairs & Communications
-Japan’s annual inflation rate eased to 3.3% in June 2025 from 3.5% in May, marking the lowest reading since last November, as a sharp slowdown in electricity and gas prices offset persistent upward pressure from rice.
Core inflation also matched the headline rate at 3.3%, pointing to a three-month low and aligning with expectations.
$GBIRYY - U.K Inflation Rises to a 2024 High (June/2025)ECONOMICS:GBIRYY
June/2025
source: Office for National Statistics
- The annual inflation rate in the UK rose to 3.6% in June, the highest since January 2024, up from 3.4% in May and above expectations that it would remain unchanged.
The main upward pressure came from transport prices, mostly motor fuel costs, airfares, rail fares and maintenance and repair of personal transport equipment.
On the other hand, services inflation remained steady at 4.7%.
Meanwhile, core inflation also accelerated, with the annual rate reaching 3.7%.

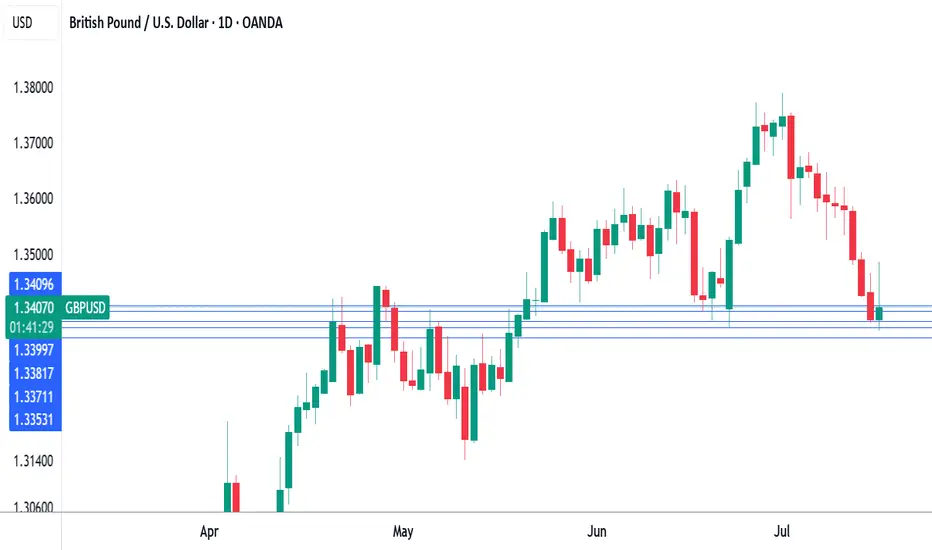
UK inflation heats up, Pound shrugsThe British pound has stabilized on Wednesday and is trading at 1.3389 in the European session, up 0.07% on the day. This follows a four-day losing streak in which GBP/USD dropped 1.5%. On Tuesday, the pound fell as low as 1.3378, its lowest level since June 23.
Today's UK inflation report brought news that the Bank of England would have preferred not to hear. UK inflation in June jumped to 3.6% y/y, up from 3.4% in May and above the market estimate of 3.4%. This was the highest level since January 2024 and is a stark reminder that inflation is far from being beaten. The main drivers of inflation were higher food and transport prices. Services inflation, which has been persistently high, remained steady at 4.7%. Monthly, CPI ticked up to 0.3% from 0.2%, above the market estimate of 0.2%.
It was a similar story for core CPI, which rose to 3.7% y/y from 3.5% in May, above the market estimate of 3.5%. Monthly, core CPI climbed 0.4%, above 0.2% which was also the market estimate.
The hot inflation report will make it more difficult for the BoE to lower interest rates and the money markets have responded by paring expectations of further rate cuts. Still, expectations are that the BoE will cut rates at the August 7 meeting, with a probability of around 80%, despite today’s higher-than-expected inflation numbers.
The UK releases wage growth on Thursday, which is the final tier-1 event prior to the August meeting. Wage growth has been trending lower in recent months and if that continues in the May reading, that could cement an August rate cut.
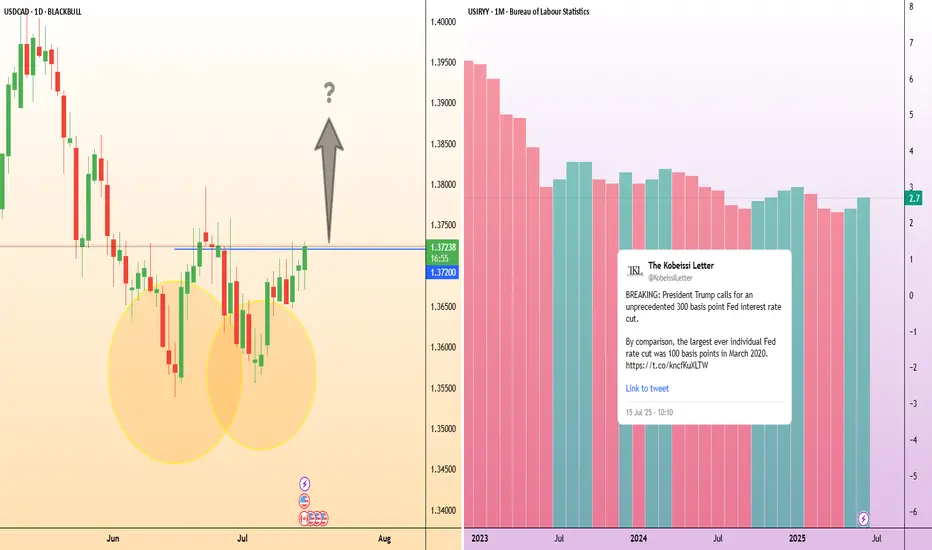
USD/CAD: Inflation gaps create opportunityIn the U.S., inflation accelerated for a second straight month, with headline CPI reaching 2.7% year-on-year in June as President Trump’s tariffs begin to push up the cost of a range of goods.
Increasing inflation could likely heighten the Federal Reserve’s reluctance to cut its interest rate, in defiance of Trump’s public demand. This could provide upward momentum for USD/CAD if expectations for rate cuts are delayed.
USD/CAD is showing signs of a potential trend reversal after finding strong support around 1.3600 in late June. Price action has since formed a series of higher lows, and the recent breakout attempt above 1.3720 suggests bullish momentum could be building.
Canada’s inflation rate, released at the same time as the US’s, edged up to 1.9%, staying below the Bank of Canada’s 2% target for a third consecutive month. With the BoC already signalling easing bias, this divergence in inflation paths may limit CAD strength.
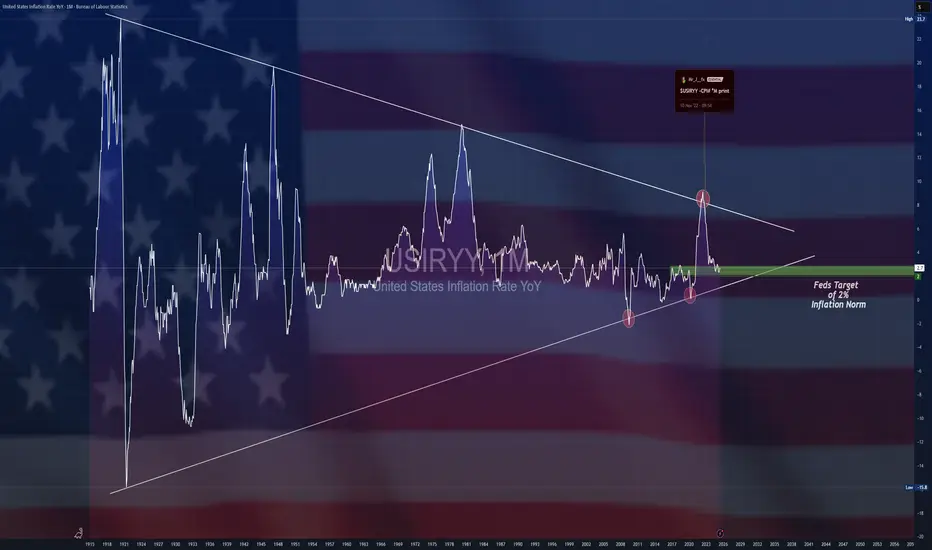
$USIRYY -U.S Inflation Rate Seen Rising for 2nd Month (June/2025ECONOMICS:USIRYY
June/2025
source: U.S. Bureau of Labor Statistics
- The annual inflation rate in the US likely accelerated for the second consecutive month to 2.7% in June, the highest level since February, up from 2.4% in May.
On a monthly basis, the CPI is expected to rise by 0.3%, marking the largest increase in five months.
Meanwhile, core inflation is projected to edge up to 3% from 2.8%. Monthly core CPI is also anticipated to climb 0.3%, up from 0.1% in May, marking its sharpest increase in five months.
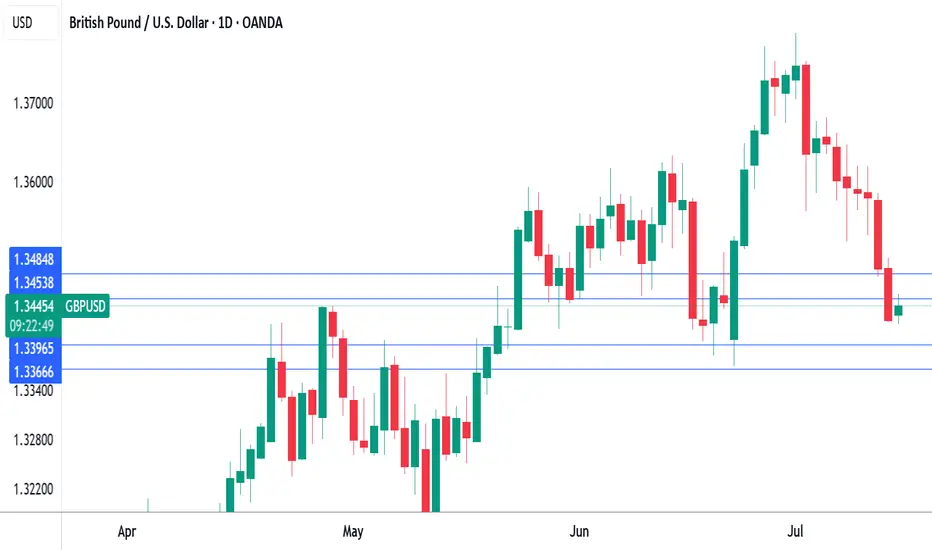
Pound under pressure ahead of US, UK inflation reportsThe British pound has edged up higher on Tuesday. In the European session, GBP/USD is trading at 1.3453, up 0.21% on the day. Earlier, GBP/USD touched a low of 1.3416, its lowest level since June 23.
All eyes will be on the UK inflation report for June, which will be released on Wednesday. Headline CPI is expected to remain unchanged at 3.4% y/y, as is core CPI at 3.5%. Monthly, both the headline rates are expected to stay steady at 0.2%.
Has the BoE's battle to lower inflation stalled? The BoE was looking good in March, when inflation eased to 2.6%, but CPI has rebounded to 3.4%, well above the BoE's inflation target of 2%. Services data has been especially sticky, although it dropped to 4.7% in May, down from 5.4% a month earlier.
At 3.4%, inflation is stuck at its highest level since February 2024 and that will complicate plans at the BoE to renew interest rate cuts in order to kick-start the weak UK economy. The central bank has lowered rates twice this year and would like to continue trimming the current cash rate of 4.25%. The Bank meets next on Aug. 7 and Wednesday's inflation data could be a significant factor in the rate decision.
In the US, if June inflation data rises as is expected, fingers will quickly point to President Trump's tariffs as finally having an impact. Recent inflation reports have not shown a significant spike higher due to the tariffs, which were first imposed in April. However, the tariffs may have needed time to filter throughout the economy and could be felt for the first time in the June inflation reading.
The Fed meets next on July 30, with the markets pricing in a 95% chance of a hold, according to CME's FedWatch. For September, the odds of a rate cut stand at 59%. Today's inflation report could cause a shift in these numbers.
GBP/USD tested resistance at 1.3454 earlier. Above, there is resistance at 1.3484
1.3396 and 1.3366 are the next support levels
EUR/CAD: Quant-Verified ReversalThe fundamental catalyst has been triggered. The anticipated strong Canadian CPI data was released as expected, confirming the primary driver for this trade thesis. Now, the focus shifts to the technical structure, where price is showing clear exhaustion at a generational resistance wall. 🧱
Our core thesis is that the confirmed fundamental strength of the CAD will now fuel the technically-indicated bearish reversal from this critical price ceiling.
The Data-Driven Case 📊
This trade is supported by a confluence of technical, fundamental, and quantitative data points.
Primary Technical Structure: The pair is being aggressively rejected from a multi-year resistance zone (1.6000 - 1.6100). This price action is supported by a clear bearish divergence on the 4H chart's Relative Strength Index (RSI), a classic signal that indicates buying momentum is fading despite higher prices.
Internal Momentum Models: Our internal trend and momentum models have flagged a definitive bearish shift. Specifically, the MACD indicator has crossed below its signal line into negative territory, confirming that short-term momentum is now bearish. This is layered with a crossover in our moving average module, where the short-term SMA has fallen below the long-term SMA, indicating the prevailing trend structure is now downward.
Quantitative Probability & Volatility Analysis: To quantify the potential outcome of this setup, we ran a Monte Carlo simulation projecting several thousand potential price paths. The simulation returned a 79.13% probability of the trade reaching our Take Profit target before hitting the Stop Loss. Furthermore, our GARCH volatility model forecasts that the expected price fluctuations are well-contained within our defined risk parameters, reinforcing the asymmetric risk-reward profile of this trade.
The Execution Plan ✅
Based on the synthesis of all data, here is the actionable trade plan:
📉 Trade: Sell (Short) EUR/CAD
👉 Entry: 1.6030
⛔️ Stop Loss: 1.6125
🎯 Take Profit: 1.5850
The data has spoken, and the setup is active. Trade with discipline.

Why Your Orange Juice Costs More?The price of orange juice is surging, impacting consumers and the broader economy. This increase stems from a complex interplay of geopolitical tensions, macroeconomic pressures, and severe environmental challenges. Understanding these multifaceted drivers reveals a volatile global commodity market. Investors and consumers must recognize the interconnected factors that now influence everyday staples, such as orange juice.
Geopolitical shifts significantly contribute to the rising prices of orange juice. The United States recently announced a 50% tariff on all Brazilian imports, effective August 1, 2025. This politically charged move targets Brazil's stance on former President Jair Bolsonaro's prosecution and its growing alignment with BRICS nations. Brazil dominates the global orange juice supply, providing over 80% of the world's trade share and 81% of U.S. orange juice imports between October 2023 and January 2024. The new tariff directly increases import costs, squeezing margins for U.S. importers and creating potential supply shortages.
Beyond tariffs, a convergence of macroeconomic forces and adverse weather conditions amplify price pressures. Higher import costs fuel inflation, potentially compelling central banks to maintain tighter monetary policies. This broader inflationary environment impacts consumer purchasing power. Simultaneously, orange production faces severe threats. Citrus greening disease has devastated groves in both Florida and Brazil. Extreme weather events, including hurricanes and droughts, further reduce global orange yields. These environmental setbacks, coupled with geopolitical tariffs, create a robust bullish outlook for orange juice futures, suggesting continued price appreciation in the near term.

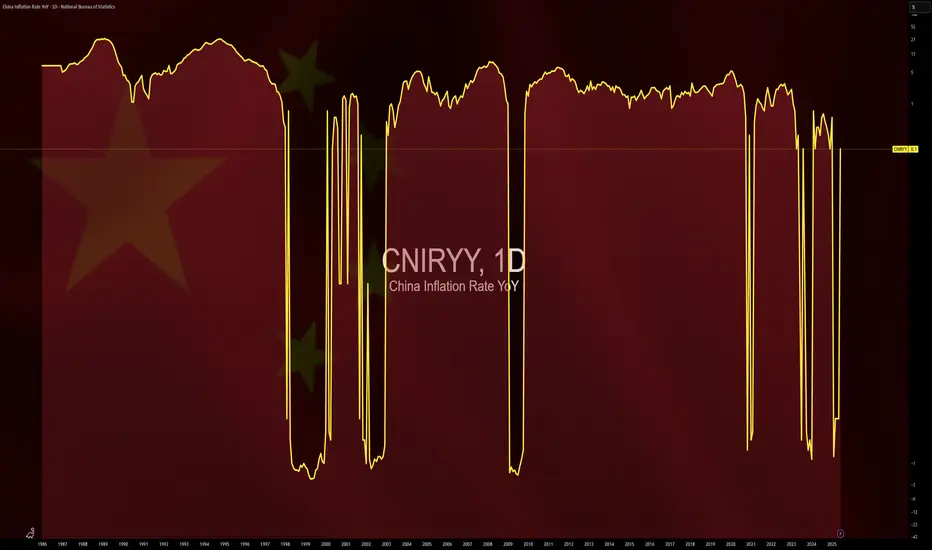
$CNIRYY -China's Inflation Data (June/2025)ECONOMICS:CNIRYY
June/2025
source: National Bureau of Statistics of China
- China’s consumer prices rose by 0.1% yoy in June 2025,
reversing a 0.1% drop in the previous three months and surpassing market forecasts of a flat reading.
It marked the first annual increase in consumer inflation since January, driven by e-commerce shopping events, increased subsidies for consumer goods from Beijing, and easing trade risks with the U.S.
Core inflation, which excludes volatile food and fuel prices, rose 0.7% yoy, marking the highest reading in 14 months and following a 0.6% gain in May.
On a monthly basis, the CPI fell 0.1%, after May's 0.2% drop, pointing to the fourth monthly decline this year.
Australian dollar stabilizes after RBA's surpriseThe Australian dollar is in positive territory after a three-day skid, declining 1.5%. In the North American session, AUD/USD is trading at 0.6532, up 0.50% on the day. The Australian dollar rose as much as 0.95% earlier before retreating.
The Reserve Bank of Australia blindslided the markets on Tuesday as the central bank held the cash rate at 3.85%. The markets had priced in a quarter-point cut at 96%, but the RBA had the last laugh. For the first time, the RBA published the vote tally, which was 6-3 in favor of maintaining the rate.
The rate statement was cautious, as members said "there are uncertainties about the outlook for domestic economic activity and inflation".
Governor Bullock tried to calm the markets, saying that the decision was about "timing rather than direction" and that the Bank would "wait a few weeks" to confirm that inflation was on track to ease and remain sustainably around 2.5%. Bullock said that "we don't want to end up having to fight inflation again".
Inflation is moving in the right direction but the RBA wants to see the second-quarter inflation report on July 30, ahead of the rate decision on Aug. 12. Headline CPI in May eased to 2.1% y/y from 2.4% in April. The core rate dropped to 2.8% from 2.4% in April, the lowest rate since early 2022.
The RBA will be hoping that waiting till August will provide some clarity with regard to US tariff policy. President Trump has pledged new tariffs against various countries but this move is not expected to have much impact on Australia's economy.
AUD/USD is testing resistance at 0.6513. Above, there is resistance at 0.6541
There is support at 0.6463 and 0.6435

$EUIRYY - Europe CPI (June/2025)ECONOMICS:EUIRYY 2%
June/2025
source: EUROSTAT
- Eurozone consumer price inflation rose slightly to 2.0% year-on-year in June 2025, up from May’s eight-month low of 1.9% and in line with market expectations, according to a preliminary estimate.
The figure aligns with the European Central Bank’s official target.
Among major economies, inflation in Germany unexpectedly declined, while France and Spain saw modest increases and Italy’s rate held steady.

S&P 500 Outlook. Best Quarter Since 2023… But What Next?The S&P 500 just logged its best quarterly performance since Q4 2023 , surging on optimism around global trade negotiations and growing expectations that the Fed may begin cutting rates as early as September. US futures are green this morning, thanks to developments like Canada backing off digital taxes, ongoing dialogues with China ahead of the July 9 deadline, and risk-on sentiment is pushing yields and the dollar lower.
But as traders, we need to ask:
Are we witnessing a genuine economic inflection point? Or is this just a liquidity-driven rally that’s pricing in a best-case scenario?
Technical View
Support Zone: 6,150 was just broken through. And 6000, the round number level, coinciding with the 20-day EMA and previous swing level.
Resistance Levels: 6,235 is the next critical ceiling, a clean breakout could see price reach the extension level of 6,415.
Momentum Indicators: RSI remains elevated and is creeping toward the overbought. While momentum is strong, watch out for the possible development of a divergence.
Possible Scenarios
The 'Soft Landing’ Is Now the Base Case
Markets are trading as if the Fed has successfully engineered a soft landing. But that’s now fully priced in, and historically, the most dangerous trades are the ones everyone agrees on. If trade talks stall, inflation re-accelerates, or earnings disappoint, the reversal could be brutal and fast.
Risk-on Sentiment Without Volume Is a Yellow Flag
Despite the price strength, volume has been tapering off. The S&P’s recent leg up occurred on lighter-than-average participation, suggesting institutions may be watching, not chasing. That’s often the case in low-volatility summers, but it also implies that any negative catalyst could cause outsized downside moves.
Macro-Fundamentals May Not Justify Valuation Expansion
Yes, inflation is slowing, and the Fed might cut. But if they do, it’s likely because growth is weakening, not because the economy is roaring. So the very condition that triggers rate cuts could also cap earnings growth!
Projection
Bullish Scenario: A confirmed breakout above 6,280 could carry us toward 6,400–6,500 by mid-Q3, especially if the trade deals progress, July inflation comes in soft, and the Fed signals accommodation.
Bearish Risk: If price fails to hold above 6,120, especially if trade optimism fades, or inflation growth spikes or Fed rhetoric shifts hawkish again, this could then open a quick pullback toward 6,000 or lower, which also aligns with the 50-day SMA.
Key Events to Watch
July 9 Trade Talks Deadline: Any sign of stalling could bring volatility back fast.
June CPI Print (July 10): Crucial for confirming the Fed's next move.
Earnings Season Kickoff (mid-July): Tech-heavy expectations may not be easy to beat after such a strong run.
Conclusion
A record-setting quarter is impressive but not necessarily predictive. This quarter’s rally has been built more on relief and expectations than hard data. When expectations (not earnings) are doing the heavy lifting, any misstep from central banks or geopolitics could unravel gains rapidly.
A rate cut might be delayed, or inflation re-accelerates, or trade talks stall; any of these could leave equities hanging. Remember: the higher the climb without real earnings growth, the harder the fall when sentiment shifts. It's not just about the chart. It is about the narrative behind the price.
What’s your bias for Q3?
Are you buying this breakout or fading the optimism? Drop your thoughts below.

Can PCE data rescue the dollar? JPY, EUR, GBP setup in playThe latest U.S. PCE report is set for release at 8:30am EDT, with both headline and core inflation expected at 0.1% month-on-month.
As the Fed’s preferred inflation measure, today’s figures could influence interest rate expectations. A stronger print may reduce the case for a July rate cut, while a softer result could add pressure on the U.S. dollar.
The dollar has already weakened this week amid speculation over central bank independence (trump is reportedly considering nominating Fed chair Jerome Powell’s successor earlier than normal in order to undermine the current chair).
Pairs to watch include, EUR/USD, GBP/USD, USD/JPY with symmetrical triangle formations suggesting breakout potential in either direction for all once the data hits.

Australia's CPI slows, raising rate cut expectationsThe Australian dollar is showing limited movement on Wednesday. In the European session, AUD/USD is trading at 0.6495, up 0.08% on the day.
Australia's inflation rate headed lower in May. Headline CPI rose 2.1%, after gains of 2.4% in the previous three months. This was below the market estimate of 2.3%. Monthly, CPI eased to 0.4%, driven by lower petrol and housing costs.
The key core CPI indicator, annual trimmed mean inflation, also dropped sharply, to 2.4% from 2.8%, its lowest level since Nov. 2021.
The soft inflation report has boosted the case for the Reserve Bank of Australia to lower rates at the July meeting. The markets have priced in a 90% probability of a quarter-point cut, up from 81% prior to the inflation release. The markets have priced in three more rate cuts this year, following rate cuts in February and May.
The markets are counting on the RBA to be dovish in the second half of 2025. With inflation not only within the RBA's target of 2-3% but also falling, the markets expect that the RBA will be keen to lower rates in order to preserve economic growth.
Federal Reserve Chair Powell testified before a House Committee on Tuesday and had a cautious message for lawmakers. Powell said that the Fed was committed to keeping inflation contained and that the Fed planned to maintain rates until the impact of tariffs on inflation was more clear and reiterated that inflation still remained above the Fed's 2% target.
Powell has faced blistering criticism from President Trump for not lowering rates. In his testimony, Powell said that Trump's attacks were "having no effects" on Fed policy.
AUD/USD pushed above resistance at 1.3726 and is testing resistance at 1.3727. Above, there is resistance at 1.3750
1.3713 and 1.3702 are the next support levels

Australian dollar jumps on Israel-Iran cease fireThe Australian dollar is up sharply on Tuesday. In the North American session, AUD/USD is trading at 0.6504, up 0.70% on the day.
Investors' risk appetite is higher today after Israel and Iran agreed to a ceasefire in their 12-day war. The markets have reacted favorably to lower oil prices as fears that Iran would close the Straits of Hormuz, which would have disrupted global oil supplies, have diminished. Risk appetite has returned and risk currencies like the Australian dollar have posted strong gains today.
The Israel-Iran war has triggered sharp swings in oil prices and there are fears of an oil price shock if the fragile ceasefire does not hold. An oil price shock would send petrol prices higher and boost inflation, complicating the Reserve Bank of Australia's plans to lower interest rates.
Australia CPI expected to ease to 2.3%
Australia releases the May inflation report early on Wednesday. Headline CPI has been stuck at 2.4% for three consecutive months, within the Reserve Bank of Australia's target of 2-3% and its lowest level since Nov. 2024. The market estimate for May stands at 2.3%. Trimmed Mean CPI, a key core inflation indication, edged up to 2.8% from 2.7% in April.
The Reserve Bank will be keeping a close eye on the inflation report, with the central bank making a rate announcement on July 8. The RBA trimmed rates by a quarter-point in May and has shifted to a more dovish stance - the Board discussed a jumbo half-point cut at the May meeting.
Fred Chair Powell appears before Congress today and Wednesday and is likely to defend the Fed's wait-and-see stance. The Fed is concerned about President Trump's tariffs and the Israel-Iran war threatens stability in the Middle East, hardly the recipe for further rate cuts. Still, there appears to be some dissent within the Fed, as two members, Michelle Bowman and Christopher Waller, have suggested that the Fed could lower rates as early as September.
AUD/USD is testing resistance at 0.6490. Above, there is resistance at 0.6522
There is support at 0.6400 and 0.6342
