Australian dollar slides after CPI stays steadyThe Australian dollar took a hit after Australian inflation was lower than expected. In the North American session, AUD/USD is trading at 0.6493, down 0.78%.
Australia’s inflation rate remained steady in January at 3.4% y/y, unchanged from December and below the market estimate of 3.6%. This matched the lowest rate of annual inflation since November 2021. The Reserve Bank of Australia’s preferred core indicator, the trimmed mean, dropped to 3.8%, its lowest level since March 2022.
The soft inflation data is an encouraging sign for the Reserve Bank of Australia that its aggressive rate-tightening cycle is keeping inflation in check and the upper level of the 1%-3% target range is not too far off. More importantly, it reduces the likelihood that the RBA will hike rates and raises expectations of two or three rate cuts late in the year. This explains the sharp decline in the Australian dollar today, as lower interest rates would make the Australian dollar less attractive to investors.
The RBA has raised rates only once since June 2023 and hasn’t ruled out rate hikes, although the markets believe that this is posturing by the central bank and the tightening cycle is over. Still, the RBA is unlikely to jump on the rate-cut bandwagon until it is convinced that inflation will continue to fall or the strong labour market shows signs of cooling. The next meeting is on March 18th and the RBA is widely expected to maintain rates and continue its “higher for longer” stance.
AUD/USD has pushed below support at 0.6584 earlier and is putting pressure on support at 0.6453
0.6526 and 0.6560 are the next resistance lines
Inflation

New Zealand dollar calm ahead of RBNZ rate decisionThe New Zealand dollar is trading quietly on Tuesday. In the European session, NZD/USD is trading at 0.6165, down 0.12%.
All eyes are on the Reserve Bank of New Zealand, which will set the cash rate on Wednesday. The central bank is expected to hold rates at 5.50% for a sixth straight time. Most of the major central banks are looking to lower interest rates but the RBNZ is an outlier in that regard, warning that it could raise rates and the markets have price in a rate hike at Wednesday’s meeting at around 25%.
The central bank finds itself in an uncomfortable position of high inflation coupled with weak growth. Inflation is running at a 4.7% clip, well above the 1%-3% target band. A rate hike would help push inflation lower but is risky in a weak economic climate as the economy could tip into a recession.
Last week, retail sales for the fourth quarter fell by 1.9%, lower than expected and marking an eighth consecutive quarter of decline. GDP growth contracted in the third quarter by 0.3% and a second straight quarter of negative growth would meet the definition of a technical recession.
RBNZ policy makers have pushed back against market expectations of a rate cut this year, insisting that it won’t lower rates until 2025. We can expect a hawkish message from the central bank at Wednesday’s meeting, even if the Bank decides to maintain rates at their current level.
There is resistance at 0.6180 and 0.6236
0.6141 and 0.6085 are providing support

USDJPY Watch: Inflation Release to Shape yen’s Path? Japan's economy recently slid to the fourth-largest position, trailing Germany. This shift is primarily attributed to a weakened Japanese yen. In 2023, Japan's GDP stood at approximately $4.2 trillion, while Germany's was around $4.45 trillion.
The weakness in the Japanese yen is pressuring BOJ Governor Kazuo Ueda to address this by tightening Japan's ultra-easy policy. However, this move is complicated by concerns about inflation, which BOJ policymakers still consider unsustainable, even as inflation negatively impacts domestic demand, contributing to a technical recession in the Japanese economy.
The upcoming release of Japan's inflation rate, scheduled for the coming Monday, is anticipated to significantly influence the BOJ's decision regarding potential rate hikes in the coming months. Analysts predict a possible rate increase as early as April, especially if the country's annual spring wage negotiations confirm a trend of substantial wage increases.
On the 4-hour chart, we are watching for the possibility of the USDJPY breaking above the weekly high of 150.430 and reversing the string of lower highs going back to the beginning of last week (which just so happens to be the yearly high for the pair).

USD/CAD drifting ahead of FOMC minutesThe Canadian dollar is trading quietly on Wednesday. In the North American session, USD/CAD is trading at 1.3517, down 0.07%.
Investors are anxiously awaiting the release of the minutes of the Fed’s January meeting later today, hoping for some insights about the Fed’s future interest rate path. The markets had priced in a March cut after the Fed signaled in December that it would cut rates. These expectations have been slashed, however, as the Fed has pushed back against expectations of a March cut and economic data has been stronger than expected. The markets are now eyeing the June meeting for a rate cut.
Canada’s inflation rate dropped to its lowest level since June 2023 but the Canadian dollar showed little interest. Headline CPI declined to 2.9% y/y in January, down from 3.4% in December and below the market estimate of 3.3%. This marks the first time that inflation has fallen within the Bank of Canada’s target range of 1%-3% since June 2023. The main drivers of the decline in the headline reading were sharp drops in the price of fuel and food.
Core inflation, which excludes fuel and food, showed a modest decline in January. The average of two of the Bank of Canada’s core measures of inflation came in at 3.35% in January, below the December gain of 3.6%.- The decline in inflation is an encouraging sign for the Bank of Canada. Still, both the headline and core readings are well above the BoC’s goal of 2% inflation, which is the midpoint of the target range.
Traders should keep in mind that inflation has been zigzagging , as it rose unexpectedly in December and fell more than expected in January. As analysts like to say, inflation does not move in a straight line. This leaves BoC policy makers with some uncertainty as to where inflation is headed, but what is clear is that a rate cut is very unlikely until the BoC is convinced that inflation is on a downward trend.
USD/CAD is putting pressure on support at 1.3500. Below, there is support at 1.3415
1.3571 and 1.3656 are the next resistance lines

XAUUSD FOMC UP then Downtrend❤️MY FOREX TEAM❤️
INFORMATION
Gold (XAU/USD) rose for the fourth straight session on Tuesday (+0.50% to $2,027), firmly establishing itself above the $2,025 mark, supported by declining U.S. Treasury yields and a subdued U.S. dollar, with risk-averse sentiment on Wall Street likely reinforcing the metal’s advance.
💲BUY GOLD 💲
💲SELL GOLD 💲
Signal Updates in chart. Followers continuously receive update.
Everyone success..👍👍👍
❤️MY FOREX TEAM - Technical Analysis
Technical indicators SMA | EMA | MACD | SAR | VWAP | RSI | MARKET TREND | NEWS
❤️NOTE
FOMC MINUTES IN FEW HOURS
❤️MONEY CAPITAL MANAGEMENT
⚡️ Only Trade With Risk Capital
⚡️ Cut Losses Short, Let Profits Run On
⚡️ Avoid Using Too Much Leverage
⚡️ Avoid Taking Too Much Heat
⚡️ Do Not Give in to Greed
⚡️ Take profit equal to 4-6% of your capital
⚡️ Stop lose equal to 2-3% of your capital

New Zealand dollar rises on strong services dataThe New Zealand dollar continues to gain ground and has extended its gains for a fourth straight day. In the North American session, NZD/USD is trading at 0.6149, up 0.44%.
New Zealand’s BusinessNZ Performance of Services Index improved to 52.1 in January from 48.8 in December, above the forecast of 49.6. This put the index in expansion territory and marked the highest pace of activity since July 2023. The 50 level separates contraction from expansion. This is welcome news for the economy, which has cooled down due the Reserve Bank of New Zealand’s steep rate-tightening cycle.
Is the RBNZ done with raising rates? The markets think so and have priced a rate cut for the middle of the year. The central bank has been more cautious and has pushed back against these expectations. Governor Orr’s said last week that inflation expectations remain too high, the latest salvo aimed at dampening rate cut speculation. At its last meeting in November, the RBNZ said it hadn’t ruled out a rate hike and projected no rate cuts before mid-2025.
New Zealand’s inflation rate is running at 4.7%, more than double the midpoint of the 1%-3% target range. The RBNZ is unlikely to trim rates until inflation falls much closer to 2% and unless inflation drops dramatically, a rate before late in the year is looking doubtful. The RBNZ meets next on February 28th and is expected to keep rates unchanged for a fifth straight time.
NZD/USD is putting pressure on resistance at 0.6168. Above, there is resistance at 0.6211
0.6109 and 0.6066 are providing support

Firepower abounds for Japanese equitiesJapanese equities ended 2023 on a high note. Japan’s post pandemic re-opening, accommodative monetary stance, high equity risk premiums and improving corporate governance reforms were important tailwinds for Japanese equities in 2023.
Over the last 12 months Japan has benefited from global investor inflows who are diversifying their investments in Asia, with geopolitical tensions and sluggish growth causing a rotation from China to Japan. There are several catalysts in place to fuel Japan’s equity market rally:
Increasing capex & higher wage growth
Revamping the Nippon Individual Savings Account (NISA)
Corporate Japan’s ongoing reform initiatives
Capex outlook bolstered by manufacturers
The end of deflation is a catalyst unique to Japan. The Bank of Japan’s (BOJ) December Tankan survey indicates manufacturers will continue to boost capex in fiscal 2024 to prepare for the next growth cycle. Manufacturers plan to increase capex in fiscal 2024 by 14.6%2. Higher cash holdings for Japanese corporates and labour shortages are important incentives to invest in automation over the long run. Japan is at a demographic crossroads. The employment conditions diffusion index (DI) highlights Japan’s labour shortage to be the worst in 30 years3. To compensate, companies will need to invest in improving productivity.
Demographics driving wage inflation
At the same time, waning labour supply owing to an aging population is likely to bring back wage growth. The spring wage growth negotiations in 2023 drove wages up by 3.6%4 (the highest level in 30 years) and 2024 could see a further rise. Demand continues to increase in healthcare and social welfare owing to increasing domestic demand. Strong wage growth remains the key to the sustainability of inflation and inflation is likely to influence investors choice of asset allocations. As long as Japanese equities continue to benefit from inflation, we believe it would be natural for funds to increasingly flow into Japanese equities.
Japan’s savings to investment drive
Japan is transforming into an asset management led nation under the leadership of Prime Minister Kishida. In an effort to unlock nearly US$14Trn of household financial assets tied up in cash deposits, Japanese leaders are embarking upon reforms, like the introduction of 401(k)s in the US back in the 1970s. This is being done with the introduction of a revised Nippon Individual Savings Account “NISA” program offering tax benefits and portability. Starting in 2024 maximum investment amounts allowed under NISA have been increased and investors can enjoy the system’s tax benefits permanently.
Japan’s wave of reform
Corporate Japan’s ongoing reform initiatives, which include the Tokyo Stock Exchange’s (TSE) March 2023 announcement dubbed the “Price to Book (PBR) Guideline”, discussed here had a strong impact on companies. This was evident from the immediate rise in payout ratios following the announcements. By the end of January, the TSE plans to provide a list of companies that have either disclosed capital efficiency measures or have such measures under consideration. There is a strong likelihood that companies ‘under consideration’ could surprise on the upside with capital return announcements in the upcoming results season.
Japan continues to deliver strong earnings results
Japan’s economy has continued to recover, and we expect the economy to withstand the modest slowdown in global growth. Japanese equities are testing 34-year highs in 2024, bolstered by 2Q FY3/24 earnings results. Net income for Japanese equities came in 6.2% ahead of consensus, with beats concentrated in domestic-oriented sectors including utilities & food/household products5. Corporate reforms had a significant impact on chemicals and auto parts sectors. Japan’s earnings revision breadth remains in positive territory in contrast to earnings trends in China and Europe. Positive earnings revisions alongside a structural trend to rising return on equity (ROE) is supporting Japan’s equity outperformance versus the rest of the world.
Monetary policy likely to stay on hold until Q2
An important concern in 2024 remains the path of monetary policy by the BOJ, its impact on the yen and the repercussions for Japanese equities. Governor Ueda told Prime Minister Kishida that the Bank will monitor the strength of domestic demand, taking into consideration whether higher wages push services prices higher and the 2024 wage outlook. Recent inflation data continues to slow, as the prior high import costs work through the system amidst soft domestic demand. We expect the BOJ to exit negative interest rates in Q2, taking into consideration the spring wage negotiations. The yen may appreciate in H2 2024, on narrowing US-Japan interest rate spreads. A stronger yen could renew concerns over a possible negative effect on Japanese corporate earnings. However, a strong yen may not be too much of a hindrance to Japanese equities, with the market set on the theme of further vitality in the economy with rising wages and improving capex.
Sources
1 Factset, WisdomTree as of 31 December 2023
2 Bank of Japan, 13 December 2023
3 Bloomberg as of 31 December 2023
4 Japanese Trade Union Confederation (Rengo)
5 IBES, Factset, MSCI Japan
This material is prepared by WisdomTree and its affiliates and is not intended to be relied upon as a forecast, research or investment advice, and is not a recommendation, offer or solicitation to buy or sell any securities or to adopt any investment strategy. The opinions expressed are as of the date of production and may change as subsequent conditions vary. The information and opinions contained in this material are derived from proprietary and non-proprietary sources. As such, no warranty of accuracy or reliability is given and no responsibility arising in any other way for errors and omissions (including responsibility to any person by reason of negligence) is accepted by WisdomTree, nor any affiliate, nor any of their officers, employees or agents. Reliance upon information in this material is at the sole discretion of the reader. Past performance is not a reliable indicator of future performance.

Australian dollar rebounds, employment data loomsThe Australian dollar is in positive territory on Wednesday. In the North American session, AUD/USD is trading at 0.6488, up 0.54%. The Australian currency slid 1.18% on Tuesday, following the stronger-than-expected US inflation report.
The Australian dollar suffered its worst one-day performance on Monday since October 2023, sinking 1.16%. This was due to the US inflation report, which fell from 3.4% to 3.1% but was higher than the market estimate of 2.9%. Core CPI remained unchanged at 3.9%, above the market estimate of 3.7%.
The markets reacted to the inflation reading by paring expectations of a March rate cut to just 4%, compared to 16% prior to the report, according to the CME FedWatch tool. In December, the odds of a rate cut in March were above 70%, but strong US data and the Fed’s pushback against a March cut have virtually wiped out the chances of a March move. The markets have fully priced in an initial cut in June but if the economy shows signs of weakness, a May cut is also possible.
Australia releases January employment data on Thursday. The economy lost 65,100 jobs in December, with full-time employment sliding by a massive 106,600, as part-time jobs rose 41,400. We should see a rebound from these very soft numbers, with the market estimate for employment change standing at 30,000. The reading could have a significant impact on interest rate policy, as the central bank has said that its rate decisions will be data-dependent.
Australia will also release inflation expectations on Thursday. The RBA will be watching carefully, as inflation expectations can translate into real inflation. Inflation expectations were unchanged at 4.5% in January and are expected to ease to 4.3% in February.
AUD/USD is testing resistance at 0.6478. The next resistance line is 0.6514
0.6419 and 0.6383 and providing support

TBT- an ETF bearish on bondsTBT on the one hour chart demonstrates a clear round bottom reversal in late June
with a good trend up this past week. Price rose above the POC line of the volume profile
on July 3th showing bullish momentum dominating. Price has continued to ascend above
the Chris Moody sling shot indicator affirming that momentum. Given the current fed posture
hawkish for another rate increase fixed rate bonds will suffer yet again. Other indicators
show rising upward volatility and relative volume which further support the strength of the
trend. Time is ripe for a swing trade in TBT.

GBP/USD volatile after UK jobs, US inflation dataIt has been a hectic day for the British pound, after key releases on both sides of the pond. In Tuesday’s North American session, GBP/USD is trading at 1.2594, down 0.26%. The pound edged higher after the UK employment report but dropped sharply after US inflation was higher than expected.
The UK employment report indicated that the labour market is cooling but remains strong. Employment change rose 72,000 in the three months to December, down from a revised 108,000 a month earlier and just shy of the market estimate of 73,000. Average earnings including bonuses fell to 5.8%, down from a revised 6.7% but above the market consensus of 5.6%.
The Bank of England will be paying particular interest to the wage growth numbers. The decline in wages will be welcome, as it is a driver of inflation, but the current rate of wage growth is much too high as it is incompatible with a 2% inflation target.
The UK releases inflation data on Wednesday, with CPI expected to rise from 4% to 4.2% and core CPI projected to inch up to 5.2%, up from 5.1%. A rise in the inflation rate would be disappointing for the BoE and would likely lower market expectations for a rate cut.
The British pound climbed 0.25% after the UK employment report, but headed south after the US inflation report and declined by 0.65%. The US dollar posted strong gains against all the major currencies after January’s inflation report indicated that inflation was hotter than expected.
US CPI rose 3.1% y/y in January, down from 3.4% in December but higher than the market estimate of 2.9%. Core CPI remained unchanged at 3.9%, above the market estimate of 3.7%.
The Fed has been pushing back against market expectations for a rate cut in March, and the hotter-than-expected inflation release lowered the odds of a March cut to just 4%, compared to 16% prior to the release, according to the CME FedWatch tool. The markets have widely priced an initial rate cut for June but strong US data could mean a rate cut as early as May.
GBP/USD tested support at 1.2597 and this line remains under pressure. Below, there is support at 1.2550
There is resistance at 1.2676 and 1.2723

CPI Setup GOLD | Safe Zone CPI Setup GOLD | Safe Zone H1 Timeframe
Current point 2027.50
- This Setup is not based on Sell or buy
- According to last CPI Gold firstly moves 100+ pips in buy and then lay down
- After Structuring the data we expected 100 pips buy then gold will fall
- We set the safe zone if and if gold break the 2041 area then next move would be 2047
furthermore on the major support level if gold retest to break the 2012-2011-2010 next target
would be 2000.00
- At a same time CPI , CORE INFLATION RATE , YOY AND MOM all are highly impact news
- use proper lot size and risk management to secure profit because patience is a major key
This Analysis is uploaded at 13/02/2024
Cheers ..

US10Y: Key Moment for Stock MarketHi Trader!
U.S. Treasury yields climbed on Wednesday after an unexpected rise in UK inflation last month and stronger-than-expected U.S. December retail sales data strengthened the case that interest rate cuts will not be as imminent as the market expects. The UK inflation print, as well as more push-back from European Central Bank officials on Wednesday against interest rate cut bets, pushed European bond yields higher. Treasury yields, which move inversely to prices, followed suit, with the uptick gaining momentum after Commerce Department data showing retail sales in December grew by 0.6% month on month, above the 0.4% economists had expected in a poll. Weak demand for a 20-year bond auction also helped lift yields later on Wednesday.
💡 "December retail sales reflect an economy that, although slowing, continues to be underpinned by consumer spending," said Quincy Krosby, chief global strategist for LPL Financial. "For the Federal Reserve, slower consumer demand would help propel inflation to decelerate at a faster pace; however, with consumer confidence gaining momentum, the economic landscape remains on solid ground," she said in a note.
🔴 The short-end of the yield curve, more closely linked to monetary policy expectations, led the move higher. Two-year yields rose about 13 basis points to 4.354%, their biggest daily increase in over a month. Benchmark 10-year yields US10Y added about four basis points to 4.104%, their highest since Dec. 13.
🔴 From a technical perspective, chart shows a bearish impulse structure forming, and this technical bounce could form the second corrective leg (wave 4) before another bearish swing (wave 5). That said, the key resistance is around 4.23, and a rally above it could invalidate the technical structure.
We correctly predicted the surge in inflation last year, but now the geopolitical context has become more complex:
(Click on chart below)
In conclusion, if this analysis is correct, Stock Markets (SP500, Russell, DJ,...) should see another rally with potential new High Top...
Trade with care
Like | Share | Comment

If crude oil breaks down then USD can stop at resistanceHey guys,
Crude oil came down recently, which can help inflation to come down as well if energy market will continue to decline. In fact I see nice bearish pattern, so my assumption is that US yeilds and USD can be trading at resistance.
In this video I will also look at the chart of the 10 year US yeilds where I see greater chance for a drop to 3% rather than rally back to 5%.
Hope you will enjoy the content.
Grega

Update: Here is the fundamental and TA for Crude oil PricesWednesday we had inventory reports that showed an increase in US oil production combined with the feds hawkish interest rate sentiment which sent prices deep into discount. OPEC did announce they will be cutting oil production while US supply did increase apparently, US production has slowed down the last 18months. I believe next week this will start to reflect in the Crude oil inventory report, if economic data starts lessen it will give us a strong push to the upside amid the rising tension in the middle east (OPEC cuts and Nile attacks).
source:
www.nasdaq.com

EUR/USD Daily Chart Analysis For Week of Feb 2, 2024Technical Analysis and Outlook:
During this week's trading session, the Eurodollar exhibited a high degree of fluctuation and volatility, revolving around our Mean Support level of 1.084. Despite the fluctuations, the currency failed to rise above our Mean Resistance level of 1.090 to sustain a meaningful rebound. Currently, the Eurodollar is in a primary downward trend, which will continue until the support level marked at Mean Support 1.076 and the Inner Currency Dip level of 1.075 are breached. Once these levels are eliminated, the currency will continue to decline towards the next Inner Currency Dip of 1.065.
However, there is a possibility of an upward movement, in which case the currency might retest the Mean Support level of 1.090 once again before continuing its downward trend. It is important to note that breaching the Mean Resistance level of 1.090 is essential for a sustained dead-cat rebound. Therefore, traders should observe these levels closely and trade accordingly to make the most of the current market situation.

2024 Inflation Deceleration Projection - Long GoldMy views of Inflation:
In essence, the inverse correlation between gold and real rates persists, I anticipate a transition from QT to QE by the Fed come May, and subsequent rate adjustments in 2024, propelling Gold towards my $2300-$2400 target. My projection is underpinned by my forecast in the deceleration of inflation, evidenced by the significant retracement in Core CPI and Core PCE post hikes witnessed '21/'22. I anticipate a cessation QT activities by the Fed, given the satisfactory contraction in inflationary pressures, albeit with a cautious eye on the potential persistence or escalation of inflationary trends in the forthcoming periods. The question begs, will inflation be aligning with the Fed's 2% target? Yes, I believe it is, and this bolsters the thesis favoring Golds appreciation.
Currently, Core CPI and Core PCE trends underscore a significant retreat from the '21/'22 peaks, courtesy of the Fed's QT regimen. As I (and markets) anticipate May cuts, I infer the Fed's QT was adequate in curbing inflation. The latency in real rate adjustments post-Fed hikes may even suggest the Fed may have even overdone QT. The forthcoming period is critical for assessing persistent versus transitory inflation dynamics, again, with an overarching trajectory into inflation's trend towards Powell's 2% target. I believe this leans towards this alignment, underpinned by mostly structural inflation rather than cyclical, structurally; attributed to post-Covid supply chain recalibrations. Although I believe cyclical inflation occurred, I believe the Fed's QT was more than enough to put the foot down. This is because the structural inflation mitigation underscored the inefficacy of cyclical monetary policies in addressing non-cyclical inflation. Though I cannot stress this enough, I still believe cyclical inflation occurred and it is a problem to present itself come '24.
It seems Powell is quite tipsy, as he does not want to mess things up, after seeing headline CPI data in early January '24 on the 11th come out, Powell thinks he may have jumped the gun on his dovish FOMC meetings prior to the data.
We're observing an inflation slowdown, edging towards the Fed's 2% target, with a keen eye on inflation-growth dynamics and the Fed's uncertain stance influencing inflation's trajectory. The onset of a rate-cutting cycle sees downside-skewed inflation, with the main ambiguity revolving around the extent of cuts. Post headline January '24 CPI led Powell to believe he jumped the gun to his prior dovish FOMC meeting in December '23, amid core CPI and PCE indicating steady deceleration, validating Fed's inflation target alignment. Energy's influence on headline figures contrasts with core deceleration, hinting at possible hawkish Fed shifts if core inflation is affected. The divergence between rate cuts, growth, and energy prices underscores a sort of balance, with the consensus leaning away from further hikes, closely monitoring labor and inflation trends into '24. Despite recession forecasts, '22/'23's robust labor market debunked such predictions, underscoring overlooked nominal income growth's support.
Forecasting a recession in '22/'23 hinged on real income growth, bolstered by employment, easing structural inflation, and lower energy prices. Despite housing and consumer spending recovery, some argued ISM's YoY contraction, however the ISM is not meant to be seen as a YoY indicator. It's a diffusion index that reflects the breadth/growth of contraction compared to the previous month. The ISM is based on a survey on whether conditions for manufacturing business are improving or deteriorating compared to the previous month, clearly measuring that on a YoY basis makes no sense as this is a snapshot of the manufacturing sector’s current momentum, rather than a comparison to the same month in the previous year, which would be a YoY analysis. Thus, this didn't signal a recession. My early expectations of early Fed cuts are rooted in structural inflation resolution from supply chain improvements.
I believe to discern the Fed's rate cut strategy, we need to understand the spread between the Fed funds rate and core inflation metrics (CPI and PCE). The disparity will signify the Fed's probable target spread, with the Fed funds rate presently surpassing core inflation. A resilient economic growth, as indicated by the Bloomberg Economic Growth Surprise Index, might lead the Fed to maintain a wider spread, hinting at 3-4 rate cuts. Conversely, a growth deceleration could validate a more aggressive 5-6 cuts. The sentiment indices from the Fed's communications suggest a preference for a narrower spread. I think Powell doesn't want to jump the gun on cuts, as I believe it would be humiliating for him to cut in May and hike in March due to a reacceleration in core inflation figures.
With inflation trending towards the Fed's 2% goal, my analysis suggests potential rate cuts in 2024, alongside an Gold reaching my target $2300-$2400.
The content provided here is for informational purposes only and should not be construed as investment advice, a solicitation, or recommendation to buy or sell any securities. It is not intended for qualified investors only. Users should conduct their own research or consult with a financial advisor before making investment decisions. The author does not guarantee the accuracy or completeness of the information and will not be held liable for any errors, omissions, or inaccuracies. Use this information at your own risk.
Disclaimer: The content provided here is for informational purposes only and should not be construed as investment advice, a solicitation, or recommendation to buy or sell any securities. It is not intended for qualified investors only. Users should conduct their own research or consult with a financial advisor before making investment decisions. The author does not guarantee the accuracy or completeness of the information and will not be held liable for any errors, omissions, or inaccuracies. Use this information at your own risk.

This week’s two best trading opportunities? First opportunity AUD/USD
Australian inflation data released Tuesday evening, might make the AUD/USD the most interesting pair to watch this week. This is because inflation will likely come in higher than 4.0% still.
Less than 24 hours later, we then have the US Federal Reserve’s interest rate decision on Wednesday, which will be one of the most watched forex events of the month.
The AUD/USD has stayed within a narrow range recently, forming an ascending channel that looks like a bearish flag pattern. For stability, it might want to hold above 0.6600. If it fails, the pair could possibly retest the 2024 low at 0.6524, in line with the 100-day SMA.
Second opportunity: EUR/USD
Why is the EUR/USD a pair to watch this week? It all comes down to the disagreement circulating in the market about where EU inflation is going to fall this week on Thursday.
Some market participants forecast it is falling to 2.2% from the current 2.9%, while others are pegging it to actually increase to 3.1%.
These differing opinions open up a few different targets on the charts.
The near-term picture is possibly bearish with the EUR/USD developing below all its moving averages and posting a third consecutive lower low and lower high. Although the selling pressure momentum might be waning.

AUD/USD eyes retail salesThe Australian dollar is in positive territory on Monday after an uneventful week. In the European session, AUD/USD is trading at 0.6603, up o.41%.
The markets are braced for a soft retail sales report on Tuesday, with December's consensus estimate standing at -1.0%. The November report sparkled with a 2% gain, the strongest level since November 2021. The strong gain was driven by Black Friday sales and other discounts and likely came at the expense of the December reading with consumers doing their Christmas shopping early. There could be a surprise to the upside in the retail sales report if consumers took advantage of Boxing Day sales in late December.
The Reserve Bank of Australia meets next on February 6 and has repeatedly said that upcoming rate decisions will be data-dependent. This makes Wednesday's quarterly inflation report a critical release that will have a significant impact on the central bank's rate path.
In the US, inflation continues to ease while economic growth remains solid, which is the recipe that the Fed hopes will continue. The US economy expanded by 3.3% in the fourth quarter, blowing past the consensus estimate of 2.0%. On Friday, the Fed's preferred inflation gauge, the PCE Price Index, rose 0.2% m/m in December, compared to 0.1% in November. On an annual basis, the index remained steady at 2.6%. The Core PCE Index eased to 2.9%, down from 3.2% in November. The Fed is in no rush to raise rates, and market fever over a March cut have fallen dramatically. The markets have slashed the odds of a quarter-point cut in March to 48%, down sharply from 72% a month ago, according to CME's FedWatch tool.
AUD/USD is testing resistance at 0.6583. There is weak resistance at 0.6613
There is support at 0.6544 and 0.6514

U.S Core PCE Price Index (MoM)ECONOMICS:USCPCEPIMM
Core PCE prices in the US, which exclude food and energy,
rose by 0.2% from the previous month in December of 2023, aligned with market estimates, and picking up slightly from the 0.1% increase in November.
From the previous year,
Core PCE prices edged 2.9% higher,
undershooting market estimates of 3% to mark the lowest reading since February 2021.
The data extended the disinflation trend in prices measured by the Federal Reserve’s preferred gauge, consistent with previous signals of rate cuts to be delivered this year. Regarding the whole national PCE that includes energy and food, prices rose by 0.2% from the prior month and 2.6% from the prior year, consistent with expectations.
Prices for goods rose by less than 0.1% from 2022, while those for services remained elevated at 3.9%.
source: U.S. Bureau of Economic Analysis

Crude oil back about $96 a barrel With the slowing of oil production
and conflict at the Nile, I think that oil prices are
going to increase, if the fed decides to cut or leave interest rates unchanged
this may weaken the USD and strengthen other currencies creating more demand for oil
and if inventory continues to lessen you will see a further surge in oil prices.
otherwise, if the fed raises interest rates next week and productions issues come to resolve
oil prices will begin to drop and I will update this post with a bearish Analysis.

U.S. Core PCE Comes in Lower than Expected U.S Core PCE (FEDS FAVOURITE METRIC)
Rep: 2.9% ✅ Lower Than Expected ✅
Exp: 3.0%
Prev: 3.2%
U.S. Headline PCE
Rep: 2.6% ✅ In Line with Expectations ✅
Exp: 2.6%
Prev: 2.6%
Historical Core PCE Norms
On the chart you can see that since 1990 the typical Core PCE range is between 1 - 3% (red dotted lines on chart). We are slowly getting back down into this more historically moderate level. We have just fallen below the 3% level and down into the historically moderate zone for PCE levels.
The Federal Reserve have advised that Core PCE is expected to decline to 2.2% by 2025 & finally reach its 2% target in 2026. At this rate we might reach 2% a little sooner than that.
For the full breakdown of the Core and Headline PCE and to know the differences between PCE and CPI, please review the Macro Monday I previously released which explains it all (in the comments below).
PUKA

USD/JPY steady after Tokyo Core CPI falls below 2%The Japanese yen is drifting on Friday. In the European session, USD/JPY is trading at 147.80, up 0.10%.
Tokyo Core CPI reached a significant milestone today, falling to 1.6% y/y in January, after a December reading of 2.1%. This was the first time the indicator dropped below the Bank of Japan's 2% target since May 2022. The main driver of the decline was lower energy prices. Tokyo Core CPI excludes fresh food but includes fuel. The Tokyo core-core index, which excludes fresh food and fuel prices, rose 3.1% y/y in January, down from 3.5% in December.
The drop in inflation reinforces the BoJ's view that cost pressures are gradually being replaced by rising service prices as the main driver of inflation. This is hugely significant, as it points to inflation being more sustainable, which is a requirement for the BoJ before it tightens its ultra-loose policy. Japan also released corporate service inflation for December which held steady at 2.4%, a nine-year high. That reading underscores that service prices remain high a companies continue to pass on their costs.
BoJ Governor Ueda stated at this week's policy meeting that progress is being made towards the target of 2% sustainable inflation, and that has the markets speculating that the BoJ could make a major policy shift in April or June. The BoJ wants to see higher wages as evidence that inflation is sustainable and the national wage negotiations in March are expected to provide higher wages for workers.
In the US, the first-estimate GDP for the fourth quarter smashed above expectations, but the US dollar didn't show much interest. GDP growth rose 3.3% y/y, below the 4.9% gain in the third quarter but well above the consensus estimate of 2.0%. The US economy continues to produce stronger-than-expected data and that has the markets paring expectations for a rate cut in March. The probability of a March cut has fallen to 48%, down sharply from 70% one month ago, according to the CME's FedWatch tool.
USD/JPY tested support earlier at 147.54. Below, there is support at 146.63
There is resistance at 148.44 and 149.35

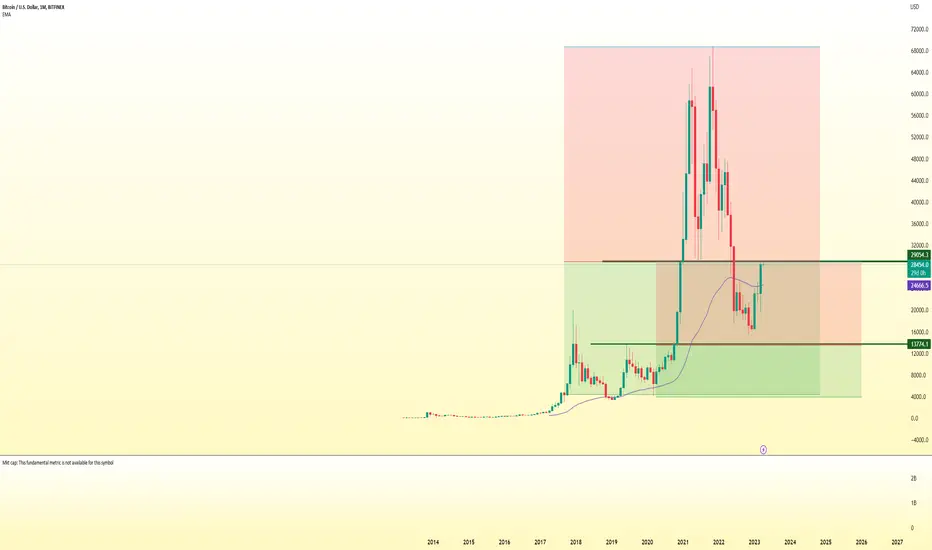
BTC facing resistanceFibonacci says BTC is going to struggle.
61% says.. time for a pullback
the only hope for BTC is more cheap
money from the central bankers.
Real interest rates are still negative while
profilgate government spending is increasing.
the private sector is maxed out on debt
so the government will take over as the debt slave
to fund worthless projectors in schools.
I dont mind paying $15 for a cheap sandwich.