Could a Surge in Mortgage Rates Imperil the Housing Market?Over the past 18 months, U.S. mortgage rates have soared from 2.9% to 7.6%, their highest since 2001. Will this tremendous increase in mortgage rates cause the U.S. housing market to crash like it did in 2008?
On one hand, higher mortgages have led to a steady decrease in the number of new mortgages being issued. In recent weeks, the number of new mortgages has fallen to its lowest level since 1995.
On the other hand, there is a major difference between today and the period leading up to the global financial crisis: vacancy rates.
Vacancy rates are extremely low. Before the 2008 financial crisis, 10% of rental properties and 3% of owner-occupied properties were vacant. Today, only 6.4% of rental properties are vacant, near their lowest since 1985, while owner-occupied properties have a record low vacancy of 0.7%.
Home prices have stopped rising, but so far, they aren’t collapsing. Over the past year, the price of buying a home in the U.S. has fallen by about 1%, while rental costs have risen by around 8% as higher rates force many would-be buyers into the rental market.
If you have futures in your trading portfolio, you can check out on CME Group data plans available that suit your trading needs www.tradingview.com
By Erik Norland, Executive Director and Senior Economist, CME Group
*Various CME Group affiliates are regulated entities with corresponding obligations and rights pursuant to financial services regulations in a number of jurisdictions. Further details of CME Group's regulatory status and full disclaimer of liability in accordance with applicable law are available below.
**All examples in this report are hypothetical interpretations of situations and are used for explanation purposes only. The views in this report reflect solely those of the author and not necessarily those of CME Group or its affiliated institutions. This report and the information herein should not be considered investment advice or the results of actual market experience.
Inflation

EURAUD, Gigantic ASCENDING-WEDGE, BEARISH Continuation SETUP!Hello There!
Welcome to my new analysis about EURAUD on several perspectives. The Eurozone inflationary pressures increased massively within the recent times determining a huge bearish edge against the AUD zone, especially as inflation in the Eurozone is not yet tackled by continued higher rate hikes with which the ECB, European Central Bank is trying to decrease inflation. Compared to the AUD zone this means that the EUR is much more bearishly inclined against the AUD and in this case it is also important on how the actual technical price action is confirming such a bearish inclination.
In my chart I am pointing out that the EURAUD is now setting up a gigantic ascending-wedge-formation with several resistances within the structures. The EURAUD is now approaching the major 50% Fibonacci-resistance within the 1.7 which is simultaneously determining the resistance by the upper boundary of the gigantic wedge formation and forming a coherent resistance-cluster within this level. Once EURAUD shows up with a major pullback off this zone this means that the possibility for an completion of the wedge-formation increases astronomically and a completion of it will point to the bearish target-zones to be reached.
Especially if the massive interest rate hikes within the Eurozone implemented by the ECB should not effectively decrease the inflation rate of the EUR this will put a lot of bearishness on the Euro and therefore also on EURAUD and with such a dynamic it is going to accelerate the bearish momentum. Once the whole ascending-wedge-formation has been finally completed the target-zones will be active and once the final target-zone has been reached the bearish momentum should be assessed again because with further developments to the downside this could actually lead to a major bearish wave-count extension for EURAUD and move to lower levels. In any case it will be a highly important development to consider here.
In this manner, thank you everybody for watching the analysis, support from your side is greatly appreciated.
VP

Oil - Almost time to short?Oil is running into some pretty pivotal resistance.
You have to imagine Powell and elected officials want to get the price per barrel lower heading into election campaign and this inflation regime.
A bearish daily divergence just started but does not mean its time to short. A quick scan at these levels may be attainable but I think if we get one more final move into the next Fib level it would be a better R&R setup .

EUR/USD extends losses, eyes German inflationThe euro has extended its losses on Wednesday and has declined close to 1% this week. In the European session, EUR/USD is trading at 1.0552, down 0.18%.
Germany has traditionally been the powerhouse of Europe but finds itself lagging in the rear, with a struggling economy and high inflation. The GfK Consumer Climate index fell to -26.5 for October, down from a revised -25.6 in September and shy of the market consensus of -26.0. This was the lowest reading since April and suggests that consumer sentiment will remain weak in the near future. The GfK report warned that private consumption will not contribute towards Germany's recovery, which is grim news for the eurozone.
One of most eagerly waited eurozone releases is the German inflation report, which will be released on Thursday. The consensus estimate for German CPI stands at 4.6% y/y, compared to 6.4% y/y in August. If the estimate is on track, it would mark a significant win for the ECB, which has been raising rates aggressively in order to curb high inflation.
The ECB raised rates last week, but the lead-up to the meeting was dramatic as it was a 50-50 call whether the ECB would hike or hold. A sharp drop in German inflation could send the euro lower as it would support the ECB taking a pause at the October meeting.
The week wraps up with German retail sales on Friday. After back-to-back declines, retail sales for August are expected to rebound to 0.5% m/m.
The US releases third-estimate GDP on Thursday, with a market consensus of 2.0%. This follows the second-estimate of 2.1% and the preliminary estimate of 2.4%. The US economy has recorded respectable growth figures despite the Federal Reserve's sharp tightening, as the labour market has remained strong and consumers continue to spend.
EUR/USD is testing resistance at 1.0594. Next, there is resistance at 1.0666
There is support at 1.0544 and 1.0472

Why we’re watching the Bond/Equity Volatility
With the action-packed week of global central bank meetings for September now behind us, we believe it's an appropriate time to review where we stand. The current phase, in our view, can be aptly summarized by the words of Huw Pill, the Bank of England’s Chief Economist: a ‘Table Mountain’ scenario rather than a ‘Matterhorn.’ Recent announcements have positioned the Swiss National Bank, the Bank of England, and the Federal Reserve as adopting a pause stance. Meanwhile, the ECB suggests that it is in the final stages of its hiking program, and Sweden’s Riksbank has just executed its final hike. While we remain slightly skeptical that these hikes may indeed be the final ones, let's entertain this thought and examine what transpires during periods of a defined pause.
Defined pause periods raise alerts for us, as highlighted in our previous piece on US Equities. In that article, we pointed out the impact of a Fed pause, as it has often preceded periods of equity drawdowns. This pattern becomes even more evident when we consider other variables like shifts in the dollar and interest rates.
Looking at the S&P 500 index —in 2000 and 2006—where a clear pause was observed, significant equity drawdowns followed thereafter.
Furthermore, the 10-Year, 2-Year, and 3-Month yields have just reached their highest levels since October 2007, June 2007, and January 2001, respectively. These yields mark the highest nominal interest rates seen in decades across the interest rate curve.
More significantly, this shift has brought real yields back to positive levels, something investors haven't seen for a while, all while the yield curve inverts to unprecedented levels. All of these factors have spill-over effects on investors accustomed to decades of low real interest rates.
Another observation worth noting is that the ratio of Bond to Equity volatility has proven to be a reliable indicator for predicting the next market regime. For instance, during the 2008 period, a break in this ratio was followed by significant moves lower in the market.
A similar phenomenon was observed in 2019, where a sharp break in the ratio of MOVE to VIX preceded the market's next downturn. What captures our interest now is a recent, significant break in this ratio, reinforcing our bearish outlook on equities.
In terms of daily charts, the recent gap down places the index at a precarious juncture as it grapples with both a sharp break of the 100-day moving average and trend support. Compared to the last two instances when the index broke lower, the current RSI stands at even lower levels. Adding to this, only 18% of S&P 500 stocks currently trade above their 50-day moving average.
Given the breakdown in the MOVE/VIX ratio, the global pause in interest rate policy, and supporting technical indicators, we are inclined to maintain a bearish stance on US equities. We can express this view via a short position on the CME E-mini S&P 500 Futures at the current level of 4347, with the take profit at 3800 and stop at 4500. Each 0.25 point move in the E-MINI S&P500 index Futures is equal to $12.5. We can also express this same view with the CME Micro E-mini S&P 500 Index. With each 0.25 point move equating to $1.25, its smaller tick size compared to the standard contract offers greater flexibility in position-building or averaging your entries.
The charts above were generated using CME’s Real-Time data available on TradingView. Inspirante Trading Solutions is subscribed to both TradingView Premium and CME Real-time Market Data which allows us to identify trading set-ups in real-time and express our market opinions. If you have futures in your trading portfolio, you can check out on CME Group data plans available that suit your trading needs www.tradingview.com
Disclaimer:
The contents in this Idea are intended for information purpose only and do not constitute investment recommendation or advice. Nor are they used to promote any specific products or services. They serve as an integral part of a case study to demonstrate fundamental concepts in risk management under given market scenarios. A full version of the disclaimer is available in our profile description.
Reference:
www.cmegroup.com
www.cmegroup.com

XLE - true breakout or fakeout?Oil has been ripping lately and trying to establish a new consolidation range. Keep in mind this rally in energy has occurred as the DXY has had 9 weeks of consecutive upside.
The energy sector has been a bullish piece of the market and is at a critical support level.
If this breakout in XLE is to hold we could see some significant upside.
A weekly & daily breakout has been confirmed but when you zoom out to the monthly chart this could be signalling a failed Double top reversal.
Seeing how XLE closes the monthly candle will be telling for the market as oil has been the main increase in the CPI and inflation expectations.

XLB - Monthly SupportInvestors waiting for a more probable long term support zone could wait until price action retraces to the top of the channel .
This channel has kept price action in check since the early 2000/s
We only broke out of the channel when we expanded the monetary supply and lower rates to zero.

XLB tagging Intermediate SupportMaterials Sector is getting oversold on the daily chart and tagging a key daily upsloping trend line.
A technical bounce is favoured at this level, however there is a weekly support level lower that is much stronger if this were to sell off more.
This bounce may only last a few days unless the indices firm up.

Month on Month US Inflation Harmonically Set to Rise to 1.94%This is a followup to this year-on-year inflation chart idea posted back in June 2022:
The YoY US Inflation rate has been on a trend of going down since it tested the 1.414 PCZ of the Bearish Butterfly above, but recently we have seen the MoM rate slow its descent and form a bottoming pattern with MACD Hidden Bullish Divergence at the 200-Month SMA and now we can see that the MACD has crossed positively as the inflation rate has broken out of its recent range. This harmonically puts it into position where we will likely see it at least hit the 0.886 retrace to complete a small bat pattern, but it could go out of control and go as high as the 1.618 Fibonacci Extension area all the way at about 1.94%.
One reason I suspect for the sudden stop of the inflationary decline is due to the Fed not raising rates high enough, fast enough, and then keeping them the same for the last few months. It would also seem that the year-on-year inflation rate is setting up for a similar rise, showing Hidden Bullish Divergence at the Moving Averages and likely one that will result in it going to test higher highs to around its 1.414-1.618 PCZ once area once more before ultimately crashing back down from these highs once the Fed starts to go heavy on rate hikes again. Though the timeframe may be shorter than how it is presented on the chart, I do still suspect we will have action resembling what is projected on the chart below until the Fed starts rising rates aggressively again:
This does not mean I think stocks will go up, that the dominance of the dollar will go down, or even that I think the consumer credit situation will improve. Instead, I think the rise in inflation will be fueled by energy, import, and export costs, and that this will be very bad for: Stocks, Consumers, REITs, and Banks overall, and that the Bond Yields will continue to rise at an accelerated rate.

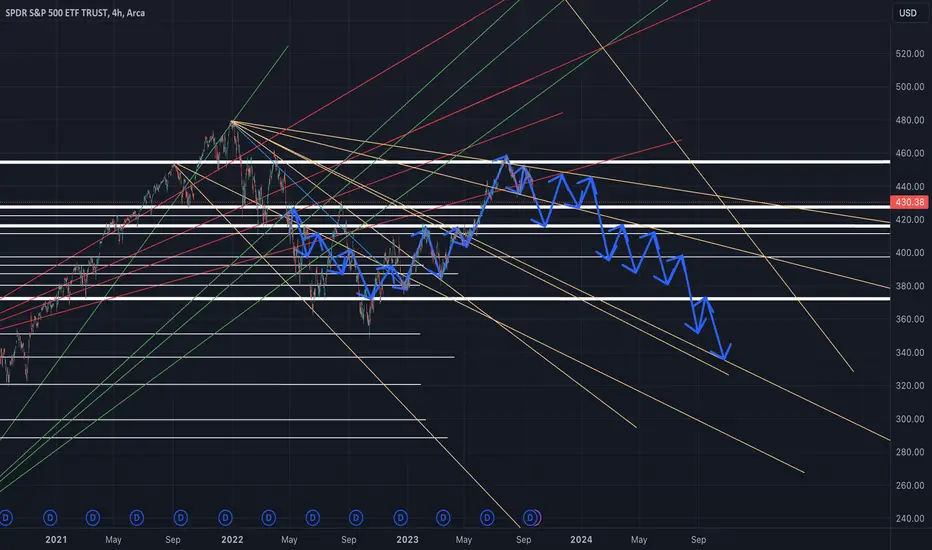
EOY SPY Movement Until September 2024Here is how I expect the market to move until the end of the year into September of 2024. I want to post this so I have a playback of how it actually happens as a recession is looming on the horizon.
[UPDATE BTC] Will you survive the worst case?Been talking since last year about the worst case (red): 8 years away from next ATH
The most bullish case would be the black scenario.
Honestly, I cannot be bullish if I see the monthly chart.

📊🔥 Inflation Unleashed: Oil and Potential Bitcoin Bull Run💰🚀In this video, I discuss the latest inflation reports 📊 and analyze their impact on the global economy 🌍.
I highlight the factors affecting inflation, starting with the rising price of oil ⛽ and its pressure on inflation 📈. Additionally, I provide insights into the price of Bitcoin 💰 and its bullish outlook 🚀 in light of rising inflation.
I also touch upon the performance of stock indices 📊 and the importance of focusing on Bitcoin 💎 in the current market.
Overall, this video aims to provide valuable analysis and predictions 🤔 regarding today's CPI report 📑 and Bitcoin.
Professor is LONG! 📈
One Love ❤️
Oil: Long since $71 🛢️: Oil Long - In the Blinken of an eye, Let's not BRICS it!
Bitcoin: Stay awake, this September could be a different one 🗓️: Can BTC wake up before September ends?

USD/JPY drifting as Fed decision loomsThe Japanese yen continues to have a quiet week. In Wednesday's North American session, USD/JPY is trading at 147.66, down 0.15%.
If the Federal Reserve does not pause rate hikes at today's meeting, it would be a massive surprise. Still, that doesn't mean that investors aren't paying close attention. There is particular interest as to whether the dot plot projections in June will remain the same. Those projections indicated one more hike before the end of the year and a cut in rates in 2024 to the tune of 100 basis points. Any change in the dot plot could trigger volatility from the US dollar.
It has been a light week for Japanese releases, which helps explain why the Japanese yen has shown very little volatility. That could change with the Federal Reserve rate decision later today. The yen could show some stronger movement on Friday, with the release of Japan's core CPI and the Bank of Japan policy meeting.
The Bank of Japan has insisted that inflation is transient, yet core inflation has hovered above the BoJ's 2% target for seventeen consecutive months. That streak is likely to continue on Friday, with core CPI expected at 3.0% y/y for August, compared to 3.1% in July. The core-core CPI, which excludes fresh food and energy, is expected to accelerate to 4.4% y/y in August, up from 4.3% in July.
High inflation has put pressure on the BoJ to consider a shift from its ultra-loose policy, and there have been a few signals from BoJ members that the central bank is examining a possible exit. This has raised speculation about interest rate hikes in early 2o24, although that could be wishful thinking on the part of some market participants, as a rate hike would be nothing short of a sea-change in BoJ monetary policy.
The Bank of Japan meets on Friday and no shift in policy is expected. Still, BoJ meetings have gone from dull affairs to potential huge market movers and investors will be listening closely to Governor Ueda's follow-up press conference, especially on inflation. Will Ueda stick to the narrative that inflation is transient or will he acknowledge that inflation is showing signs of being substantive?
There is support at 147.24, and 146.52
148.56 and 149.28 are the next resistance lines

CPI 13/09/23 CORE CPI (YoY):
PREVIOUS: 4.7%
FORECAST: 4.3%
In the last 5 months of core cpi results, 3/5 actuals have equalled forecasts, with the last 2 months both coming in below forecast. This month is predicted to have the biggest percentage drop out of those previous months.
CPI (YoY):
PREVIOUS: 3.2%
FORECAST:3.6%
When looking at the CPI numbers in the same previous 5 months, 5/5 results have come in lower than forecast, could this be 6 in a row?
This month we have conflicting forecasts with core CPI going up, but CPI dropping at the same time.
With price hovering around the previous Higher Low, I'm interested to see if any event news volatility could cause a print of a lower low on the 1D timeline for the first time this year. Even if it's just a wick and not a full close on the daily, this could confirm a new HTF bearish bias. Added confluence for this would be the loss of the bullish trendline in red. Weeks of consolidation under that area after a bearish retest plus all 3 EMA's suggesting downtrend, Bitcoin has a lot of work to do. The large FVG needs filling at some point, and it looks to be on its way there currently.
I'm always cautious going into these big news events, the first move is usually wrong so remember that.

Understanding Interest-rates & InflationHey Traders
So, I have been asked by many of my clients to explain the relationship between interest-rates and inflation and how to translate that information into their analysis.
For this reason I put this little mini lesson together to explain:
- The core role of the central bank
- Reason and objectives for interest-rates and inflation
- How you can use this information to enhance your analysis
- How to take advantage of this info when taking, managing or closing your trades.
PS. if you would like me to do more of these types of videos be sure to leave a comment in the comment section.

USD/CAD falls to one-month lowThe Canadian dollar has extended its gains on Tuesday. In the European session, USD/CAD is trading at 1.3441, down 0.33%. Earlier in the day, the Canadian dollar strengthened and touched a low of 1.3436, its best showing since September 15th.
The Bank of Canada will be keeping close tabs on today's inflation report. CPI for August is expected to fall to 0.3% m/m, compared to 0.6% m/m in July. The core rate is also expected to ease to 0.3%, down from 0.5%. If the inflation readings decline as expected, it will provide support for the BoC to pause for a second straight time at the October meeting.
The BoC will release the minutes (Summary of Deliberations) of the September meeting on Wednesday. At the meeting, the BoC held the benchmark cash rate at 5.0%. Policy makers reiterated that they stood ready to continue to hike in order to bring inflation back down to the 2% target, saying they “remained concerned about the persistence” of underlying price pressures. I expect that the minutes will make further references to Canada's inflation rate.
The BoC's rate statement at the meeting noted that weaker demand and a concern about the lagging effect of previous hikes led to a decision to keep rates unchanged. Policy makers reiterated that would "continue to assess the dynamics of core inflation and the outlook for CPI”, which makes today's inflation release an important factor in the October rate decision.
USD/CAD is putting pressure on support at 1.3408. The next support line is 1.3323
1.3468 and 1.3553 are the next resistance lines

2 year yield - breakoutThe yield market is going absolutely bonkers tonight in the futures.
What is the bond market telling us?
likely inflation is entrenched. If the 2 year yield closes at or above the Fed Fund Rate before we hear from Powell expect the fed to do a surprise rate hike or remain extremely hawkish.
This will no be good for stocks if this is the case.

Oil, S&P, FED Funds & CPIPurple droplets indicate where CPI peaks (pink line) and green arrows point to the corresponding oil peak.
Blue dotted lines measure where oil peaks to allow a reference point to S&P chart. Light blue is FED Funds rate.

Excess Savings: Indication For Exceptional Inflation Expansion!Hi,
Welcome to this analysis about the current and upcoming economical situation regarding the excess savings amassed in the corona crisis and the potential inflationary developments these can cause. There are also other factors that can accelerate inflation in the upcoming times especially with the ongoing central bank money press that shoot to astronomically high levels during the corona pandemic and the months after, still ongoing there is not an end in sight. Since the corona breakdown lows established the money stock increased more and more and caused an asset-price inflation in stocks, bonds and real estate as well. Taking the following factors into consideration the inflation can also increase seriously in consumer goods and real economy such as already seen in individual sectors such as the craft sector.
Accumulated Excess Savings During The Corona Pandemic Crisis:
As seen in the graphic the Excess Savings, the savings that households hold and do not spend immediately increased drastically during the corona pandemic as businesses shut down people hoarded the excess savings. According to Moody's Analytics, the Excess Savings in America grew to almost 2.6 Trillion US-Dollar, and around the world, people build up Excess Savings of 5.4 Trillion US-Dollar. These savings are waiting to be spent when the real economy shut-down-businesses widely open again. It is necessary to assume that these are historical high values never seen before which can cause similar inflation like in the 1940s or 1970s. Besides the high Excess Savings, the federal depth increased also substantially to similar levels like in the 1940s which served as one factor for the high inflation.
High Demand And Low Supply As Production Decreased:
As production during the corona pandemic crisis decreased and a vast majority of countries moved on to shut down businesses this caused a decrease in production and therefore in supply. On the other side the Excess Savings, as well as the printed central bank money, increased steeply. These developed conditions have a high tendency to lead to increased inflation as high demand meets the low supply moving the prices to the upside also shown through the output gap which experts expect to rose above the 2% level increasing the high-demand-to-low-supply dynamic. It is highly necessary to do not underestimate these dynamics and be prepared for such potential scenarios to do not get overwhelmed by circumstances when they happen.
In this manner thank you, everybody, for watching the analysis, will be great when you support it, and all the best!
Information provided is only educational and should not be used to take action in the market.

AUD/USD eyes US inflation, Aussie jobs reportThe Australian dollar is lower on Wednesday. In the European session, AUD/USD is trading at 0.6408, down 0.28%.
The US releases the August inflation report later today. CPI is projected to increase in August to 3.6% y/y, following a 3.2% gain in July. On a monthly basis, the consensus estimate stands at 0.6%, higher than the 0.2% gain in July. Core CPI is expected to fall from 4.7% to 4.3% and remain unchanged at 0.2% m/m. The Federal Reserve puts more emphasis on core inflation readings which are considered more reliable indicators of underlying inflation.
A drop in the core rate would be welcomed by the Fed and would cement expectations for a pause at next week's rate meeting. If however, inflation is stronger than expected, the Fed could respond with additional rate hikes in the coming months and that could mean stronger volatility for the US dollar.
The markets have widely priced in a rate pause, with a probability of 93% according to the FedWatch tool. After that, the Fed's rate path is unclear, with the odds of a pause standing at 59%. The US labour market remains resilient, despite some cracks, and economic growth for the fourth quarter is expected to be strong. That could mean higher inflation for longer, which could complicate the Fed's efforts to finish the battle against inflation and bring it back to the 2% target.
Thursday should be a busy day for the Aussie, with Australia releasing employment data and the US publishing retail sales numbers. Australia's job growth is expected to rebound with a gain of 23,000 in August, after a decline of 14,600 in July. US retail sales are expected to fall in August by 0.2% m/m, down sharply from 0.7% a month earlier.
AUD/USD is testing support at 0.6405. Below, there is support at 0.6330
There is resistance at 0.6453 and 0.6528

USD Ready To Complete a "Bullish Puzzle" After US CPI ReportToday holds significant importance as we await the release of US inflation data. Projections indicate a rate of 3.6%, surpassing the previous reading of 3.2%. This surge in expectations has propelled the US dollar's recent strength, driven by speculations that the Federal Reserve (FED) may consider implementing further interest rate hikes in the upcoming meetings. Additionally, escalating energy prices underscore the challenge of swiftly returning inflation to the 2% target. Consequently, the USD remains in an upward trajectory for the time being. Nevertheless, even if the inflation data hovers around or slightly exceeds the 3.6% mark, there's the possibility of a "buy the rumor, sell the news" effect. It's worth noting that the DXY has already seen a 6% rise from its summer lows, suggesting that a robust inflation report might already be factored into current prices.
Taking an Elliott wave perspective into account, the recent price action appears corrective, with wave four unfolding within the broader uptrend. This implies that the market might be gearing up for one final upward surge in the coming days, potentially reaching resistance levels around 105.50-106. This zone could serve as the culmination point for higher-degree patterns. Therefore, I'll be on the lookout for signs of a reversal after this anticipated new high.

The Cash BubbleHistory repeats itself, and we should learn from it, however sometimes history is so far away that it spans generations before we're able to grasp the experience first hand.
We hear about 1929, but we can't imagine what it was to survive the struggle, we hear about the pandemics during the 20's, same deal, we have heard about recessions, and those who went through the big recession of 2008 triggered by the immobiliary crisis know better, some veterans from the dot com bubble, others from the Black monday in 87, and probably very few from earlier crisis. But I don't think anybody has gone through a halt in the economy due to a pandemic at the level we witnessed in 2020.
Let's put it in context, 2020 was an election year, the incumbent government was losing the battle against the pandemic and the halt in the economy. He had the support of the congress and the wallet at his will, the former President Trump flooded the market with freshly printed dollars in an attempt to reignite the economy as soon as possible, and let's say, it worked for the purpose of reactivating the economy and not having to wait for a painful period of a lengthy recovery, however this created an unprecedented scenario, a huge flood of dollars to the market. The biggest cash inflow ever in the history of the world. The M1 metric went to $7.2T, to put it in perspective, since the 60's this has been oscillating in the $480B to $580B in the 70's when Nixon cancelled the convertibility of the Gold and Paul Volcker had to apply unprecedented meassures to fight the stagflation that followed after the dollar became fiat currency. The M1 increased 120% from its 60's level, the increase after the housing bubble burst went from $668B to $1.5T, approximately 225%. After the COVID halt it went from $1.5T to $7.25 T, an increase of 485%, inedit scenario in the history of the United States.
The crisis sent the price of oil in the market of futures to a negative value, something that has never been seen, the unemployment reached record levels, the SP500 index fell to a range close to that when Trump became president, wiping off the rally that started shortly after that event, the inflation didn't react immediately, since this is a lagging indicator that reacts to the economy growth, and the access to currency.
The amount of printed fiat currency flooding the market created the immediate wanted effect, the economy jumpstart that put everybody to work and reignited the economic machinery, the unemployment started to go down, the inflation ticked up, still within range, the price of gold ticked up, the price of oil started to recover, also within range. However we witnessed shortly after that the inflation was not stabilizing, we witnessed the traffic jam at the ports of entry to the United States, lines and lines of cargo ships waiting to unload at the ports of entry, stuck there just idling. The news blamed the Evergreen ship that blocked the Suez Canal, and affected the distribution lines, but the truth was an excessive demand of products from the Pacific producers that overwhelmed the existing port infrastructure. This was the root reason that affected the production lines in the US and contributed to a galloping inflation. Also, during the recovery cycle, let's remember that one commodity in high demand is oil, since the world moves on it. We saw unprecedented gas prices at the pump. Presidents don't have the power to increase or decrease the prices of gas, that is pure supply/demand, but they can be blamed for increases or take the credit for decreases. In a high demand environment, oil goes along the demand cycle, that is why in a recovery environment the oil prices go higher. Let's remember in the 70's during the stagflation period oil was a highly valued commodity and people were making large lines to load gas. The prices were upticking fast and the media blamed the arab world for it, but it was mere propaganda, what really happened it was just an economy running freely on cash and jacking up the prices.
The Trump administration was at the peak of the economic cycle that started in 2009, with low inflation, full employment, low gas prices. After the pandemic the variables changed, the economy went to a sudden halt world wide, and in a desperate attempt to keep the presidency the administration authorized the humongous cash flow in an attempt to prevent the negative effects of the economy to affect the election. At the end Trump lost the election. The economy continued its extremely fast paced recovery path and it overshoot. The Fed chairman was purposely in "Denial" regarding inflation, neglecting it and calling it "transitory", which was more of a Greenspan "laissez faire" economic policy, let the wild animals in their "irrational exuberance" take over and later on we'll pick up the pieces and start the recovery process. This is how we got here now.
Where do we go from here?, that is an interesting question, the flood of cash should have been made in a way that there was a recovery but not a rampant inflation, however this would have taken longer and the previous administration was not willing to wait. We have an amount of cash that the economy hasn't been able to absorb. Money is supported basically by the productivity, the working force, the commercial transactions, but there must be a correspondence so the economic variables are kept in check. The GDP vs the M1 is still at an outstanding level. The inflation is heading to the 2-2.5% goal, we're still at full employment, which basically puts us in what the fed have been calling a "soft landing". Will it be?? I suppose initially it will, but we risk facing the same scenario that happened during the stagflation in the 70's, Paul Volcker had a big dilemma, he increased the interest rates, but the inflation was completely out of control, people noticed they could buy an asset and basically turn around and sell it at a higher price, and they still found a buyer. Houses were on the rise, the agriculture also participated of the inflation benefits, farmers could buy a tractor, use it and resell it at a higher price. People in New York City were waiting in line before the jewelries opened so they could buy gold, and sell it later at a higher price. When Volcker decreased the interest rates after the message he sent was of stability and it backfired and inflation was reignited.
Taking a look at the CBOE:SPX in the long run, we see there is a negative momentum divergence forming after it reached the All Time High (ATH). The indicators signal a downturn, that could possibly happen after the interest rates reach its pivot, the inflation is at the Fed Goals, unemployment goes beyond the full employment level and the economy shows signs of stalling.
Bubbles happen all the time, we enjoy the ride until they burst. We're in a new bubble, the Cash Bubble. The cash should be enough to allow the economy to support it having a healthy inflation level of 2%, as defined by the Fed targets. If there is too much cash and the economy is not able to support it, it will dilute automatically until the economy growth catches up. For decades the ratio of M1 to GDP has been between 9% and 18% as we can see in the chart. After the cash flood it peaked to 85% and currently it is at 68%. I don't think the problem is far from over, even if we reach the 2% inflation target. The challenge for the Fed now is to keep the interest rates low for longer without stalling the economy. It is rumored that the Fed will pause the interest rate hike for their September FOMC meeting. It is expected considering the recent increases have been in the 1/4 of a point followed by a pause. If the pause is prolonged, the inflation reaches its 2-2.5% target and the unemployment is kept within the 4-5% range then the fed can call it a "Soft Landing" up to this point which could be a telegraphed signal to start reducing the interest rates, and the financial market may anticipate this pivot to create a bear market and shake the tree to dislocate and reallocate assets at a discount using all the big cash flood out there. Next year is a presidential election year, and not making it a priority has happened before. During the Volcker's period, he didn't mind pulling the rug on Carter. The Fed does what it has to do.
"What has happened before will happen again. What has been done before will be done again. There is nothing new in the whole world."
~ Ecclesiastes 1:9
Patterns repeat because human nature hasn't changed for thousands of years.
~ Jesse Livermore.
References
Secrets of the Temple: How the Federal Reserve Runs the Country.
William Greider. January, 1989
How the economic machinery works. by Ray Dalio. youtu.be
Principles for Dealing with the Changing World Order by Ray Dalio. youtu.be

EURUSD awaiting the newsYesterday, EURUSD continued its correction and headed towards the resistance zone.
By the end of the week, data on US inflation and interest rates from the ECB are due.
Before the important news, it is not advisable to take a high risk and it is better to wait.
We have determined zones on all major assets and are monitoring development!
