Oil, S&P, FED Funds & CPIPurple droplets indicate where CPI peaks (pink line) and green arrows point to the corresponding oil peak.
Blue dotted lines measure where oil peaks to allow a reference point to S&P chart. Light blue is FED Funds rate.
Inflation

Excess Savings: Indication For Exceptional Inflation Expansion!Hi,
Welcome to this analysis about the current and upcoming economical situation regarding the excess savings amassed in the corona crisis and the potential inflationary developments these can cause. There are also other factors that can accelerate inflation in the upcoming times especially with the ongoing central bank money press that shoot to astronomically high levels during the corona pandemic and the months after, still ongoing there is not an end in sight. Since the corona breakdown lows established the money stock increased more and more and caused an asset-price inflation in stocks, bonds and real estate as well. Taking the following factors into consideration the inflation can also increase seriously in consumer goods and real economy such as already seen in individual sectors such as the craft sector.
Accumulated Excess Savings During The Corona Pandemic Crisis:
As seen in the graphic the Excess Savings, the savings that households hold and do not spend immediately increased drastically during the corona pandemic as businesses shut down people hoarded the excess savings. According to Moody's Analytics, the Excess Savings in America grew to almost 2.6 Trillion US-Dollar, and around the world, people build up Excess Savings of 5.4 Trillion US-Dollar. These savings are waiting to be spent when the real economy shut-down-businesses widely open again. It is necessary to assume that these are historical high values never seen before which can cause similar inflation like in the 1940s or 1970s. Besides the high Excess Savings, the federal depth increased also substantially to similar levels like in the 1940s which served as one factor for the high inflation.
High Demand And Low Supply As Production Decreased:
As production during the corona pandemic crisis decreased and a vast majority of countries moved on to shut down businesses this caused a decrease in production and therefore in supply. On the other side the Excess Savings, as well as the printed central bank money, increased steeply. These developed conditions have a high tendency to lead to increased inflation as high demand meets the low supply moving the prices to the upside also shown through the output gap which experts expect to rose above the 2% level increasing the high-demand-to-low-supply dynamic. It is highly necessary to do not underestimate these dynamics and be prepared for such potential scenarios to do not get overwhelmed by circumstances when they happen.
In this manner thank you, everybody, for watching the analysis, will be great when you support it, and all the best!
Information provided is only educational and should not be used to take action in the market.

AUD/USD eyes US inflation, Aussie jobs reportThe Australian dollar is lower on Wednesday. In the European session, AUD/USD is trading at 0.6408, down 0.28%.
The US releases the August inflation report later today. CPI is projected to increase in August to 3.6% y/y, following a 3.2% gain in July. On a monthly basis, the consensus estimate stands at 0.6%, higher than the 0.2% gain in July. Core CPI is expected to fall from 4.7% to 4.3% and remain unchanged at 0.2% m/m. The Federal Reserve puts more emphasis on core inflation readings which are considered more reliable indicators of underlying inflation.
A drop in the core rate would be welcomed by the Fed and would cement expectations for a pause at next week's rate meeting. If however, inflation is stronger than expected, the Fed could respond with additional rate hikes in the coming months and that could mean stronger volatility for the US dollar.
The markets have widely priced in a rate pause, with a probability of 93% according to the FedWatch tool. After that, the Fed's rate path is unclear, with the odds of a pause standing at 59%. The US labour market remains resilient, despite some cracks, and economic growth for the fourth quarter is expected to be strong. That could mean higher inflation for longer, which could complicate the Fed's efforts to finish the battle against inflation and bring it back to the 2% target.
Thursday should be a busy day for the Aussie, with Australia releasing employment data and the US publishing retail sales numbers. Australia's job growth is expected to rebound with a gain of 23,000 in August, after a decline of 14,600 in July. US retail sales are expected to fall in August by 0.2% m/m, down sharply from 0.7% a month earlier.
AUD/USD is testing support at 0.6405. Below, there is support at 0.6330
There is resistance at 0.6453 and 0.6528

USD Ready To Complete a "Bullish Puzzle" After US CPI ReportToday holds significant importance as we await the release of US inflation data. Projections indicate a rate of 3.6%, surpassing the previous reading of 3.2%. This surge in expectations has propelled the US dollar's recent strength, driven by speculations that the Federal Reserve (FED) may consider implementing further interest rate hikes in the upcoming meetings. Additionally, escalating energy prices underscore the challenge of swiftly returning inflation to the 2% target. Consequently, the USD remains in an upward trajectory for the time being. Nevertheless, even if the inflation data hovers around or slightly exceeds the 3.6% mark, there's the possibility of a "buy the rumor, sell the news" effect. It's worth noting that the DXY has already seen a 6% rise from its summer lows, suggesting that a robust inflation report might already be factored into current prices.
Taking an Elliott wave perspective into account, the recent price action appears corrective, with wave four unfolding within the broader uptrend. This implies that the market might be gearing up for one final upward surge in the coming days, potentially reaching resistance levels around 105.50-106. This zone could serve as the culmination point for higher-degree patterns. Therefore, I'll be on the lookout for signs of a reversal after this anticipated new high.

The Cash BubbleHistory repeats itself, and we should learn from it, however sometimes history is so far away that it spans generations before we're able to grasp the experience first hand.
We hear about 1929, but we can't imagine what it was to survive the struggle, we hear about the pandemics during the 20's, same deal, we have heard about recessions, and those who went through the big recession of 2008 triggered by the immobiliary crisis know better, some veterans from the dot com bubble, others from the Black monday in 87, and probably very few from earlier crisis. But I don't think anybody has gone through a halt in the economy due to a pandemic at the level we witnessed in 2020.
Let's put it in context, 2020 was an election year, the incumbent government was losing the battle against the pandemic and the halt in the economy. He had the support of the congress and the wallet at his will, the former President Trump flooded the market with freshly printed dollars in an attempt to reignite the economy as soon as possible, and let's say, it worked for the purpose of reactivating the economy and not having to wait for a painful period of a lengthy recovery, however this created an unprecedented scenario, a huge flood of dollars to the market. The biggest cash inflow ever in the history of the world. The M1 metric went to $7.2T, to put it in perspective, since the 60's this has been oscillating in the $480B to $580B in the 70's when Nixon cancelled the convertibility of the Gold and Paul Volcker had to apply unprecedented meassures to fight the stagflation that followed after the dollar became fiat currency. The M1 increased 120% from its 60's level, the increase after the housing bubble burst went from $668B to $1.5T, approximately 225%. After the COVID halt it went from $1.5T to $7.25 T, an increase of 485%, inedit scenario in the history of the United States.
The crisis sent the price of oil in the market of futures to a negative value, something that has never been seen, the unemployment reached record levels, the SP500 index fell to a range close to that when Trump became president, wiping off the rally that started shortly after that event, the inflation didn't react immediately, since this is a lagging indicator that reacts to the economy growth, and the access to currency.
The amount of printed fiat currency flooding the market created the immediate wanted effect, the economy jumpstart that put everybody to work and reignited the economic machinery, the unemployment started to go down, the inflation ticked up, still within range, the price of gold ticked up, the price of oil started to recover, also within range. However we witnessed shortly after that the inflation was not stabilizing, we witnessed the traffic jam at the ports of entry to the United States, lines and lines of cargo ships waiting to unload at the ports of entry, stuck there just idling. The news blamed the Evergreen ship that blocked the Suez Canal, and affected the distribution lines, but the truth was an excessive demand of products from the Pacific producers that overwhelmed the existing port infrastructure. This was the root reason that affected the production lines in the US and contributed to a galloping inflation. Also, during the recovery cycle, let's remember that one commodity in high demand is oil, since the world moves on it. We saw unprecedented gas prices at the pump. Presidents don't have the power to increase or decrease the prices of gas, that is pure supply/demand, but they can be blamed for increases or take the credit for decreases. In a high demand environment, oil goes along the demand cycle, that is why in a recovery environment the oil prices go higher. Let's remember in the 70's during the stagflation period oil was a highly valued commodity and people were making large lines to load gas. The prices were upticking fast and the media blamed the arab world for it, but it was mere propaganda, what really happened it was just an economy running freely on cash and jacking up the prices.
The Trump administration was at the peak of the economic cycle that started in 2009, with low inflation, full employment, low gas prices. After the pandemic the variables changed, the economy went to a sudden halt world wide, and in a desperate attempt to keep the presidency the administration authorized the humongous cash flow in an attempt to prevent the negative effects of the economy to affect the election. At the end Trump lost the election. The economy continued its extremely fast paced recovery path and it overshoot. The Fed chairman was purposely in "Denial" regarding inflation, neglecting it and calling it "transitory", which was more of a Greenspan "laissez faire" economic policy, let the wild animals in their "irrational exuberance" take over and later on we'll pick up the pieces and start the recovery process. This is how we got here now.
Where do we go from here?, that is an interesting question, the flood of cash should have been made in a way that there was a recovery but not a rampant inflation, however this would have taken longer and the previous administration was not willing to wait. We have an amount of cash that the economy hasn't been able to absorb. Money is supported basically by the productivity, the working force, the commercial transactions, but there must be a correspondence so the economic variables are kept in check. The GDP vs the M1 is still at an outstanding level. The inflation is heading to the 2-2.5% goal, we're still at full employment, which basically puts us in what the fed have been calling a "soft landing". Will it be?? I suppose initially it will, but we risk facing the same scenario that happened during the stagflation in the 70's, Paul Volcker had a big dilemma, he increased the interest rates, but the inflation was completely out of control, people noticed they could buy an asset and basically turn around and sell it at a higher price, and they still found a buyer. Houses were on the rise, the agriculture also participated of the inflation benefits, farmers could buy a tractor, use it and resell it at a higher price. People in New York City were waiting in line before the jewelries opened so they could buy gold, and sell it later at a higher price. When Volcker decreased the interest rates after the message he sent was of stability and it backfired and inflation was reignited.
Taking a look at the CBOE:SPX in the long run, we see there is a negative momentum divergence forming after it reached the All Time High (ATH). The indicators signal a downturn, that could possibly happen after the interest rates reach its pivot, the inflation is at the Fed Goals, unemployment goes beyond the full employment level and the economy shows signs of stalling.
Bubbles happen all the time, we enjoy the ride until they burst. We're in a new bubble, the Cash Bubble. The cash should be enough to allow the economy to support it having a healthy inflation level of 2%, as defined by the Fed targets. If there is too much cash and the economy is not able to support it, it will dilute automatically until the economy growth catches up. For decades the ratio of M1 to GDP has been between 9% and 18% as we can see in the chart. After the cash flood it peaked to 85% and currently it is at 68%. I don't think the problem is far from over, even if we reach the 2% inflation target. The challenge for the Fed now is to keep the interest rates low for longer without stalling the economy. It is rumored that the Fed will pause the interest rate hike for their September FOMC meeting. It is expected considering the recent increases have been in the 1/4 of a point followed by a pause. If the pause is prolonged, the inflation reaches its 2-2.5% target and the unemployment is kept within the 4-5% range then the fed can call it a "Soft Landing" up to this point which could be a telegraphed signal to start reducing the interest rates, and the financial market may anticipate this pivot to create a bear market and shake the tree to dislocate and reallocate assets at a discount using all the big cash flood out there. Next year is a presidential election year, and not making it a priority has happened before. During the Volcker's period, he didn't mind pulling the rug on Carter. The Fed does what it has to do.
"What has happened before will happen again. What has been done before will be done again. There is nothing new in the whole world."
~ Ecclesiastes 1:9
Patterns repeat because human nature hasn't changed for thousands of years.
~ Jesse Livermore.
References
Secrets of the Temple: How the Federal Reserve Runs the Country.
William Greider. January, 1989
How the economic machinery works. by Ray Dalio. youtu.be
Principles for Dealing with the Changing World Order by Ray Dalio. youtu.be

EURUSD awaiting the newsYesterday, EURUSD continued its correction and headed towards the resistance zone.
By the end of the week, data on US inflation and interest rates from the ECB are due.
Before the important news, it is not advisable to take a high risk and it is better to wait.
We have determined zones on all major assets and are monitoring development!

DXY (USD) [Monthly] - is inflation coming back?Monthly chart showing clearly that old resistance is becoming new support level, is it that simple?
i've seen people comparing DXY current price action to the late 1970s when inflation had 3 waves, implying we could begin the 2nd wave soon. i think the fundamentals are different, inflation reduction act etc etc.
what do we think, is it this simple?

No trades on EURUSDEURUSD continues holding around 1,0700 and no still no entry grounds.
US inflation data is coming on Wednesday and ECB interest rate on Thursday.
Upon continuation of the correction resistance levels will be 1,0780 and 1,0846.
We will be looking for new trades after the news upon good ratio.

Lower High, and probably a Lower Low.The market is showing signs of weakening. After the previous high didn't take out the highest high it made on January 22, the momentum started to weaken. The volume is going through a bearish cycle and the VIX is starting to show signs of waking up. The interest rates haven't receded and there are signs of an economy slowdown with upticks in the unemployment and the reduction of the inflation.
The oil market went high, but along with oil production cuts, which means the oil cartels are trying to keep the prices high not by increasing demand, but by reducing supply. This means the economy is reaching the point where more oil is not needed, it's peaking its recovery cycle.
All these ingredients signal we're reaching a level where the overall economy has peaked. It must slow down to allow the inflation to go down, and the so called soft landing would mean the unemployment would not be harsh while the Fed reaches its economic goals. However that is not a guarantee, let's remember we went through a flood of cash after the pandemic, which was what triggered the worst inflation in decades.
Previous bubbles have been because of different reasons, too much debt to enter the raising market, too much interest in tulips, too much promissory e-commerce, the real estate bubble, ... and the story repeats itself, just with different actors. I would call this one the cash bubble, and it is far from over.
Let's remember the printed bills are endorsed by faith, by the believe that they are worth something and the fact that the only one who can legally print them is the government. But they're worthless by themselves. They are not Money, they are tokens that represent money, the money is produced after the productivity of the economy, how many people are in the workforce, how productive the companies are, how efficient the distribution networks are, and the fact that there are transactions going on in the economy, but if there are more tokens (printed bills) than economic activity their value is reduced, and prices are higher (inflation), until the economy catches up with the amount of currency in the market.
My forecast here is that if the Federal Reserve senses a slowdown in inflation, then they will start pivoting the interest rates, at which point they will keep them like that for a while to see how the overall economy reacts, trying to curve the inflation, while keeping the economy moving, until it reaches levels that show signs of stalling, like higher unemployment and reduction of GDP. A reduction of interest rates will start to make the institutional capitals to exit the market to bet on a big bearish market, and while the media will be ignoring these signs, the institutions will be dumping assets until it's so evident that the market panics.
Once the market has been slaughtered, while a lot of chickens run headless on the street, and there are signs of capitulation, it'll be when the big institution will start accumulating assets at a discount and with a lower interest rate, just like it has always happened before, and the cycle will repeat. This time, pretty much like the way it happened on 2009 and 2020, with a large amount of cash to be allocated in financial assets.
"Patterns repeat because human nature hasn't changed for thousands of years."
~ Jesse Livermore.
“The investor who says, 'This time is different,' when in fact it's virtually a repeat of an earlier situation, has uttered among the four most costly words in the annals of investing.”
~ John Templeton.
"Buy when there's blood in the streets, even if the blood is your own."
~Baron Rothschild.

Inflation to accelerate again or not?Today, we want to draw attention to the price differences now versus a year ago for multiple assets. While some commodities make a case for the reacceleration of inflation (presuming they continue higher), others do not. We would like to hear your opinion on the subject. Also, feel free to share any other assets we omitted.
Illustration 1.01
Illustration 1.01 shows the daily chart of USOIL (WTI oil), down approximately 2.7% compared to the price 365 days ago.
Illustration 1.02
Illustration 1.02 displays the daily chart of Copper CFD. Its price is up about 11% versus a year ago.
Illustration 1.03
The picture above portrays the daily chart of Aluminium futures, which are nearly flat compared to the price 365 days ago.
Illustration 1.04
Illustration 1.04 shows the daily chart of Platinum CFD. This commodity is up slightly more than 15% versus a year ago.
Illustration 1.05
Illustration 1.05 displays the daily chart of Corn. In the last 365 days, corn lost about 27% of its value.
Illustration 1.06
The illustration above shows the daily chart of Rice futures down approximately 5% versus a year ago.
Illustration 1.07
Illustration 1.07 exhibits the daily chart of Pork cutout futures. The price of this commodity is down more than 6% versus a year ago.
Illustration 1.08
Illustration 1.08 presents a daily chart of Soybean futures. Within the past 365, Soybean futures lost about 3% of their value.
Please feel free to express your ideas and thoughts in the comment section.
DISCLAIMER: This analysis is not intended to encourage any buying or selling of any particular securities. Furthermore, it should not be a basis for taking any trade action by an individual investor. Therefore, your own due diligence is highly advised before entering a trade.

$DXY plows higherTVC:DXY still going strong!
It's highly likely that the retests the recent highs.
We history in the making!
This is the 1st time the US #DOLLAR didn't break down @ major support! It has not withstood a monthly close after peaking.
Does it have enough steam to retest the 2022 highs?
#interestrates #GOLD #SILVER #BTC

EUR/USD falls to 2-month low on soft Services PMIsThe euro is back to its losing ways on Tuesday, after holding steady a day earlier. In the North American session, EUR/USD is trading at 1.0745, down 0.48%. The euro has faltered badly, losing about 2% since Wednesday and trading at its lowest level since July.
ECB Christine Lagarde has been talking about the importance of beating inflation but has shrugged when asked about interest rate policy. Lagarde spoke in Jackson Hole in late August and again on Monday in London, hammering home the messsage that inflation remains too high and the ECB will maintain high rates for as long as necessary in order to bring inflation back to the 2% target.
Lagarde's hawkish message in these speeches gave no hints as to whether the ECB would raise rates at its meeting on September 14th. Perhaps she is keeping the markets guessing, but another reason could be that the ECB hasn't yet decided whether to hike or hold, with doves and hawks at the ECB strongly divided on the next move. Inflation remains high at 5.3% but another hike increases the risk of tipping the weak eurozone economy into a recession.
Lagarde stressed on Monday that it was critical for the ECB to keep inflation expectations firmly anchored. I can only imagine her frustration today on reading the ECB monthly survey which indicated that inflation expectations for the next 12 months remained at 3.4% in July, and rose from 2.3% to 2.4% for three years ahead. Eurozone inflation has been moving in the right direction, but it appears that bringing it back down to target could take years.
Eurozone, German services PMI indicate contraction
The services sector has helped carry the eurozone economy at a time when manufacturing continues to decline. However, the expansion in services came to a crashing halt in August as indicated in today's PMIs for the eurozone and Germany. The 50.0 line separates contraction from expansion.
The eurozone Services PMI for August was revised to 47.9 from a preliminary 48.3 points. This marked the first contraction in services activity this year and was the weakest reading since February 2021. The news wasn't much better from Germany, the bloc's largest economy. The Services PMI was confirmed at 47.3, the first contraction in eight months and the lowest level since November 2022. The euro has fallen about 0.50% in response to the weak services data, another painful reminder of the fragility of the eurozone economy.
EUR/USD is testing support at 1.0716. Below, there is support at 1.0658
There is resistance at 1.0831 and 1.0889

USD/CHF rises as Swiss retail sales fall, Swiss CPI nextThe Swiss franc has lost ground on Thursday. In the North American session, USD/CHF is trading at 0.8835, up 0.59%.
Thursday's Swiss retail sales for July looked awful, falling 2.3% m/m. This follows a revised gain of 1.5% in June. Market attention has now shifted to Swiss inflation, which will be released on Friday. Swiss inflation dropped to 1.6% in July, the lowest level since July 2022. The downtrend is expected to continue in August with a consensus estimate of 1.5%.
Policy makers at the Swiss National Bank have to be pleased with the inflation rate. Switzerland boasts the lowest inflation rate in the developed world and both headline and core inflation are comfortably nestled in the central bank's inflation target range of 0%-2%. Still, the SNB remains wary about inflation, with concerns that increases in rents and electricity prices could push inflation back up to 2%. Food inflation remains high and rose from 5.1% to 5.3% in July.
Unlike other major central banks, the SNB meets quarterly, which magnifies the significance of each rate decision. At the June meeting, the central bank raised rates to 1.75% from 1.50% and hinted that further hikes were coming. The SNB has projected inflation will hit 2.2% in 2023 and 2024, above its target. That means the SNB expects to have to continue raising rates, although, as is the case with many other central banks, the peak rate appears to be close at hand.
In the US, unemployment claims dropped to 228,000 last week, down from a revised 232,000 and below the estimate of 236,000. All eyes will be on Friday's job report, with nonfarm payrolls expected to dip to 170,000, down from 187,000.
The Fed's favourite inflation gauge, the PCE Price Index, increased in July by 0.2% for a second straight month, lower than the estimate of 0.3%. On an annualized basis, the PCE Price Index climbed 3.3% in July, up from 3.0% in June. Service prices rose by 0.4% in July, up from 0.3% from the previous month. The numbers indicate that the Fed's battle with inflation is far from over, and the final phase of pushing inflation down to 2% may prove the most difficult.
USD/CHF is testing resistance at 0.8827. Above, there is resistance at 0.8895
0.8779 and 0.8711 are providing support

Higher for LongerUS inflation data in July 2023 provided mixed signals. While Consumer Price Index (CPI) is moving in the right direction, producer price inflation suggest pipeline pressures are picking up. Core CPI, which excludes often-volatile food and energy costs, rose only 0.2% for a second month in a row . However, US producer prices picked up in July, owing to increases in certain service categories. This likely buys more time for the Federal Reserve (Fed) to deliberate on the future path of monetary policy.
The flows into bond exchange traded funds (ETFs) have been volatile. Over the past year, investors were starting to embrace duration. Investors were positioned for recession, inflation crash, and Fed cuts - evident from $31.7bn inflows to Treasury bond ETFs on pace for a record year2. However, investors are starting to pull out of the biggest bond ETFs devoted to Treasuries. More than $1.8 billion came out of the $39 billion iShares 20+ Year Treasury Bond ETF last week, the most since March 20203. Sentiment toward long-dated Treasuries has soured over the past month amid growing conviction that the Fed will keep interest rates at elevated levels for an extended period. We expect rates to remain higher for longer and are unlikely to see the Fed cut rates until the Q1 of next year amidst a stronger US economy.
Don’t celebrate on disinflation just yet
Overall, the US economy continues to show extraordinary resilience despite monetary constraints and credit tightening. While inflation has shown encouraging signs of decline, we caution that the level remains high. Strong July retail sales raise the risk of a re-acceleration in inflation. The four biggest categories of the ex-auto’s component saw outsized gains: non-store retailers, restaurants & bars, groceries, and general merchandise. Amidst a tight US labour market, with unemployment at historic lows and wages continuing to rise, the downward pricing momentum in the service sector is likely to be at a slower rate. Commodity prices are also beginning to rebound from the weakness seen in Q2 2023. Energy prices have been rising on the back of Organisation of Petroleum Exporting Countries and its allies (OPEC+) production cuts. If commodity prices extend their recent momentum, it could pose upside risks to inflation.
Fed Officials remain divided
Messaging on a somewhat mixed inflation outlook from the Fed Officials remains a mixed bag. One faction remains of the view that rates hikes over the past year and a half has done its job while another group contends that pausing too soon could risk inflation re-accelerating. Fed governor’s Michelle Bowman and Christopher Waller remain in the hawkish camp, hinting at more rate increases being needed to get inflation on a path down to the 2% target.
Futures markets are assigning about a 11% chance of a 25-basis-point rate hike when the Fed next meets on 19 and 20 September4. Additionally, rate cuts have now been completely taken off the table until perhaps later in the Q1 2024. The latest Fed minutes reveal commentary from officials, including the hawks, such as Neel Kashkari, suggest a willingness to pause again in September, but to leave the door open for further hikes at the upcoming meetings5.
Opportunity for a yield seeking investor
It’s been an impressive turnaround since the pandemic when negative real yields became the norm. TINA- ‘There Is No Alternative’ to equities, is over now that evidence of the shift to a 5% world appears stronger than ever. Today investors have the opportunity to lock in one of the highest yields in decades, with US two-year yields paying close to 5% exceeding the yields at longer maturities without the volatility witnessed in the 10-year sector. A resilient US economy is likely to keep interest rates and bond yields higher for longer.
Sources
1 Bureau of Labour Statistics as of 10 July 2023
2 BofA ETF Research, Bloomberg as of 9 August 2022 - 9 August 2023
3 Bloomberg as of 14 August 2023
4 Bloomberg as of 17 August 2023
5 federalreserve.gov as of 16 August 2023
This material is prepared by WisdomTree and its affiliates and is not intended to be relied upon as a forecast, research or investment advice, and is not a recommendation, offer or solicitation to buy or sell any securities or to adopt any investment strategy. The opinions expressed are as of the date of production and may change as subsequent conditions vary. The information and opinions contained in this material are derived from proprietary and non-proprietary sources. As such, no warranty of accuracy or reliability is given and no responsibility arising in any other way for errors and omissions (including responsibility to any person by reason of negligence) is accepted by WisdomTree, nor any affiliate, nor any of their officers, employees or agents. Reliance upon information in this material is at the sole discretion of the reader. Past performance is not a reliable indicator of future performance.

The downfall of Sunrun : What next !
Ladies and gentlemen, in today's financial analysis, we focus on Sunrun, examining recent price movements and conducting a comprhensive outlook.
First, we notice something significant: the stock has dropped by 16% from its previous trading zone. This is noteworthy, especially if the stock shows signs of going up again.
Now, let's discuss what happened at the Jackson Hole Symposium. The Federal Reserve Chair, Jerome Powell, talked about raising interest rates, which is different from what other officials said. For example, Patrick Harker from the Philadelphia Fed thought we should keep interest rates as they are. Austan Goolsbee, the Chicago Fed President, was also cautious. He mentioned challenges like high inflation, problems in the supply chain, and the possibility of a big strike in the auto industry. Despite these challenges, he remained hopeful that we can control inflation without causing a recession. He also stressed the importance of using data to make decisions, especially the real interest rate. The stock market liked what he said, and the SPDR S&P 500 ETF Trust went up by 0.8%.
Now, let's look ahead. I believe things might change for $NASDAQ:RUN. This belief comes from seeing other companies in the alternative power generation sector, like NYSE:NEP , NYSE:NOVA , and NASDAQ:RNW , starting to do better based on their recent performance. We've also heard that inflation might not keep going up, which is good news for RUN. In this situation, my plan is to keep a close eye on the market and stay updated on the latest news. I'll make sure to update this report with any new information.

Australian dollar edges up ahead of inflation reportThe Australian dollar is in positive territory on Tuesday. In the European session, AUD/USD is trading at 0.6437, up 0.12% on the day.
China's economic slowdown is bad news for the Australian economy, which counts China as its biggest export market. China's imports have been falling and as a result, commodity prices have dropped, hurting Australia's exports of iron ore and gold to China.
China continues to record weak economic numbers and this will likely be reflected in lower GDP releases, although economic growth is above 5%. The Australian dollar is sensitive to China's economic strength and has declined by around 3% in the third quarter.
The Reserve Bank of Australia meets on September 5th and is widely expected to hold rates at 4.10% for a second straight month. There are clear signs of the economy cooling, including inflation and wage growth easing and a slight rise in unemployment. The RBA would like to extend the pause in rate hikes, with an eye on lowering rates sometime in 2024.
All eyes will be on Australia's July inflation report which will be released on Wednesday. Inflation has been falling, albeit slowly. In June, inflation fell from 5.5% to 5.4% and the consensus estimate for July is 5.2%. If inflation drops to 5.2% or lower, it should cement a RBA pause in September. A higher rate than 5.2% won't necessarily mean a rate hike, but it would likely lower the odds of a pause, which are currently around 90%.
In the US, it is a busy Tuesday with consumer confidence and employment releases. The Conference Board Consumer Confidence index has been on the rise and soared to 117.0 in July, up from 110.1 in June. The estimate for August is 116.0 points. JOLTS Job Openings is projected to decelerate for a second straight month in July, from 9.58 million to 9.46 million.
AUD/USD tested support at 0.6424 earlier. Below, there is support at 0.6360
There is resistance at 0.6470 and 0.6531

Shanghai Stock Market (SSE Composite Index): A Closer LookThe Shanghai Stock Market is like a financial puzzle, and right now, it's showing us some interesting moves.
First, the rise in the 10-year yield from 3-year lows suggests that there might be changing expectations about economic growth, inflation, or monetary policy. This could be due to a variety of factors such as improved economic prospects, inflation concerns, or changes in the global interest rate environment. The central bank also did something important by closing a 5-billion yuan money deal. It's like they're keeping a watchful eye on how money is moving around. On top of that, they pumped a massive 385 billion yuan into the system, which can make things more exciting.
Now, let's talk about Ichimoku Cloud analysis. It's like a weather forecast for the stock market. Right now, it's showing that the market might be heading up, which is a positive sign. However, the cloud isn't very thick. This means we should be a bit cautious.
There's another important sign on this chart. Tenkan points up, suggesting the market might go up soon, even though it's under Kijun resistance line. It's a bit like seeing a green light at an intersection, even if the other light is still red.
So, as we decode these numbers and signals, it's clear that the Shanghai Stock Market is in a state of flux, with various factors at play. Investors will need to stay vigilant, considering both the data and the bigger economic picture to make informed decisions in the coming year.

Why the EURUSD might trade higherFollowing Powell's statement at the annual Jackson Hole symposium – “We are prepared to raise rates further if appropriate and intend to hold policy at a restrictive level until we are confident that inflation is moving sustainably down toward our objective.” – markets seem more inclined towards expecting another rate hike in the US. This move, in our analysis, provides the Federal Reserve (the Fed) with added flexibility for future decisions. Meanwhile, the European Central Bank (ECB) echoes a similar sentiment, insisting on remaining stringent as the battle against inflation is ongoing.
A dive into headline & core inflation shows a decline in the former for both the EU and US. However, Europe's core inflation remains stubbornly high, without evident signs of decreasing. Further, Europe's robust PMI, in contrast to the sub-50 US print, paired with this sticky core inflation, indicates that the ECB might maintain its tight monetary stance to combat inflation.
The Futures and OIS market can give us some insights on market participants’ expectation of the forward rate path. Here we see similar expectations of an increase in rates before cuts are priced in.
Generally speaking, interest rate differential is inversely related to the EURUSD, hence in the chart above we see this relationship in play with the US-EU Interest Rate, roughly marking out the inverted EURUSD path. From 2019 to 2022, where we saw the rate differential held constant after a period of decrease, the EURUSD traded higher during that period. Hence whether the ECB tightens further or keep in line with market expectations, we see potential for the EURUSD to trade higher given historical precedence.
The US dollar is currently hovering near the upper threshold of a descending channel. The previous 3-times when RSI reached such levels marked the turnaround point for the dollar.
On a longer-term chart, we see the EURUSD trading right above the 1.08 level which has been a key support & resistance level going back to 1970s.
Zooming in, the EURUSD pair now trades on the lower band of an ascending channel with RSI pointing oversold. Again, the past 3 times when RSI were at this level marked the reversal point for the EURUSD.
Hence, whether the ECB reacts with more hikes as expected by market participants, or it stays the expected course, the EURUSD is likely to trade higher as we look back in history. Supported by technical, and the potential for a weaker dollar as it trades near resistance, we favour a long position in the EURUSD Futures at the current levels of 1.0827 with a stop loss at 1.05 and take profit at 1.130. Each 0.00005 increment per EUR in the EURUSD futures contract equals to 6.25$.
The charts above were generated using CME’s Real-Time data available on TradingView. Inspirante Trading Solutions is subscribed to both TradingView Premium and CME Real-time Market Data which allows us to identify trading set-ups in real-time and express our market opinions. If you have futures in your trading portfolio, you can check out on CME Group data plans available that suit your trading needs www.tradingview.com
Disclaimer:
The contents in this Idea are intended for information purpose only and do not constitute investment recommendation or advice. Nor are they used to promote any specific products or services. They serve as an integral part of a case study to demonstrate fundamental concepts in risk management under given market scenarios. A full version of the disclaimer is available in our profile description.
Reference:
www.cmegroup.com
www.cmegroup.com

USD/TRY is to jump in 2023?For the last months, the Turkish lira has been traded near the all-time lows against USD. I think that demand for the lira would shift soon, and it would trigger a breakout of resistance of 18.7 with the first psychological price target of TRY 20 for 1 USD with consolidation near 25 in the second half of the year.
In terms of technical analysis, I do not see any compelling things on the USD/TRY chart.
Therefore, I decided to look at an exotic currency pair with TRY on one side. I have taken Hungarian forint or HUF. Comparing HUF with USD or EUR , we can say, it is a weak currency that has constantly lost its value for the last 20 years. However, against the weakest TRY, HUF is a king. On the TRY/HUF chart, I see an opportunity to breakout of support of HUF 18.4 for TRY until the end of the year. The first target could be 14 with the chance to drop to 10. Keeping in mind that HUF is a weak currency that is now in a temporary good shape against the world currencies, such a possible forint strengthening against the lira could happen only if the latter drop to the majors.
If TRY/HUF is to be 14, and USDHUF is near its essential middle-term resistance of 380. It means USDTRY would be around 27,14. If TRY/HUF reaches 10, USDTRY would be 38. With a magical macroeconomic policy in Turkey, including jumping inflation , artificially low-interest rates in Turkey , and raising interest rates in USD, EUR, and Erdogan's elections in June (and budget spending increase), it doesn't seem impossible to me.

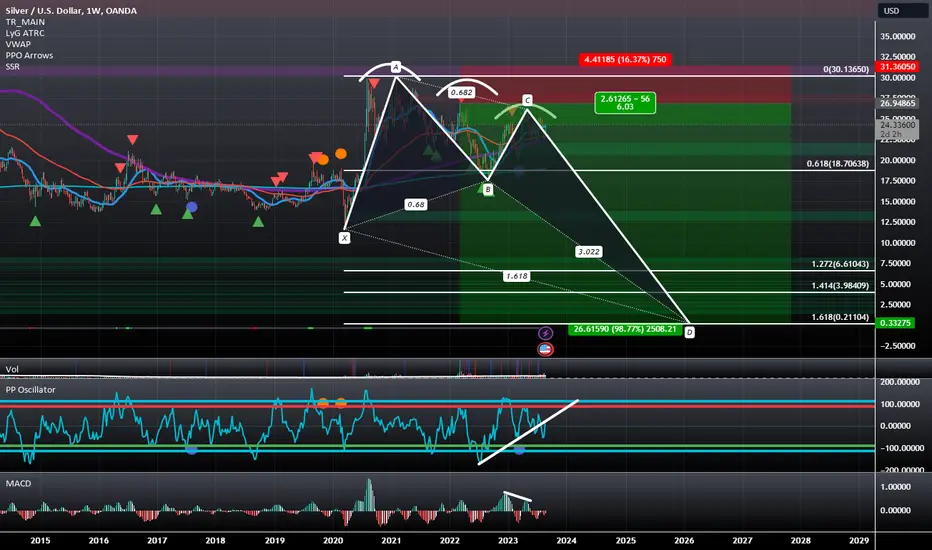
Silver is Setting Up to Drop Down to as Low as 21 Cents.Silver, after confirming Partial-Rise, has also formed 3 Falling Peaks and looks to be preparing to drop back below the bottom end of the range at 18 dollars. When it does this, it will enter a Butterfly BAMM Wave Structure that ends at the 1.272-1.618 Fibonacci Extensions. As a result of this new price action, I am lowering my price target to $6.61-$0.21 from my original $13 target.
Inflation Wears Out Its Welcome in JapanHas anybody ever told you to be careful what you wish for because you might get it? Well, the Bank of Japan appears to be in one of those situations today.
Japan spent three decades oscillating into and out of deflation. As such, when inflation started to rise in 2022, the BOJ was initially thrilled. Finally deflation was coming to an end, and inflation was heading up to a target of 2.5%. The problem is that inflation didn’t stop heading higher at 2.5%. It’s now up to 4.2% excluding fresh food and energy. In a nation with a large elderly population where many people are on fixed incomes, having inflation too high is just as bad has having it too low.
But why should the rest of the world care what happens to Japan’s inflation rate? For starters, Japan has the world’s fourth largest economy, and what happens to the yen and to Japanese bond yields is of worldwide consequence.
Beginning in 2012, the BoJ launched a mega quantitative easing program – four times bigger than what the Federal Reserve did relative to the respective size of their economy. This QE program sent the yen plunging as the BoJ also capped 10-year Japanese government bond yields. But recently, they have softened the cap, sending not only Japanese bond yields higher but raising the cost of long-term borrowings all around the world, including in the United States and Europe.
If you have futures in your trading portfolio, you can check out on CME Group data plans available that suit your trading needs www.tradingview.com
By Erik Norland, Executive Director and Senior Economist, CME Group
*Various CME Group affiliates are regulated entities with corresponding obligations and rights pursuant to financial services regulations in a number of jurisdictions. Further details of CME Group's regulatory status and full disclaimer of liability in accordance with applicable law are available below.
**All examples in this report are hypothetical interpretations of situations and are used for explanation purposes only. The views in this report reflect solely those of the author and not necessarily those of CME Group or its affiliated institutions. This report and the information herein should not be considered investment advice or the results of actual market experience.

USD/JPY punches above 146, BoJ inflation nextThe Japanese yen has posted significant losses on Monday. USD/JPY is trading at 146.23 in the North American session, up 0.57% on the day. The US dollar has looked sharp and is within a whisker of pushing the yen below the 146 line, as was the case last week when the strong US dollar pushed the ailing yen to a nine-month low.
The Japanese economy was once synonymous with deflation, but that has changed in the era of high global inflation. Japan's inflation is slightly above 3%, a level that other major central banks would take in a heartbeat. Still, inflation is relatively high by Japanese standards and both headline and core inflation have persistently been above the Bank of Japan's 2% target.
Japan's inflation reports are carefully monitored as higher inflation has raised speculation that the BoJ will have to tighten its loose policy. The central bank has insisted that high inflation is transient, but the BoJ wouldn't be the first bank to make that claim and then backtrack with its tail between its legs. Remember the Fed and the ECB?
Last week, July's CPI remained unchanged at 3.3% y/y. Core CPI dropped to 3.1% y/y, down from 3.3%. On Tuesday, Japan releases BoJ Core CPI, the central bank's preferred inflation gauge, which is expected to dip to 2.7% in July, down from 3.0% in June.
China's economic troubles have sent the Chinese yuan sharply lower, with the Chinese currency falling about 5% this year against the US dollar. A weak yuan makes Chinese exports more attractive, but this is at the expense of other exporters including Japan. As a result, there is pressure in Japan to lower the value of the yen in order to compete with Chinese exports.
USD/JPY pushed above resistance at 145.54 earlier today. The next resistance line is 146.41
There is support at 144.51 and 143.64

XAUUSD TRADE RUNNING 260 PIPSDear Ziilllaatraders,
It is with a sense of urgency that we address the current state of the gold market, signaling a marked shift into a bearish territory. The convergence of inflation concerns and impending rate hikes has cast a shadow over the once-gleaming prospects of gold, prompting us to discern this transformation.
Inflation Fears' Impact on Gold:
The recent surge in inflation apprehensions has proven to be a formidable adversary for gold's traditional safe-haven appeal. Historically, gold has served as a hedge against eroding purchasing power caused by inflation. However, the current scenario has witnessed a departure from this historical norm. As inflationary pressures intensify, investors are presented with a broader array of options to preserve and grow their wealth. This has diminished gold's allure, leading to a tangible decline in demand and subsequently exerting downward pressure on prices.
Rate Hike Anticipation and its Ramifications:
Adding to the complexity, the anticipation of central banks implementing rate hikes further compounds gold's plight. Rate hikes are a manifestation of efforts to rein in inflation and tighten monetary policy. In this environment, interest-bearing assets gain attractiveness due to their potential for yielding returns, diverting capital flows away from non-interest-bearing assets like gold. The prospect of higher yields in alternative investments acts as a gravitational force, drawing investors away from gold and contributing to the market's bearish undertones.
Collective Impact on Gold's Bear Market:
When examined together, the dual influences of mounting inflation concerns and the impending rate hikes converge to sculpt a bearish narrative for the gold market. The allure of gold as a store of value and wealth preservation tool has waned amidst the burgeoning options available to investors in the face of inflation. The prospect of higher yields from alternative investments, driven by impending rate hikes, exacerbates gold's descent into the bearish realm.
It is incumbent upon us to acknowledge this transformative juncture with clarity. The prevailing market dynamics underscore the need for a reassessment of gold's role within portfolios and investment strategies. As inflation and interest rate landscapes continue to evolve, our decisions should be informed by a comprehensive understanding of the prevailing economic forces at play.
In conclusion, the confluence of inflation fears and rate hike expectations has orchestrated an unmistakable shift in the gold market's trajectory. The bear market that has emerged serves as an imperative reminder that the interplay between economic factors and market sentiment is pivotal in shaping investment landscapes.
Greetings,
Ziilllaatrades
