USD/CAD pares gains, Canadian inflation easesThe Canadian dollar is flat on Friday, trading at 1.3258 in the European session.
Canada releases GDP for May later on Friday. The consensus stands at 0.2% m/m, which translates into 2.4% annualized, a respectable gain. If the GDP report beats the consensus, the Canadian dollar could post gains.
Canada's economy showed strength in the first quarter, with a gain of 3.1%. This was higher than expected and was one reason cited by the Bank of Canada in its surprise decision to raise rates earlier this month. I would expect that GDP growth will again be a key factor when the BoC makes its rate decision at the July 12th meeting.
The BoC, like most other major central banks, has aggressively tackled high inflation by raising interest rates. The policy appears to be working, as headline inflation eased to 3.4% in May, down sharply from 4.4% in April. The core rate, which is comprised of three indicators, fell to an average of 3.8% in May, down from 4.2% a month earlier. The drop in inflation is certainly welcome news for the central bank, but the key question is whether inflation is falling fast enough for BoC policy makers.
A third factor in the BoC's decision-making process will be employment. Canada's labour market has shown strong resilience in the face of rising interest rates, although the economy shed jobs in May, after eight straight months of gains. Another decline in new jobs could dampen the Bank's appetite for a rate hike in July.
The US is coming off solid GDP and jobless claims data on Thursday and all eyes are on the Core PCE Price Index, the Fed's favourite inflation gauge. The index is expected to remain at 4.7% y/y, which would mean that inflation remains uncomfortably high compared to the target of 2%. We'll also get a look at UoM Consumer Sentiment, which is expected to rise to 63.9 in June, up from 59.2 in May.
USD/CAD is putting pressure on resistance at 1.3254. Next, there is resistance at 1.3328
1.3175 and 1.3066 are providing support
Inflation

Markets Awaiting the PCE and FOMC – Day 3S&P 500 INDEX MODEL TRADING PLANS for WED. 06/28
Our models indicate choppy trading with no directional momentum until PCE release later this week. Depending on the number, it may bring inflation and interest rates back onto the market radar, with downside pressure added on the markets, which could crescendo into the FOMC meeting next week.
In our trading plans for Fri. 06/16, we wrote: "The spectacular bull run of the last few weeks fueled by speculation around the Fed policies and, possibly, an epic short squeeze, could be consolidating in the week ahead". It appears gaining traction with Powell's comments about inflation and interest rates since then.
The index slightly consolidated downwards from 4409.59 from the close on Thursday, 06/15 to the close of 4381.89 Thursday, 06/22. Our models indicated 4315-4325 as the next support level, which was tested within next few days and the market rebounded from there. 4400-4410 is the resistance level, below which the bias is choppy at best.
Positional Trading Models: Our positional models went short on the break below 4350 on Friday, with a hard stop at 4406. For today, models indicate carrying the short, with the hard stop updated to 4416 and a take-profit instituted at 4325. If the short is closed out through one of these exits, models indicate staying flat until indicated otherwise.
By definition, positional trading models may carry the positions overnight and over multiple days, and hence assume trading an index-tracking instrument that trades beyond the regular session, with the trailing stops - if any - being active in the overnight session.
Aggressive/Intraday Models: Our aggressive, intraday models indicate the trading plans below for today.
Aggressive, Intraday Trading Plans:
For today, our aggressive intraday models indicate going long on a break above 4380, 4373, 4363, or 4351 with a 9-point trailing stop, and going short on a break below 4377, 4370, 4360, or 4348 with a 9-point trailing stop.
Models indicate no explicit exits for today. Models also indicate a break-even hard stop once a trade gets into a 4-point profit level. Models indicate taking these signals from 11:01am EST or later.
By definition the intraday models do not hold any positions overnight - the models exit any open position at the close of the last bar (3:59pm bar or 4:00pm bar, depending on your platform's bar timing convention).
To avoid getting whipsawed, use at least a 5-minute closing or a higher time frame (a 1-minute if you know what you are doing) - depending on your risk tolerance and trading style - to determine the signals.
(WHAT IS THE CREDIBILITY and the PERFORMANCE OF OUR MODEL TRADING PLANS over the LAST WEEK, LAST MONTH, LAST YEAR? Please check for yourself how our pre-published model trades have performed so far! Seeing is believing!)
NOTES - HOW TO INTERPRET/USE THESE TRADING PLANS:
(i) The trading levels identified are derived from our A.I. Powered Quant Models. Depending on the market conditions, these may or may not correspond to any specific indicator(s).
(ii) These trading plans may be used to trade in any instrument that tracks the S&P 500 Index (e.g., ETFs such as SPY, derivatives such as futures and options on futures, and SPX options), triggered by the price levels in the Index. The results of these indicated trades would vary widely depending on the timeframe you use (tick chart, 1 minute, or 5 minute, or 15 minute or 60 minute etc.), the quality of your broker's execution, any slippages, your trading commissions and many other factors.
(iii) These are NOT trading recommendations for any individual(s) and may or may not be suitable to your own financial objectives and risk tolerance - USE these ONLY as educational tools to inform and educate your own trading decisions, at your own risk.
#spx, #spx500, #spy, #sp500, #esmini, #indextrading, #daytrading, #models, #tradingplans, #outlook, #economy, #bear, #yields, #stocks, #futures, #inflation, #recession, #fomc, #fed, #fedspeak, #speech

USD/CAD pares gains, Canadian inflation easesThe Canadian dollar spiked and gained 50 points after Canada released the May inflation report but has pared these gains. USD/CAD is unchanged at 1.3158.
Canada's inflation rate fell sharply in May to 3.4%, down from 4.4% in April. As expected, much of that decline was due to lower gasoline prices. Still, this is the lowest inflation rate since June 2021.The core rate, which is comprised of three indicators, fell to an average of 3.8% in May, down from 4.2% a month earlier.
The decline should please policy makers at the Bank of Canada, as inflation slowly but surely moves closer to the 2% target. The BoC cited the surprise upswing in inflation in April as one reason for its decision to hike rates earlier this month. With headline and core inflation falling in May, will that be enough to prevent another rate increase in July? Not so fast. The BoC has said its rate decisions will be data-dependent, and there is the GDP on Friday and employment next week, both of which will factor in the rate decision.
The US released a host of releases today, giving the markets plenty to digest. Durable Goods Orders jumped 1.7% in June, up from an upwardly revised 1.2% in May and crushing the consensus of -1%. The core rate rebounded with a 0.6% gain, up from -0.6% and above the consensus of -0.1%. Later today, the US publishes the Conference Board Consumer Confidence and New Home Sales.
Wednesday is a light day on the data calendar, with the Fed will in the spotlight. Fed Chair Jerome Powell will participate in a "policy panel" at the ECB Banking Forum in Sintra, Portugal, and investors will be looking for some insights into Fed rate policy. As well, the Fed releases its annual "stress tests" for major lenders, which assess the ability of lenders to survive a severe economic crisis. The stress tests will attract more attention than in previous years, due to the recent banking crisis which saw Silicon Valley Bank and two other banks collapse.
There is resistance at 1.3197 and 1.3254
1.3123 and 1.3066 are providing support

NVDA and Inflation $NASDAQ:NVDA If inflation made everything more expensive, and NVDA has always had big moves why does wall street want me to sell my stock cheaper than before inflation spiked? Looks like they were caught offsides. NASDAQ:NVDA

AUD/USD pushes higher, CPI nextThe Australian dollar is in positive territory on Tuesday. AUD/USD rose as high as 50 pips earlier but has pared these gains and is trading at 0.6685, up 0.16%.
The Australian dollar is showing some life after last week's awful performance, in which it declined by 2.87%.
On Wednesday, Australia releases the monthly inflation report for May. Inflation is expected to ease to 6.1% y/y, down from 6.8% in April. If the consensus is accurate, this would mark the lowest inflation level since March. The Reserve Bank will be keeping close tabs on the inflation release, especially core CPI, which is a more accurate gauge of inflation trends. The core rate fell from 6.9% to 6.5% in April, but that is incompatible with a 2% inflation target, and the RBA will need to see core inflation fall much more quickly before it can think about winding up the current rate-tightening cycle.
The markets have priced in a rate pause from the Reserve Bank of Australia at 77%, and a significant drop in inflation on Wednesday should cement a pause at the July meeting. The RBA surprised the markets earlier this month when it raised rates by 25 basis points, bringing the cash rate to 4.35%. The minutes of the meeting indicated that the decision to hike was close, and a key factor in the decision was concern over persistently high inflation.
The central bank is well aware of the pain inflicted on households and businesses due to rising rates, and a pause in rate hikes would provide some relief, as well as allow the RBA to monitor the effects of its rate policy. At the same time, the central bank has made it absolutely clear that its number one goal is curbing high inflation, which means Wednesday's inflation release could have a significant effect on the direction of the Australian dollar.
AUD/USD put pressure on resistance at 0.6729 in the Asian session. Above, there is resistance at 0.6823
0.6598 and 0.6518 are providing support

Gold - War Breaking Out?Many would like to perceive the pause in interest rates by the US Federal Reserve as a bullish take for markets at large. However the forward direction by Powell signals towards the bigger picture; inflation cannot be stopped by the Fed.
March 2022, shortly after the invasion of the Donbas region by Russia the Fed began significant hikes in the Discount rate. See comparaison to SPX.
This has put pressure on domestic and international markets. As foreign central banks try to follow along with hikes to avoid capital outflows, they have not been able to keep up. The international value of the US Dollar has risen considerably since January 2021, the trend accelerating as flight to quality has driven capital towards the US in the face of war. See below US02-year and US10-year treasuries plotted on the same axis, compared to the US Dollar Index.
During this time, the price of gold COMEX:GC1! has made a few rallies towards the 2011 high, relating to geopolitical and sovereign risk.
This price level in gold could prove very significant moving forwards. The market has indicated towards a long-term trend. It should be noted, that entities involved in potential geopolitical conflicts will move assets accordingly in advance.
It is inevitable that war will continue to escalate, and so long as it does inflation will persist across the globe. In spite of capital flows towards the United States, global scarcity driven by shortages, insurance rate increases, impaired logistics and corrupt governments will continue to erode the domestic value of the dollar. The inflation we have been experiencing is war inflation, and no central bank has the power to stop the reactionary shock in financial markets that occurs when capital must seek cover.
There appears to be political turmoil in Russia, but the question unanswered is why? It must be understood, that there is a strong belief in Russia that Putin has been too restrained by only invading the Donbas region. What is being stoked by NATO, is an ethnic conflict. Subtle difference in language and religion separate two relatively new nations, Russia and Ukraine. Kyiv the home of the Russian Orthodox church, established in what was the capital of a greater empire, collapsing in the late 1800s. That is to say, the contested regions in this war are hotbeds for an ethnic conflict. Paramilitary groups in Russia and Ukraine (of which there are many) have quite a well known and gruesome history between them, despite receiving little attention since 2022.
With neither government viewed at large as capable, there is a massive tailwind risk with the US' approach to funding. It seems well established by now there is nobody accountable for how the weapons and munitions being shipped to Ukraine are being handled, and Nazism is rampant in the army. In addition to repeated attempts on Putin's life, the US is now discussing giving Zelensky of Ukraine access to nuclear weapons.
With a "coup" having now taken place, it must be clear that there is a quickly growing threat of war escalating quickly. No attempts at negotiation have been made by Ukraine, despite massive loss of life on both sides. Therein lies our why. Consider the paramilitary groups are now willing to march against Moscow, what prevents them from marching on Kyiv? The negotiation between them has been settled, a new leader appointed and separation from the Russia government is complete. The dogs of hell let loose.
Gold, Silver COMEX:SI1! and mentioned in a previous post, Natural Gas NYMEX:NG1! , are all forming lows after making new major highs. Inflation will persist and push the nominal price of gold up, but capital flows will nullify that effect to NY COMEX gold prices, as AMEX:GLD follows. This market is pushing towards a significant breakout, and this will move the price as global markets respond by moving capital. Gold becomes a target for flight to quality at this time.
Friday was an ideal major low, the market may continue to make minor lows but a sustained rally to 2000 and beyond should be considered a bullish sign.

We’ve been here before. 2000’s Nasdaq vs Today.The Nasdaq's formidable recovery from the October 2022 bottom resulted in an impressive 42% surge, a rare feat for a major index. However, as it grapples with resistance at the 15250 level this past week, we are compelled to question if this upward momentum is running out of steam. Notably, historical instances where the Relative Strength Index (RSI) soared past the 70 level have often been followed by a downward shift for the index.
We diligently monitor the Nasdaq's ratio against other major indices to gauge its relative value. At its current level, the Nasdaq seems to be trading at a premium compared to several other major indices.
When we consider this ratio, the Nasdaq appears to be near its all-time highs. In fact, it's trading close to or above the levels seen during the dot-com bubble of the 2000s in all comparisons. When juxtaposed with the S&P and Dow, we find that this level is not unprecedented; each time the ratio has previously reached this level, it was swiftly corrected.
Drawing a parallel between the economic conditions of the 2000s and now, it seems that we are in familiar territory, or as they say, ‘we’ve been here before’.
To illustrate the similarities, let's consider the dot-com peak in March 2000 as a reference point.
The current economic indicators closely mirror those from the 2000s, as reflected in measures such as Dollar strength, inflation, unemployment, and interest rates. In particular, the US 2Y-10Y spread indicates an inversion of the yield curve that surpasses even the extent seen during the 2000s. Simultaneously, the other indicators nearly align with their respective levels from that period.
This begs the question: What has been propelling the Nasdaq higher? Could it be the hype surrounding AI and technology, or is it the liquidity in the market?
We posit that it's a combination of both factors, as the tech rally and increased reserve balance seem to coincide with the ratio’s upward movement. Although we don't foresee a tech bubble bursting as it did in the 2000s, there's undeniable enthusiasm for the Nasdaq. Given the current setup's striking resemblance to the 2000s, we can glean lessons from that period to position ourselves optimally.
One potential strategy could be to short the Nasdaq 100 Futures on CME outright at the current level of 15086, with the take profit at 13900 and a stop loss at 15600. Alternatively, investors expressing a bearish view on the Nasdaq 100 ratio could consider shorting 2 Nasdaq 100 Futures and going long on 3 S&P500 Futures.
In the second setup, the dollar value of the position is equal, as the contract value of the Nasdaq 100 Futures and the S&P500 Futures is approximately the same, at roughly 600,000 USD for the full-sized contract at the current price level for both index. The same setup can be replicated using the micro Nasdaq 100 and S&P500 futures at the same ratio, where the position value is now roughly 60,000 USD.
For each 1 point move in the standard size E-MINI S&P 500 Futures contract, the equivalent value is 50 USD and 5 USD for the Micro contract. Similarly, each 1 point move in the standard-sized E-MINI Nasdaq 100 Futures contract equates to 20 USD, and 2 USD for the micro contract.
Trading this spread could potentially benefit from a margin offset of up to 70%, meaning that the capital required to initiate this trade is significantly reduced. This setup could be particularly attractive for traders seeking to optimize their capital usage while gaining exposure to these major indices.
The charts above were generated using CME’s Real-Time data available on TradingView. Inspirante Trading Solutions is subscribed to both TradingView Premium and CME Real-time Market Data which allows us to identify trading set-ups in real-time and express our market opinions. If you have futures in your trading portfolio, you can check out on CME Group data plans available that suit your trading needs www.tradingview.com
Disclaimer:
The contents in this Idea are intended for information purpose only and do not constitute investment recommendation or advice. Nor are they used to promote any specific products or services. They serve as an integral part of a case study to demonstrate fundamental concepts in risk management under given market scenarios. A full version of the disclaimer is available in our profile description.
Reference:
www.cmegroup.com
www.cmegroup.com
www.cmegroup.com
www.cmegroup.com

Virulent inflation raises pressure on the Bank of EnglandThe inflation battle is far from over in the UK. In fact, the nature of inflation is taking a new form as the root cause moves away from external to more domestically driven shocks. While the headline rate remained unchanged at 8.7%yoy in May, core inflation accelerated to 7.1% in May from 6.8% in April, marking the highest rate since March of 19922.
In response the Bank of England (BOE) raised interest rates by a bumper 50Bps to a 15-year high. While the Federal Reserve (Fed) and the European Central Bank (ECB) have made progress on bringing down inflation, the BOE still has some ways to go. Current market pricing assumes the terminal policy rate will go to 6% by year end3.
UK inflation proving to be virulent
The UK has the most severe entrenched inflation problem across developed markets. The domestically driven increase of services prices advanced from 6.9% to 7.4%yoy in May4. As services are labour intensive, they are being impacted by strong wage gains. Employment growth has been stronger than projected underscoring continued robust demand for labour. This high demand caused the rise in weekly average earnings (ex-bonus) to 7.5% in April5, well above the BOE’s forecast.
Brexit has been partly responsible for the rise in wages. Brexit reduced the mobility of European workers. The resulting lack of non-qualified workers has not yet been reabsorbed. The situation was clearly exacerbated during the Covid pandemic that left a large part of the workforce sick. The shortage of workers in the UK continues to weigh on the supply side and has been the key reason inflation has remained stubbornly high.
The resilient gains in employment (up 1.2% in April 20236) have allowed UK households to continue spending on services. Thereby contributing to higher services inflation, prices for recreational and cultural goods and services rose by 6.8%yoy in May 20237. At the same time, due to the shift away from floating rate mortgages towards fixed rate products over the last decade, the pass through of higher rates is taking longer to feed through the economy, thereby enabling the consumer to appear more resilient. However, headwinds are appearing from higher mortgage rates, with at least 800,000 fixed mortgages due to move on to significantly higher rates in H2 20238. Rents have also been rising, at an annualised pace of 5.6% in May compared to 3.2% in 20229. This is likely to place further pressure on real disposable incomes and simultaneously fuel core inflation higher.
The Institute for Fiscal Studies estimates that higher interest rates will cause the average mortgage holder to suffer an 8.3% fall in disposable income compared to a scenario where rates remained at March 2022 levels. For 1.4 million of those borrowers, disposable income will fall by more than 20%10.
BOE guided dovish
The BOE’s guidance implied that no further rate hikes should be needed bar evidence of more persistent inflationary pressures however the market ignored this. Money markets priced a terminal rate of 6.25% by February 202411. The BoE did not rule out further rate increases should the inflation data continue to be unfavourable. However, they did downplay the unexpected surge in core inflation in May owing to special contributing factors such as the sharp rise in vehicle excise duty and the erratic contribution of airfares and holiday packages. The BOE also highlighted that forward looking indicators are pointing to material falls in future wage inflation which could then lower the pressure on services prices.
We share that view, as producer price inflation which tends to serve as a leading indicator for consumer price inflation, eased more than expected in May. The June composite Purchasing Managers Indices (PMI) dropped for a second month in June, showing price pressures easing across the board, suggesting the economy could be turning.
Sterling
Positive rate surprises are not always positive for the currency. The Pounds muted response (-0.17%)12 to the BOE meeting despite the hawkish surprise and its negative reaction (-0.21%)13 to the hawkish May inflation data suggest that the BOE is prepared to endure a deeper slowdown in order to bring inflation under control. As a growth sensitive currency this is likely to remain an important headwind for the Pound.
Sources
1 Bloomberg as of 23 June 2023
2 Bank of England as of 22 June 2023
3 Bloomberg, as of 23 June 2023
4 Bank of England as of 21 June 2023
5 Office for National Statistics as of 31 May 2023
6 Office for National Statistics as of 31 May 2023
7 Bank of England as of 22 June 2023
8 Source: Bank of England, Bloomberg as of 22 June 2023
9 Office for National Statistics, as of 22 June 2023
10 Institute for Fiscal Studies as of 30 April 2023
11 Bloomberg as of 23 June 2023
12 Bloomberg GBP/USD as on 22 June 2023
13 Bloomberg GBP/USD as on 20 June 2023

EURGPB RISING PRICEEuro has been completely destroyed by GBP money market rates. As of now all expectations have been released and further hikes may be required. EURGBP has been trading in the same price for 3 weeks and is starting to turn the tide.
The market seems bottomed out.. as long as UK inflation data and employment data does not show hotter than expected data, then EUR might have a rebound trade here.
Give your opinion of EURGBP in the comments below. Thank you for your attention.

GBPCAD: Hidden Bearish Divergence Confirming a 3rd Lower HighWe have some Hidden Bearish Divergence on the monthly MACD as the GBP is failing to get above the highs for the 3rd time. This could eventually lead to a huge breakdown that could take it all the way down to the 1.618 Fibonacci Extension.

QQQ Outlook 0626-30/2023Technical Analysis: Last week’s price action put NASDAQ:QQQ back inside the bullish channel we’ve been watching since March. We should see come corrective price action this week before tech runs higher.
Bulls will look to see if we can stay above last week’s lows at 360. It is crucial bulls hold this level or we could see the daily fair value gap that could be filled below at 357.66.
Bears will want to see a breakdown under the daily fair value gap, where we could test the strong monthly level at 354.43. If we lose the levels above, we can look for a test of the lower trendline in the upcoming weeks, and possibly a large gap to fill to the downside from 336.67-332.91. Inside this gap is the 50SMA and the 61.8% retrace at 334.00.
Upside Targets: 364.57 → 370.10 → 373.83 → 380.76 → 386.28
Downside Targets: 360.00 → 358.97 → 357.66 → 354.43 → 352.46

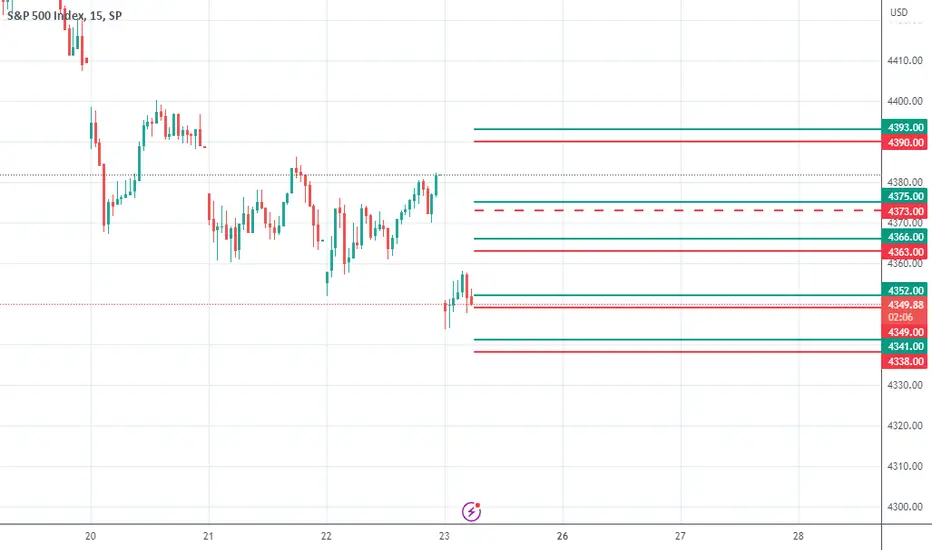
Trading Plans for FRI. 06/23 - Bull Run Consolidation, ContinuedS&P 500 INDEX MODEL TRADING PLANS for FRI. 06/23
In our trading plans for Fri. 06/16, we wrote: "The spectacular bull run of the last few weeks fueled by speculation around the Fed policies and, possibly, an epic short squeeze, could be consolidating in the week ahead". This has played out as anticipated with yesterday's consolidation. It appears gaining traction with Powell's comments about inflation and interest rates this morning.
The index slightly consolidated downwards from 4409.59 from the close on Thursday, 06/15 to the close of 4381.89 yesterday, Thursday, 06/22. Our models indicate 4315-4325 as the next support level, which might be tested in the coming days.
The potential bull trap cautioned about by our models continues to be in play. Those bulls who must have noted our models' trading plans and took some money off the table would have saved themselves some heartache. Bears should be nimble with their shorts. It is a bull market until it is broken - currently, this bull run is not broken, yet.
Positional Trading Models: Our positional models indicate going short on a break below 4350, with a hard stop at 4406, effective from 11:00am EST today.
By definition, positional trading models may carry the positions overnight and over multiple days, and hence assume trading an instrument that trades beyond the regular session, with the trailing stops - if any - being active in the overnight session.
Aggressive/Intraday Models: Our aggressive, intraday models indicate the trading plans below for today.
Aggressive, Intraday Trading Plans:
For today, our aggressive intraday models indicate going long on a break above 4393, 4375, 4366, 4352, or 4341 with an 8-point trailing stop, and going short on a break below 4390, 4363, 4349, or 4338 with a 9-point trailing stop.
Models indicate explicit long exits on a break below 4373. Models also indicate a break-even hard stop once a trade gets into a 4-point profit level. Models indicate taking these signals from 11:01am ET or later.
By definition the intraday models do not hold any positions overnight - the models exit any open position at the close of the last bar (3:59pm bar or 4:00pm bar, depending on your platform's bar timing convention).
To avoid getting whipsawed, use at least a 5-minute closing or a higher time frame (a 1-minute if you know what you are doing) - depending on your risk tolerance and trading style - to determine the signals.
(WHAT IS THE CREDIBILITY and the PERFORMANCE OF OUR MODEL TRADING PLANS over the LAST WEEK, LAST MONTH, LAST YEAR? Please check for yourself how our pre-published model trades have performed so far! Seeing is believing!)
NOTES - HOW TO INTERPRET/USE THESE TRADING PLANS:
(i) The trading levels identified are derived from our A.I. Powered Quant Models. Depending on the market conditions, these may or may not correspond to any specific indicator(s).
(ii) These trading plans may be used to trade in any instrument that tracks the S&P 500 Index (e.g., ETFs such as SPY, derivatives such as futures and options on futures, and SPX options), triggered by the price levels in the Index. The results of these indicated trades would vary widely depending on the timeframe you use (tick chart, 1 minute, or 5 minute, or 15 minute or 60 minute etc.), the quality of your broker's execution, any slippages, your trading commissions and many other factors.
(iii) These are NOT trading recommendations for any individual(s) and may or may not be suitable to your own financial objectives and risk tolerance - USE these ONLY as educational tools to inform and educate your own trading decisions, at your own risk.
#spx, #spx500, #spy, #sp500, #esmini, #indextrading, #daytrading, #models, #tradingplans, #outlook, #economy, #bear, #yields, #stocks, #futures, #inflation, #recession, #fomc, #fed, #fedspeak, #softlanding, #hawkishpause, #pause
Gold:the monetary commodity’s fate in the hands of central banksGold is arguably the most sensitive commodity to monetary policy. The metal operates more like a pseudo-currency than a regular commodity (a regular commodity’s price is driven by the balance of supply and demand, gold is driven by many of the macro determinants of currencies).
After hiking rates every meeting since February 2022, the Federal Reserve (Fed) took a pause in June 2023. The central bank has lifted the upper bound of Fed Fund target rates from 0.25% to 5.25% over that timeframe, marking one of the most rapid rate hiking cycles in history. At times, the Fed was hiking in 0.75% clips. Rising interest rates were an extreme headwind for gold for most of this period. Can gold investors breathe a sigh of relief now? Is this a temporary pause, or a halt on rate hikes? Well, if Fed Fund futures are to believed, there may be one more rate hike by September 2023. If the participants of the Federal Open Market Committee (FOMC) are to be believed, there could be several more rate hikes (with the median expectation of these participants pointing to a terminal midpoint rate of 5.625%, that is, an upper bound of 5.75%). Professional economists1 seem less sure of such decisive action, with the median looking for no change in rates this year (and cuts commencing in Q1 2024). Senior Economist to WisdomTree, Jeremy Siegel, believes the Fed is done hiking and that alternative inflation metrics, which incorporate real time housing inputs, show inflation running at 1.4% instead of the official 4.1% in May 20232.
Market inflation expectations are not falling away as fast as we would expect. Judging by the 5yr5yr swaps, longer-term market inflation expectations are actually rising modestly. Higher inflation tends to be gold-price supportive (other things being equal).
After hitting an all-time high in 2022, central bank demand for gold has maintained strong momentum. Official sector gold buying in Q1 2023 was the largest on record for the first quarter (albeit lower than Q3 2022 and Q4 2022). A YouGov poll, sponsored by the World Gold Council3 , showed that developing market central banks are expecting to increase their gold reserve holdings and decrease their US dollar reserve holdings.
With a lack of forceful stimulus from the Chinese government, and still elevated gold prices in Renminbi terms, we expect a slowing of retail demand in China. In fact, Shanghai premiums over the London Bullion Market Association (LBMA) price slowed in May and remain low in June.
Looking to WisdomTree’s gold price model, we can see that bond headwinds have clearly fallen away and US dollar depreciation (relative to a year ago) is offering gold some support rather than dragging prices lower. However, investor sentiment towards the metal has moderated since March 2023, when the collapse of Silicon Valley Bank (SVB) and the shotgun marriage between UBS and Credit Suisse Banks was announced. With the passing of the US debt ceiling debacle, there aren’t any specific risks driving gold demand higher. However, general recession fears and the potential for unspecified financial sector hiccups are likely to keep gold demand moderately high as the metal serves well as a strategic asset in times of uncertainty.
Source:
1 Bloomberg Survey of Professional Economists, June 2023.
2 The alternative measure calculates shelter inflation using Case Shiller Housing and Zillow rent which annualise at 0.5% instead of the 8% that is biasing the Bureau of Labor Statistics CPI higher.
3 2023 Central Bank Gold Reserves Survey, May 2023.

Is It Time to Follow the Oracle's Lead?You may have heard of a certain Warren Buffett, and it seems like he might be onto something...
Buffett, known as the "Oracle of Omaha," has demonstrated remarkable investment timing, or perhaps an innate ability to steer investment flows. This was clearly illustrated by his investment in Japan, which triggered a rally in the Nikkei to decade-long highs. While that window may have closed, Buffett has been discreetly bolstering his stake in another entity - Occidental Petroleum (OXY).
If we scrutinize the timing of his purchases, it's apparent that Buffett likely had a price floor in mind. Intriguingly, his first purchase occurred when Crude was trading at a 15-year high!
This leads us to examine Oil, which has been trading nearly 40% lower since mid-2022.
Since our last discussion about oil, the Strategic Petroleum Reserve (SPR) has been further depleted, reaching its lowest level since 1983. The result of this drawdown is a diminished impact on energy costs as evidenced by the energy inflation index, which has not only passed its peak but has now turned negative.
Interestingly, the Canadian dollar and the Norwegian Krone, currencies of major oil-exporting countries, have been outpacing the commodity typically correlated with them, Crude Oil.
On the whole, it seems the energy commodity sector may have bottomed out, with all types of Oil and natural gas trading on an upward trajectory.
In consideration of these factors, the outlook for oil leans towards the bullish side. The scarcity of oil in the SPR and the absence of energy inflation as a significant contributor to overall CPI make it unlikely for the U.S. to release more oil to depress energy prices. Coupled with the buoyant trend in the energy commodity space and the recent outperformance of major oil-exporting countries' currencies, it appears to be an opportune moment to consider a long position on oil. At the current price level of 72.33, risk managed trade points to setting the stops at the previous support of 66 and take profit level at 85. Each Crude Oil Future contract is equal to 1000 barrels of crude oil. Each 0.01 point increment in Crude Oil Futures is equal to 10 USD . The same view can also be expressed with greater precision using the Micro WTI Crude Oil, where each Micro contract is equal to 100 barrels of crude oil and each 0.01 point increment is equal to 1 USD.
The charts above were generated using CME’s Real-Time data available on TradingView. Inspirante Trading Solutions is subscribed to both TradingView Premium and CME Real-time Market Data which allows us to identify trading set-ups in real-time and express our market opinions. If you have futures in your trading portfolio, you can check out on CME Group data plans available that suit your trading needs www.tradingview.com
Disclaimer:
The contents in this Idea are intended for information purpose only and do not constitute investment recommendation or advice. Nor are they used to promote any specific products or services. They serve as an integral part of a case study to demonstrate fundamental concepts in risk management under given market scenarios. A full version of the disclaimer is available in our profile description.
Reference:
www.cmegroup.com
www.cmegroup.com
www.eia.gov
tradingeconomics.com

GBP/USD dips after inflation jumps, BoE up nextThe British pound has edged lower on Wednesday. GBP is trading at 1.2724 in Europe, down 0.3%. GBP/USD spiked after today's inflation release but in currently in negative territory.
The UK released the May inflation report today, and the results were a major disappointment, to put it mildly. With inflation falling for two straight months, there were hopes that the Bank of England's rate policy was slowly working and the downtrend would continue. The monthly readings showed that headline and core CPI eased, but the annualized readings were worse than expected.
Headline CPI remained at 8.7%, above the consensus of 8.4%. Core CPI rose from 6.8% to 7.1%, above the consensus of 6.8%, the highest level since March 1992. The core rate, which excludes food and energy prices, is considered more important, and the 0.3% gain is a huge disappointment for the BoE.
The Bank of England won't have much time to mull over the inflation figures, as it announces its rate decision on Thursday. There's little doubt that the BoE will have to raise rates for a 13th consecutive time, and today's inflation numbers mean there is a strong possibility of an oversize 0.50% increase.
The BoE finds itself between a rock and a hard place, as it struggles to contain inflation without causing a recession. The resilient labor market has complicated the BoE's attempts to cool the economy, and the markets are projecting that the Bank Rate, currently at 4.5%, won't peak until 6%. High inflation has already caused a cost-of-living crisis, and more rate hikes will only exacerbate the pain.
Fed Chair Powell begins two days of testimony before Congress on Wednesday. Lawmakers are expected to grill Powell about the Fed's rate policy. The Fed paused at this month's meeting but is expected to raise rates at the July meeting. Powell has said that he can pull off a soft landing that will avoid a recession and jump in unemployment, but he'll likely have to answer pointed questions from lawmakers who are concerned that higher rates will damage the economy.
1.2719 remains under pressure in support. Next, there is support at 1.2645
There is resistance at 1.2848 and 1.2950

GBP/USD lower ahead of UK inflationThe British pound is lower on Tuesday. In the European session, GBP/USD is trading at 1.2739, down 0.41%.
The UK releases the May inflation report on Wednesday and BoE policy makers will be hoping that inflation continues to trend lower. Inflation dropped in April to 8.7%, decelerating for a second straight month. The consensus stands at 8.4%, and the good news is that those awful readings above 10% appear to be over. On a monthly basis, inflation is expected to fall to 0.5% in May, down from 1.2% in April.
Inflation appears to have peaked and is heading lower, but nobody at the Bank of England is smiling. The UK is expected to have one of the highest inflation rates in the G-20 this year at 6.9% and the BoE's 2% target is miles away. Finance Minister Sunak has set a goal of lowering inflation to 5% by the end of the year, which seems feasible if inflation continues to downtrend in the coming months.
The BoE will be in the spotlight on Thursday when it makes its rate announcement. The markets have priced in a 25-basis point hike at 70%, with a 30% chance of an oversize 50-bp increase. If inflation falls as expected to 8.4% or lower, the MPC should be able to proceed with the 25-bp hike, although central banks have a tendency of surprising the money markets.
In the US, it's an unusually light data calendar this week. There are no tier-1 releases on Tuesday, and the markets are looking ahead to Wednesday, with Jerome Powell testifying before the House Financial Services Committee. Powell will have to clarify to lawmakers the Fed's interest rate path, as the Fed paused last week after ten straight hikes but expects to renew hiking in July.
1.2719 is under pressure in support. Next, there is support at 1.2589
There is resistance at 1.2848 and 1.2950

AUD/USD drifting lower ahead of RBA minutesThe Australian dollar has started the week with losses. AUD/USD is trading at 0.6848, down 0.39%. The Australian dollar gained 1.95% last week and has soared 5.2% in the month of June.
The Reserve Bank of Australia releases the minutes of the June meeting on Tuesday. At the meeting, the Bank decided to raise rates by 0.25%, bringing the benchmark rate to 4.10%. This surprised the markets, which had expected the central bank to pause. Governor Lowe continued his hawkish stance after the decision, defending the interest rate as necessary since "upside risks to the inflation outlook have increased".
Lowe has his hands full with sticky inflation, which rose in April from 6.3% to 6.8% y/y, above the consensus of 6.4%. The core rate fell from 6.9% to 6.5%, but this is much too high for the RBA, which has a target of 2%. The RBA has projected that inflation will not fall to 2% until mid-2025, leaving little doubt that the current rate-hike cycle is not close to wrapping up. The minutes should provide insights about the rate hike and what the central bank has planned moving forward. The RBA meets next on July 4th.
The Fed is also very concerned with inflation but took a different approach, as it paused at last week's meeting after ten consecutive hikes. Fed policymakers got some good news on Friday, as UoM inflation expectations eased to 3.3% in June, down sharply from 4.2% in May and lower than the 4.1% consensus. Inflation expectations haven’t been this low since March 2021 and this is another indication that inflation is heading lower. The UoM Consumer Sentiment report climbed from 59.2 to 63.9, due to lower inflation expectations as well as the resolution of the banking crisis, according to the report.
AUD /USD tested support at 0.6836 earlier. Next, there is support at 0.6729
0.6940 and 0.7004 are the next resistance lines

S&P 500 Daily Chart Analysis For Week of June 16, 2023Technical Analysis and Outlook:
The Reignited Rally continues to move forward this week, hitting our target Outer Index Rally 4412 and, by doing so, completing Inner Index Rally 4444. This suggests a couple of trading scenarios: The unconfirmed completion by Trade Selecter, the market severity will pull back to Mean Sup 4365, followed by a solid bounce to retest the developed and confirmed by Trade Selecter Key Res 4425. The second scenario will display Spooz regrouping within the vicinity of developing Key Res and penetrating higher by targeting Outer Index Rally 4480. Trade Selecter will closely monitor any updates and share any valid confirmation with you. (Please note that there will be no Daily Chart Analysis for the week of June 23. The next update will be on June 30).

USDX ShortsHi traders, looking for a bearish momentum rolling into the new week, looking to take the trade in the overllap off monday or tuesday

Central banks navigate the last stretch of the tightening cycleThis week we learnt how vital Central Bank communication is to global financial markets. The trio of central banks – The Federal Reserve (Fed), European Central Bank (ECB) and the Bank of Japan (BOJ) held their respective meetings. Each of the central banks tried to convey how they will navigate monetary policy amidst a slowing economy and avoid a hard landing.
China takes small steps to shore up the recovery
Even the People’s Bank of China (PBOC) surprised the markets this week, by announcing a cut in the 7-day Open Market Operations (OMO) by 10Bps to 1.9%1 which paved the way for another cut to the one-year medium term lending facility rate by 10Bps to 2.65%2. These recent developments mark a more proactive stance by Chinese policy makers in trying to tackle the Chinese slowdown in activity since the re-opening. Clearly more is needed. Policymakers are soliciting opinions from business leaders and economists on how to revitalise the economy in a number of urgent meetings3. While the Fed and ECB are trying to tame inflation, China has the opposite problem as inflation remains low. Manufacturing remains weak, exports are slowing, and credit growth is cooling. This is why it’s no surprise that the markets are prepping for a broader package of stimulus targeted towards the ailing property sector.
A hawkish skip for the Fed
The recent flurry of economic reports continues to show the US economy is holding up but losing steam, supporting the Fed’s approach of changing the pace of its policy tightening. The Fed kept the fed funds rate in range of 5-5.25%, by unanimous vote, in line with market expectations after 10 straight hikes dating back to March 2022.
The Fed’s dot plot showed the median rate at 5.6% versus 5.1% a month back. In the summary of economic projections, the median unemployment rate forecast was revised lower from 4.5% to 4.1% by the end of 2023 while the core inflation rate was revised higher from 3.6% to 3.9% making the case for more hikes this year. This clearly was a hawkish skip.
Fed Chairman Jerome Powell was careful to point out that no decision was made on a July hike, but he did say it is a live meeting, leading the market to increase the probability of a move. What surprised me the most, was that Powell said rate cuts would be a couple of years out which is at odds with the dot plot forecast of 100Bps of cuts in 2024.
Senior Economist to WisdomTree Jeremy Siegel believes the Fed is done hiking and that alternative inflation metrics which incorporate real time housing inputs show inflation running at 1.4% instead of 4.1%. This is based on alternative shelter inflation calculations using Case Shiller Housing and Zillow rent annualized at 0.5% instead of the 8% that is biasing Bureau of Labor Statistics (BLS) CPI higher.
ECB’s revised inflation forecasts remain at odds
After raising the deposit rate by 25Bps to 3.5%, the ECB was a lot clearer than the Fed in signalling that rate hikes are almost certain next month on July 27. The ECB remains too optimistic on growth, reducing their projection for 2023 real GDP to only 0.9% (from 1% in its March projections).
While I would agree with the ECB’s view that (1) mostly labour-intensive services will support economic growth over the next two years and (2) the current hump in wage inflation will show up via higher prices for these services, I remain sceptical amidst the global headwinds for manufacturing, and a slower pace of overall growth could keep inflation as high as the ECB now projects. While wages are likely to accelerate slightly above 5% in 2023, they should begin declining to 4% yoy by late 2024. We believe, if core inflation continues to recede in the coming months and the real economy grows at 0.4% in 2023, the ECB will stay put in September after a final move next month.
As expected, the ECB confirmed that it will stop to reinvest proceeds from maturing bonds under its standard Asset Purchase Programme (APP) from July onwards. It won’t offer new long term liquidity injections upon the expiry of the €477Bn of a TLTRO III liquidity measure on 28 June 2023.
BOJ sits tight
As expected, the BOJ kept all key policy settings unchanged, including the +/-50Bps band around the zero% Japanese Government Bond JGB yield target. Since taking the helm in April 2023, BOJ Governor Kazuo Ueda has stressed the high cost of premature tightening as the economy is finally seeing green shoots toward sustainable inflation.
In contrast to the ECB, the BoJ's latest assessment and outlook for the economy and inflation were also largely unchanged from their update in the April Outlook Report. The BoJ continues to note "extremely high uncertainties" surrounding economies and financial markets at home and abroad." Japanese equity markets reacted positively to the BOJ’s status quo stance on monetary policy. Looking ahead, the Fed’s potential pivot back to a hawkish mode versus the BOJ’s dovish perseverance could pave the way for further upside for Japanese equities owing to the underlying weakness in the Yen versus the US dollar.
Sources
1 Bloomberg on June 13, 2023
2 Bloomberg on June 15, 2023
3 Bloomberg on June 14, 2023

EUR/USD surges after ECB rate hikeEUR/USD is trading at 1.0948 in Europe, almost unchanged on the day. On Thursday, the euro surged 1.05% in the aftermath of the ECB rate hike.
The ECB raised rates by 25 basis points on Thursday, bringing the benchmark rate to 3.50%, the highest level since 2001. The markets were not surprised by the move but ECB President Lagarde's hawkish comments following the rate announcement may have surprised some and the euro responded with massive gains.
In her press conference, Lagarde said that barring a material change, it was "very likely" that the ECB would continue raising rates in July. Lagarde dampened any thoughts of a pause, even though the eurozone economy remains fragile and growth is expected to be weak. Headline inflation has been falling sharply in the eurozone, as energy prices have fallen. This is positive news, but the ECB is more concerned about core inflation, which is a better gauge of where inflation is headed. The core rate, which excludes energy prices, has been stickier than expected. Inflation has also cooled due to the ECB's rate tightening, but the current rate of 6.1% is far too high for the central bank, which is likely to hike again in July.
The Federal Reserve dramatic decision on Wednesday contained two important aspects. First, the Fed took a breather and held rates after 10 straight rate increases. Second, the Fed signalled that the pause did not indicate the end of the current rate-tightening cycle, as the Fed was projecting two more hikes in the second half of the year. Fed Chair Powell reiterated in his press conference that the inflation battle "has a long way to go" and there is every indication that Powell will keep hammering away with rate hikes until inflation falls to the 2% target.
There is resistance at 1.1050 and 1.1147
1.0922 and 1.0854 are providing support

12/06/23 Weekly outlookLast weeks high: $27401.2
Last weeks low: $26363.7
Midpoint: $25326.2
A massive week in the markets this week:
Tuesday - US inflation data to be released tomorrow (Inflation rate YoY, MoM and core inflation YoY.)
Wednesday - PPI MoM, FED interest decision, FOMC economic projections & FED conference.
Thursday - Initial jobless claims & US retail sales
All these events happening so closely together signals huge volatility to be expected. This coupled with the SEC news the crypto space is balancing on a knife edge. We've already seen alts bleed extensively but BTC and even ETH have yet to seen similar sell-offs. Perhaps we will see it this week.
As it stands price is near last weeks low, with the incoming volatility I think we can safely assume that price will break lower, it's a question of how far below it will go.

$DXY - 'ABC' Waves Completed - The Dollar Index TVC:DXY seems to have completed Wave C of its A-B-C Elliot Waves Correction, today on ECONOMICS:USINTR Fed's announcement.
TVC:DXY must hold the lows of Wave C at 102.6 and 1 level of Fibb' Zone,
otherwise, its macro downtrend from 114 High will be printing another Bearish Lower High
This, however, would be a fantastic opportunity for The Financial Markets
to explode more on their uptrend resumptions .
TRADE SAFE
*** NOTE that this is not Financial Advice !
Please do your own research and consult your Financial Advisor
before partaking in any trading activity based solely on this Idea .
