SPX: Watch These Stocks to CASH IN on EGGS 🥚Hi Traders, Investors and Speculators of the Charts 📈📉
The SPX Chart is looking bullish as we see another very clear pattern form - the higher lows. Previously, this has been a sign that we can expect more upside movement from the stock market. But not all stocks are equal during this time... Have you bought some eggs recently?
Forget high gas prices. If you've tried to buy eggs lately, you've paid up or done without. But some investors are finding a way to cash in. Shares of one of the largest publicly traded egg producers, Cal-Maine (CALM) is up 39% in past 12 months. That's impressive as while the S&P 500 was down more than 7% during that time. Egg prices are on fire — even more so than oil. The price of a dozen grade-A eggs was $4.25 nationally in December 2022, says the Bureau of Labor Statistics, up 138% from the same period a year ago. In some places, like California, eggs sell for even more.
Egg prices are becoming the new face for runaway inflation. Millions of hens died last year in an outbreak of disease. That sharply cut the supply of eggs. Cal-Maine is even considered a meme stock now, landing in the Roundhill Meme ETF (MEME). The avian flu's effect on supply will ease, analysts say. But investors who look closely will see that corporate profits at egg companies are booming, too. And that's not seen easing anytime soon.
"Energy prices fell 4.5% in December on a 9.4% decline in gasoline prices. Food prices rose 0.3%, with food at home up 0.2% and food away from home up 0.4%, " said Bill Adams, chief economist for Comerica Bank. "Egg prices rose 11.1% on the month, pushed higher by an avian flu outbreak that has hurt supply."
So when you're ready to cough up the big bucks to buy eggs, at least know there's a way to profit, too.
HEY👀 Interested in Bitcoin? Here's my take for the SHORT TERM :
_______________________
📢Follow us here on TradingView for daily updates and trade ideas on crypto , stocks and commodities 💎Hit like & Follow 👍
We thank you for your support !
CryptoCheck
Inflation

Nasdaq, massive distribution?
Nasdaq have been in sideway for the first half of Feb 2023
During this period we have
1) FOMC meeting
2) CPI data
3) PPI Data
4) Unemployment Data
5) Retails
During the FOMC on the 1st of Feb 2023, Powell was confident of a soft landing. He mentioned the word "disinflation" approximately 20 times. He gave the green light for the market to rally by stating he does not think the financial conditions have eased since Dec 2022's FOMC.
The market rejoiced and rallied.... for one day and then proceed to go sideways for the next 2 weeks.
During these 2 weeks, all economic data show signs that there was no sign of disinflation.
MoM CPI was revised higher for Dec 2022 from negative 0.1% to positive 0.1%
Jan 2023's MoM CPI went back up by 0.5%
YoY PPI went was 6% compared to the consensus of 5.4%
MOM PPI went up by 0.7% instead of the consensus 0.4% (HOLY SHIT!!! F ME! IT IS almost doubled the consensus)
Unemployment went down to 3.4%, the lowest since 1969 (low unemployment equates to higher consumer spending equates to higher inflation)
MoM Retail sales went up 3% instead of the consensus 1.8& (HOLY SHIT!!)
If the critical support is broken, we have a long way down.
Much like inflation in 2021, maybe this "disinflation" is also transitory

EUR/USD at 3-week low after strong US dataThe euro is down for a third straight day and fell earlier to 1.0629, its lowest level since Jan. 23. In the European session, EUR/USD is trading at 1.0639, down 0.30%.
The US dollar is showing some strength this week against the majors, as US data continues to shine. Retail sales impressed with a 3% gain earlier this week, and PPI and unemployment claims were both better than expected. Is the disinflation process stalled?
The markets didn't expect such good numbers, but the economy has proved to be surprisingly resilient to rising interest rates. The Fed has been preaching 'higher for longer' for some time, but the markets stuck to their dovish stance, expecting that the Fed would have to pivot and even cut rates later in the year. The host of strong US numbers has forced investors to recalibrate, and the markets have revised upwards their peak rate forecast to above 5%.
The US dollar has been the big winner of the shift in market thinking, and US Treasury yields are at their highest level this year. Fed member Mester said she saw a strong case for raising rates by 50 basis points at the last Fed meeting, a sign that the Fed could move away from the moderate 25-bp hikes if inflation isn't falling quickly enough. Mester said that she didn't see inflation falling to 2% until 2025, which points to a long disinflation process.
The ECB raised rates by 50 basis points in February and has signalled that it will do the same at the Mar. 16 meeting. The main financing rate is currently at 3%, well below the Fed (4.5%) and other major central banks. It's not clear what the Bank has planned after the first quarter, but with inflation running at 8.5%, the risk for further rate hikes is skewed to the upside. The ECB has made it clear that rates will remain high until there is evidence that inflation is falling toward the target, which means that the current rate-tightening cycle isn't anywhere near its end.
EUR/USD is testing support at 1.0629. Below, there is support at 1.0581
1.0762 and 1.0847 are the next resistance lines

GBP/USD steadies, eyes UK retail salesThe British pound has steadied on Thursday. In the European session, GBP/USD is trading at 1.2053, up 0.25%. This follows a sharp drop of 1.2% a day earlier.
UK inflation continues to fall but remains disturbingly high. Headline inflation fell to 10.1% in January, down from 10.5% in December and below the consensus of 10.3%. The drop in inflation is welcome news, but food prices, a key driver of inflation, surged by 16.8% in January. With inflation still in double digits, the Bank of England will have to continue raising rates, with the most likely scenario being a 25-basis increase at the Mar. 22 meeting. The market probability of a 25-bp hike rose as high as 73% on Wednesday before dipping to 66% today, according to Refinitiv data.
In the US, retail sales delivered an impressive gain of 3% in January, above the estimate of 1.8%. This was a strong rebound from the December reading of -1.1% and marked the largest gain since January 2022. This positive release follows the January inflation report that ticked lower to 6.4% but was higher than expected. These strong numbers translated into strong gains for the US dollar on Wednesday, as the Fed will likely raise rates even higher in order to put the brakes on the strong economy.
The UK wraps up the week with retail sales on Friday. The markets are braced for bad news, with an estimate of -5.5% y/y for the headline figure (-5.8% prior) and -5.3% for the core rate (-6.1%). A weak retail sales report could sour investors on the pound and send the currency lower.
GBP/USD tested resistance at 1.2071 earlier in the day. The next resistance line is 1.2180
1.1958 and 1.1838 are providing support

UK Inflation drop to 5 month low at 10.10% - Still crazy high!The UK inflation rate has dropped to a 5-month low of 10.1%.
This tells us that the peak inflation may be behind us.
The decrease in transport costs, as well as restaurants and hotels, were the main drivers of the lower inflation rate.
However, if we compare it to other developed nations like the US, France, and Germany - the UK's inflation rate is still quite a bit higher.
Now we need to see the Bank of England (BoE) to keep taking action to drop the inflation and interest rates.
I mean an inflation rate of 10% or higher is still crazy!

US100 Price Breakout with Strong Support, But All Eyes on CPIThe US100, also known as the Nasdaq 100 index, has been making some significant moves recently that are worth keeping an eye on for traders. Specifically, there have been a few key levels that have been broken which are often seen as indicators of price momentum and potential future price movements.
One of these key levels is the 4-hour trendline. Trendlines are often used to help identify potential areas of support or resistance for a given security or index. When prices break above or below a trendline, it can signal a potential shift in price momentum. In this case, the US100 broke above a key 4-hour trendline, which is a bullish signal that suggests prices may continue to rise in the short term.
In addition to the trendline, the US100 also recently broke through a strong resistance zone. Resistance zones are areas where prices have struggled to break through in the past. When prices do finally break through a resistance zone, it can suggest a shift in market sentiment and a potential increase in buying pressure. In this case, the US100 broke through a key resistance zone and then retested that area as support, which is another bullish signal for traders.
However, despite these bullish signals on the charts, there is an important upcoming event that may have a significant impact on future price movements for the US100. This event is the release of US CPI (Consumer Price Index) data, which is scheduled for 5:30am PST.
CPI is a measure of inflation, which is one of the most important factors that the US Federal Reserve takes into account when making decisions about interest rates and monetary policy. Inflation that is too high can be a sign of an overheating economy, which can lead to increased borrowing costs and reduced economic growth. Therefore, the Fed is constantly monitoring inflation levels and using policy tools to try to keep inflation within a certain range.
The upcoming CPI release is expected to be a major market-moving event for the US100, as well as for other markets such as currencies and bonds. If the CPI data comes in below expectations (a "miss"), this may suggest that inflation is not as much of a concern as previously thought, which could lead to increased buying pressure for the US100. On the other hand, if the CPI data comes in above expectations (a "beat"), this may suggest that inflation is a bigger concern than previously thought, which could lead to increased selling pressure for the US100.
In either case, it is important to note that the Fed's next moves will likely be shaped by the CPI data. If inflation continues to be a concern, the Fed may take steps to raise interest rates or reduce asset purchases in order to try to curb inflation. This could have a significant impact on the US100 and other markets in the short and long term.
In summary, while the US100 has recently shown some bullish signals on the charts, traders should be cautious and pay close attention to the upcoming CPI release. The data from this release is likely to shape the Fed's next moves and could have a significant impact on future price movements for the US100 and other markets.

Dollar Doing a Double CheckTraders,
The Dollar really wants to make sure that its resistance overhead is legit. From a technical perspective, I love this! Should the dollar remain below my macro uptrend line, it will be all bulls for the next few weeks/months in the U.S. stock markets. The dollar should continue its sideways/down movement during the same interim. If the VIX is any indicator, then my thesis appears to remain intact. Watch closely. Blow off top should peak by mid/late summer or early fall.
Best,
Stew

Key Levels and Market overview into the Asian session openA look at the price action from the European and US sessions and what that may mean for the Asian session open after some stronger than expected US CPI data showing 'sticky inflation'. I look at some key levels to watch and the price action setups I expect to play out.
Markets covered :-
DOW
Nasdaq
DAX
FTSE
ASX200
Hang Seng
USD Index
Gold
Oil
Copper

$SPY bloody valentine 👁🗨️*This is not financial advice, so trade at your own risks*
*My team digs deep and finds stocks that are expected to perform well based off multiple confluences*
*Experienced traders understand the uphill battle in timing the market, so instead my team focuses mainly on risk management*
!! This chart analysis is for reference purposes only !!
If you want to see more, please like and follow us @SimplyShowMeTheMoney

US CPI Data Release PreparationTraders Watch Out!
The DXY is likely to see significant volatility with the US CPI for January due today (9:30pm GMT+8), with the current forecast expecting data to be released at 6.2% (Previous: 6.5%).
A slowdown of inflation growth could reinforce the Fed's view of disinflation and could lead to the DXY trading significantly lower. This is because investors would increase on bets that the Federal Reserve would be less likely to continue with its hawkish comments and over-the-top interest rate hikes.
With the DXY currently trading along the 103.20 price level, weakness in the DXY could see the price slide lower toward the key support level of 102.650. However, before the retest of the 102.65 price level, the price would have to first break through the round number support of 103.
However, it would be foolish to rule out the possibility that the data surprises markets, with a higher-than-expected release. (Considering that energy prices traded higher in January)
Trade with Caution

U.S. stock market remains unchanged despite soaring CPI figures
U.S. stock market futures S&P and NASDAQ have not changed significantly.
The market predicted a fall in inflation compared to the previous month, but it showed an increase not only above the forecast but also compared to the previous month.

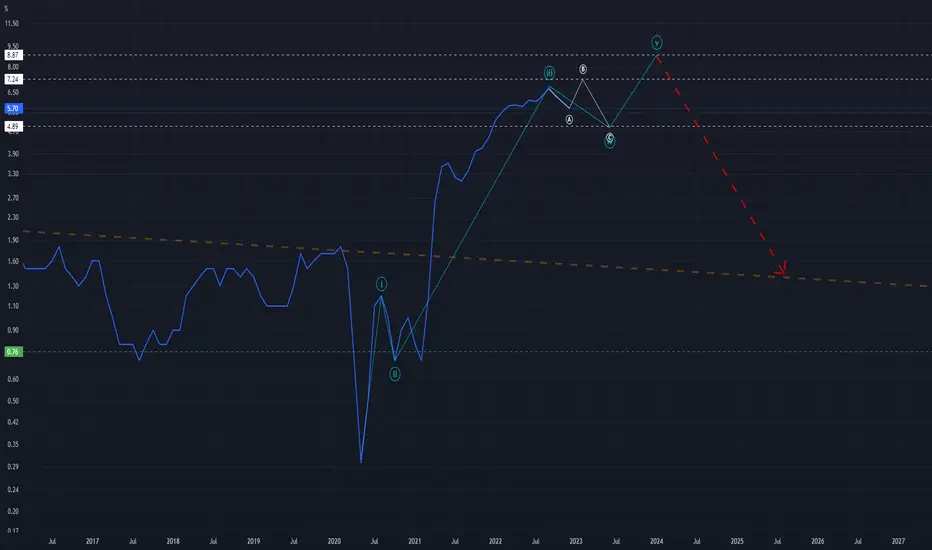
Elliott Wave Science Meets the Consumer Price IndexIt would be awesome if TradingView offered a candlestick chart for CPI but considering its only updated once per month, maybe the line graph/chart is the best option (not sure how that works). As for the data available to me, I've done a best effort markup using the science of Elliott Wave Theory. Considering the fluctuations seen on the M(onthly) chart, I believe its possible that CPI is sitting in the midst of a shallow Wave 4 correction. With this in mind, I find it possible that the number stretches into the low-mid 7.xx range between now and March. From there we may see a 2023 low within the 4.xx level.
I will share my thoughts here as I know there is much interest in "what will the CPI numbers be?"... Being that this CPI data is directly based on the actions of humans and the habits that we act on, it should work pretty well with Elliott Wave Theory. I will keep this post fluid and apply analytical updates as monthly results are publicly announced.
Remember these three important things: 1) trade the chart instead of the news and 2) stay safe /3) don't drown!
Plan for XAUUSD with CPI AnnouncementOANDA:XAUUSD
Gold has been trading in the range since last Friday (10th February 2023). It is clear that speculators and investors are waiting for something: maybe some economic indicators like CPI will decide the movement of Gold by today (14th February 2023)
Within the 1H timeframe, It is clear that gold has a strong chance of continuing its downtrend if it breaks below the trading range of 1850-1865 with the the following key support levels:
1st Support at: 1835
2nd Support at: 1825
Key Support at: 1800
On the contrary in a bigger picture of Day timeframe, Gold can still push for another leg upward as the price action has slowed the downward movement. If CPI number comes out in favor of Gold then it has a chance of testing the following key resistance when it breaks the range between 1850-1865 upward:
1st Resistance at: 1880
2nd Resistance at: 1885
Key Resistance at: 1900
The most importance part of all; Place a trade where the Risk to Reward favors in the direction that you choose!!!

VIX Is Ready To PartyThe VIX looks like its ready to party ahead of today's CPI print.
It recently touched the upward moving monthly trendline and my guess is it moves into the mid to upper twenties short term.

AMD: SUPPLY & DEMAND / MARKET MOVER / FORTY-FIVE MADESCRIPTION: In the chart above I have provided a MACRO to SEMI-MICRO analysis of AMD's price action. With a large amount of history backing AMD's price action and overall impact on economic factor I would personally consider AMD to be a MARKET MOVER.
POINTS:
1. MACRO Deviation: 13.75, SEMI-MICRO Deviation: 6.8
2. Current Uptrend Channel
3. WATCH 45 MA SINCE THE START OF BEAR MARKET THIS IS THE SECOND TIME THE 45 MA RISES ABOVE THE 200 MA.
4. WIDER UPTREND CHANNEL has developed.
IMPORTANT: IF PRICE ACTION FALLS BELOW 82.50 FURTHER DOWNWARD MOMENTUM CAN THEN BE ON THE WAY.
SCENARIO BEARISH: Current RSI & MACD levels falls in tandem with overbought territory being shown where current price action stands in NEW CHANNEL. Watch for loss of 82.50 if this is the case it is crucial 68.75 does not break because this can signify an opening for a new downtrend channel.
SCENARIO BULLISH: IF 82.50 is lost watch for strong bounce on 75.63 to PRESERVE BULLISH MOMENTUM OF MA's.
FULL CHART LINK: www.tradingview.com
NASDAQ:AMD

NZ dollar surges, eyes inflation expectationsThe New Zealand dollar has started the week in positive territory. In the North American session, NZD/USD is trading at 0.6357, up 0.76%.
It has been a long break for the Reserve Bank of New Zealand, which last met in November. At the meeting, the central bank delivered a record 75-basis point hike, bringing the cash rate to 4.25%. The rate statement noted that the cash rate would have to rise higher and faster than previously expected in order to curb inflation. The RBNZ holds its next meeting on Feb. 22, with inflation now falling in most major economies. This makes Tuesday's Inflation Expectations release critical, as it is the final tier-1 release ahead of the rate meeting. Inflation Expectations rose to 3.6% in Q4, up from 3.0% in Q1 and the RBNZ will be watching closely, as the reading could signal in which direction inflation is headed. This could mean significant volatility for the New Zealand dollar after this release.
Inflation will also be the buzz-word on Tuesday in the US, with the release of the January inflation report. Inflation is projected to fall to 6.2%, down from 6.5%, but there is unease in the markets that inflation could be hotter than expected, as used car prices and energy prices climbed higher in January. If inflation is indeed higher than expected, the markets could fully price in two rate hikes of 25 basis points and remain uncertain about a third hike. This would be a huge shift from recent market thinking, which is that the Fed could hold rates after a 25-bp hike in March and cut rates late in the year. The US dollar has taken strong hits after recent inflation releases were softer than the forecast. If tomorrow's release is higher than expected, it could be payback time and the US dollar could post gains.
0.6375 is under pressure in resistance. Above, there is resistance at 0.6442
There is support at 0.6323 and 0.6256

BITCOIN showing some Bullish Divergence on the 3 HRBTC holding above $21500 (On the Edge! Just had a wik down to $21455!), looks to be some Bullish Divergence...
It shows Divergence all the way up to about the 12 HR (Tiny one) and the daily (Micro one) LOL!
Looking for a move tomorrow with the Inflation numbers.
Can we get some Valentines Day love to the upside? We'll see... <---
Lots of Negative talk all over News & social so it may start making a move in the opposite direction.
This is what happens when there is too much Hype for one direction IMO.
Good Luck Out There!

FOREX/EQUITIES/COMMODITIES UPDATE!Hi Snipers,
Please refer to the recording for the next price levels and scenarios.
Thanks
MS

CRYPTO MARKET UPDATE! WHAT TO EXPECT THIS WEEK?Hi Snipers,
Please refer to the recording for the next price levels and scenarios.
Thanks
MS

Break Down: Analysis of The DXY, EURUSD, GBPUSD, US100 & MoreIn this video, we'll take a closer look at the charts we covered in our last live session, updating and explaining our analysis. Our focus will be on the following currency pairs: DXY, EURUSD, GBPUSD, NZDUSD, AUDUSD, EURCAD, and US100.
We're currently seeing a lot of potential for dollar strength, but it's important to keep an eye on the upcoming CPI release on Tuesday, as it could create some volatility in the markets. As a simple rule of thumb, when inflation is up, the dollar tends to strengthen, and when inflation is down, the dollar tends to weaken. However, it's not always that simple, and it's important to pay attention to the details.
When evaluating the CPI data, consider the following: how much it beat or missed the estimate, whether there is mixed data, if the data was as expected, and any revisions to the previous numbers. Additionally, pay attention to the rhetoric of central bank members after the release, as this can also impact market sentiment.
Our analysis of the downside trades is closely tied to the inflation data release. A strong beat in inflation would likely result in successful trades. However, a significant miss in the data could invalidate many of these trades.
If you're currently not in any trades, it may be wise to wait until after the CPI release. While it's tempting to try and get ahead of the market by positioning yourself, the risk of getting caught in a ranging market before the event could result in significant losses. It may be better to wait for a clearer direction after the release.
Join us as we navigate through these charts and look for possible trades in the market. Let's stay vigilant and make informed decisions.

Potential Bearish Run On Nasdaq For CPI On 14th February 2023Would like to see price show signs of weakness and tap into the H4 supply and fair value gap before giving us a lower timeframe shift in market structure to confirm our short bias. Should CPI inflation report come in hotter than expected, we will definitely see the markets react negatively to this. This will also be good basis for our short position as it aligns with technicals.

DXY possible breakoutThe DXY is on watch for an hourly breakout.
This is coming on the back of China inflationary numbers.
2.1% YOY inflation
0.8% MOM inflation.
The Month over month came in slightly hotter than expected which could be signaling maybe a hotter US CPI next week.
The China Reopening may be the cause of this.

CRYPTO MARKET UPDATE!! SELLERS ATTEMPT TO PUSH THE MARKET! Hi Snipers,
Please refer to the recording for the next price levels and scenarios.
Thanks
MS
