INFY 1H Chart Analysis (Bullish Bat + Falling Wedge)NSE:INFY
INFY 1H Chart Analysis (Bullish Bat + Falling Wedge)
In this 1-hour chart of Infosys Ltd (NSE: INFY), a Bullish Bat Harmonic Pattern has completed at point D, suggesting a potential reversal zone. Additionally, a falling wedge formation adds to the bullish confluence.
1. Pattern Structure:
The chart displays a complete Bullish Bat Pattern (X-A-B-C-D).
Point D aligns with the PRZ (Potential Reversal Zone), with a CD leg extending \~1.618 of BC, supporting a bullish reversal.
2. Falling Wedge Pattern;
A falling wedge, generally a bullish pattern, has formed from point C to D.
A breakout above the wedge trendline may confirm a bullish move.
3. Price Action:
The price is testing the upper boundary of the wedge.
Buying interest is visible at the P,R,Z near ₹1,540–₹1,545.
Trade Plan:
Buy Entry: Above ₹1,555 (confirmation breakout above wedge)
Stop Loss: Below ₹1,538 (beneath point D and wedge support)
Target 1: ₹1,568 (previous resistance)
Target 2: ₹1,611 (mid-term resistance)
Target 3: ₹1,631 (major swing high)
A strong bullish confluence exists with the harmonic pattern and falling wedge. Wait for confirmation above ₹1,555 before entering. Maintain proper risk-reward with a stop below ₹1,538.
NSE:INFY NSE:NIFTY NSE:CNXIT
INFY

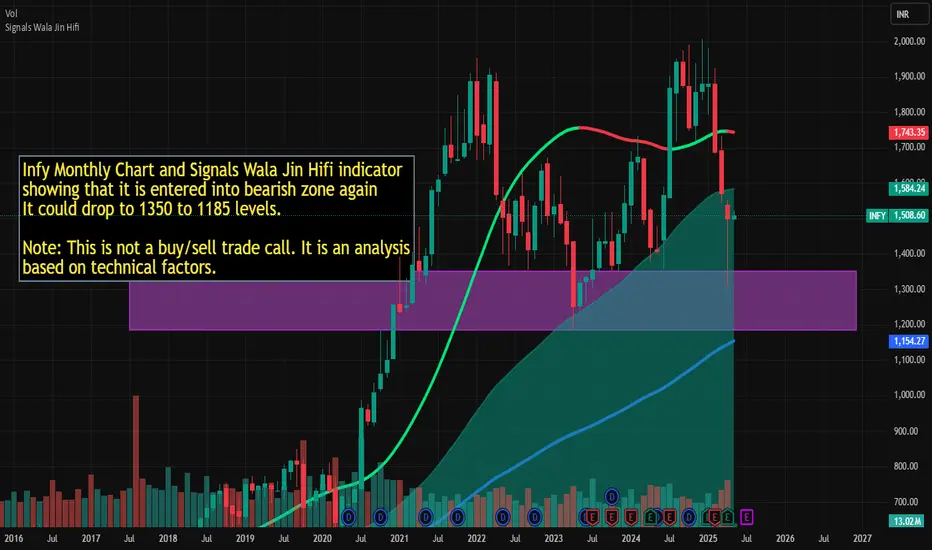
Infy could drop to 1350 to 1185 levels. Infy Monthly Chart and Signals Wala Jin Hifi indicator showing that it is entered into bearish zone again
It could drop to 1350 to 1185 levels.
Note: This is not a buy/sell trade call. It is an analysis based on technical factors.
INFY - Infosys Ltd (2 hours chart, NSE) - Long PositionINFY - Infosys Ltd (2 hours chart, NSE) - Long Position; short-term research idea.
Risk assessment: Medium {volume & support structure integrity risk}
Risk/Reward ratio ~ 2.83
Current Market Price (CMP) ~ 1480
Entry limit ~ 1455 to 1435 (Avg. - 1445) on April 28, 2025
1. Target limit ~ 1485 (+2.77%; +40 points)
2. Target limit ~ 1530 (+5.88%; +85 points)
Stop order limit ~ 1415 (-2.08%; -30 points)
Disclaimer: Investments in securities markets are subject to market risks. All information presented in this group is strictly for reference and personal study purposes only and is not a recommendation and/or a solicitation to act upon under any interpretation of the letter.
LEGEND:
{curly brackets} = observation notes
= important updates
(parentheses) = information details
~ tilde/approximation = variable value
-hyphen = fixed value

Review and plan for 21st April 2025Nifty future and banknifty future analysis and intraday plan in kannada.
Quarterly results.
This video is for information/education purpose only. you are 100% responsible for any actions you take by reading/viewing this post.
please consult your financial advisor before taking any action.
----Vinaykumar hiremath, CMT

Infosys Vs Nifty IT The markings on the chart are based on the Elliott Wave theory.
The IT index has lagged in strength over the last 1+ year and now seem to enter the next wave C down. While the index made a new high, the internal moves are corrective and divergent on the RSI which makes it a better wave (B) candidate.
The next few weeks should be a sharp fall in the IT stocks as wave (c) tend to be quick and less time taking.

INFY IS NEAR A BREAKOUT | MID-TERM INVESTMENT STOCKInfty is breaking out it's long term resistance and look good above 2010 for 2260, 2420 and 2720 until 1700 is intact on the downside.
To motivate us, Please like the idea If you agree with the analysis.
Happy Trading!
InvestPro India

Infosys !! Head & Shoulder Pattern on Monthly chartInfosys !! Head & Shoulder Pattern on Monthly chart
if it breaks this with good volume possible upside target is 2661.
Disclaimer : View is just for educational purpose. Do your own analysis before taking any trade

bearish flag pattern - INFY (Infosys)The chart for Infosys (INFY) displays a bearish flag pattern, suggesting a potential downward movement in the near term. Based on the current setup, the stock appears likely to reach the support level around 1725.

#INFY; Multi-Year Breakout#INFY; Multi-Year Breakout, Results may add fuel to achieve the upside target - 2085.
Backed by strong Fundamentals, worth a review!

INFY Breakout Alert: Don't miss this moveInfosys Ltd $NSE:INFYis currently forming a bullish flag pattern on its chart, characterized by a sharp upward movement (flagpole) followed by a period of consolidation in a narrow range (flag). This pattern typically indicates a continuation of the previous uptrend. Given the strong fundamentals and recent positive sentiment around the stock, a breakout from this consolidation phase could lead to a significant upward move. Technical analysis suggests that INFY could potentially rise by 5-7% in a couple of weeks as it resumes its upward trajectory.
Don't miss this opportunity. The move can be very quick as it approaches the results announcement date.📈🚀

INFYHi guys,
In this chart i Found a Demand Zone in INFY CHART for Positional entry,
Observed these Levels based on price action and Demand & Supply.
*Don't Take any trades based on this Picture.
... because this chart is for educational purpose only not for Buy or Sell Recommendation..
Thank you

Elliott Wave Analysis of Infosys MonthlyElliott Wave Analysis Overview:
1. Primary Degree Wave 1 (Completed in March 2000):
Price Level: 218
The first primary degree wave, which marked the beginning of a larger uptrend, concluded at the price level of 218.
2. Primary Degree Wave 2 (Completed in September 2001):
Price Level: 33
The corrective wave 2 retraced the gains of wave 1, with the price dropping to 33 before setting the stage for the next uptrend.
3. Intermediate Degree Wave 1 (Completed in January 2002):
Price Level: 76
This wave, part of the larger primary degree uptrend, reached a high of 76.
4. Intermediate Degree Wave 2 (Completed in April 2003):
Price Level: 36
The second intermediate degree wave provided a correction, retracing the advance of wave 1 and concluding at a price of 36.
5. Intermediate Degree Wave 3 (Completed in December 2021):
Price Level: 1953
Wave 3, characterized by its strong momentum, concluded at 1953, marking a significant uptrend in the stock's price.
6. Intermediate Degree Wave 4 (Completed in April 2023):
Price Level: 1185
The corrective wave 4 retraced some of the gains from wave 3, with the price level dropping to 1185.
7. Current Wave Analysis:
Wave 5 of Intermediate Degree:
The ongoing wave 5 of the intermediate degree is in progress.
Target Price for Wave 5: 2380
This wave is expected to complete the intermediate degree cycle and also mark the conclusion of wave 3 at the primary degree.
Summary:
Infosys has undergone a series of significant Elliott Wave patterns since the completion of its primary degree wave 1 in March 2000. The analysis suggests that the ongoing intermediate degree wave 5 could potentially reach a target price of 2380. This target also aligns with the conclusion of the primary degree wave 3. Investors should monitor the price action closely to confirm the completion of wave 5 and assess the potential implications for future waves.
Note: As with any technical analysis, this interpretation is subject to change based on new market data and evolving conditions.
Disclaimer: This analysis is based on historical price data and Elliott Wave principles. Market conditions and price movements can be highly unpredictable. The information provided is for educational purposes only and should not be construed as financial advice. Always conduct your own research or consult with a professional financial advisor before making investment decisions.

INFY: Bull Ride Begins! Breakout Signals Strong Uptrend
Breakout Level: Above ₹1,951.30 - Confirmed
Support Level: Previous resistance at ₹1,902.55 now acting as strong support
Trend: Ascending trend line indicating continued upward momentum
Action: Monitor closely as the stock shows strong bullish signs

INFOSYS trading analysisInfosys the IT giant of India is going to form a reverse cup with handle chart pattern. The company although giving consistent profits has not formed a new high in the previous 2.5 years. Now after forming this chart pattern it may break its previous high. The buy point is 1910 an selling point is 2500. This will give a 31% return. The stock will achieve this target before 2025 Diwali giving a 30% return in approximately 15-16 months.
Hope you like my analysis.
Please do your own analysis before investing.
Do like and follow and share among your friends and family.
Thank you.

INFY Breakout: Riding the Strong UptrendJoining the uptrend wave as NYSE:INFY breaks out of its February 2024 range. Time to capitalize on this momentum!

profit booking in INFY should start now
After almost 28% run-up, we can expect some profit booking in INFY. I think we should book profit at current level and wait for retracements for re-entry.

#NIITLTD 113 TGT 130 #Coforge #MIT #FII #DII #stocks #tradingNIITLTD 113
TGT 130
TF < 3M
NSE:NIITLTD
If you like my work KINDLY LIKE SHARE & FOLLOW this page for free Stock Recommendations. With 💚 from Rachit Sethia

NIFTY IT | Updated Price Action- Here is an update to the Nifty IT analysis we posted back in 2022.
- The price action is pretty sluggish. Literally "Trading in the Zone" ( Get it? If not you need to read that book " Trading in the Zone by Douglas" It will teach you the psychology aspect of trading)
- We will keep updating the price action as it unfolds.
- In the meantime, look at how NDX has performed post our analysis.
What are your thoughts? Feel free to comment. If it helped, Do Leave us a boost 🚀
Disclaimer: We are not registered advisors. The views expressed here are solely personal opinions. Irrespective of the language used, Nothing mentioned here should be considered as advice or recommendation. Please consult with your financial advisors before making any investment decisions. We like everybody else, have the right to be wrong :)

INFY ASCENDING TRIANGLE IDENTIFIEDINFY has formed an ascending triangle pattern on the hourly chart. A bullish candle has closed just above the resistance level, indicating potential upward movement. However, for a confirmed bullish trend, we await a clear breakout above the resistance. It's essential to note that a bearish breakout would invalidate this bullish projection, emphasizing the need for cautious observation.

smaller target may get executed....Pls go through the chart and see if you through a ball from your rooftop to the ground floor it at least bounce to half of first floor...! that's the retracement....hoping for that only.

Buy Infy
Infy touched it's outer bound and giving goos by signal. I plan to buy it if it goes up tomorrow. If it i sin red tomorrow, we will wait for it to go up by at least 2 days before taking long position.

Infosys !! Seems Bears are exhaustedToday Infy broke high of two red endulf candles which indicates bullishness in chart

India: IT Consultancy Industry chartThe trend was broken on 2nd March. I'm bearish on the IT Consultancy Industry going forward.
Note:
This is a custom index formed by equally weighing Large Cap IT consultancy stocks.
Relative Momentum (w.r.t. Nifty) indicator has been applied on the same.
Stocks considered for the index:
TCS
INFY
HCLTECH
WIPRO
LTIM
TECHM
TATAELXSI
LTTS
PERSISTENT
MPHASIS
