INFOSYS BEFORE RESULTSA datailed recovery wave analysis on INFOSYS shows that, all the goods are digested by the market
Now more shorts(1500CE) are developing and low volume with rise in price is a trap for retailers
Its over one year to take some profits on hand by the smart investers. Don't you understand what's the hell is gonna happen?
INFY

infosys ltdmarket is running over and over pick level. thats why market not gonna be correction more then last low.

Good industry leader worth lookingI really like the techniclas of NSE:INFY , it has done three breakouts with good volumen and it stayed strong during the market correction. The price is above its key MAs, is in the list of 52-week highs in Barchart and is ranked 4th in its industry by Investors Business Daily with a relative strengh rating of 81.
I mean is almost too perfect to be true so, I checked its quarterly revenues in Reuters and from 12/2019 to 03/2020 had +0.86%, from 03/2020 to 06/2020 was +1.72%, from 06/2020 to 09/2020 was +3.81% and from 09/2020 to 12/2020 was +5.71%. Its growth is growing, that's a really good sign.
Yesterday did a breakout of a third base so it may not be in its early stages but I think its worth to look at.


Infy Elliot wave analysisInfy Short for short term till 1200 from 1351-54 range. Wave counts are given


#INFY set for all time high with Double Bottom Breakout#INFY is set for all time high with Double Bottom Breakout and Bullish Signal on MACD on the daily chart. On fundamental side, the IT major has just won a $500 million all-digital deal from Google.


INFOSYS LTD - Triangle breakout - possible Double bottomINFOSYS LTD
Triangle Breakout
possible Double bottom formation
Targets in Green


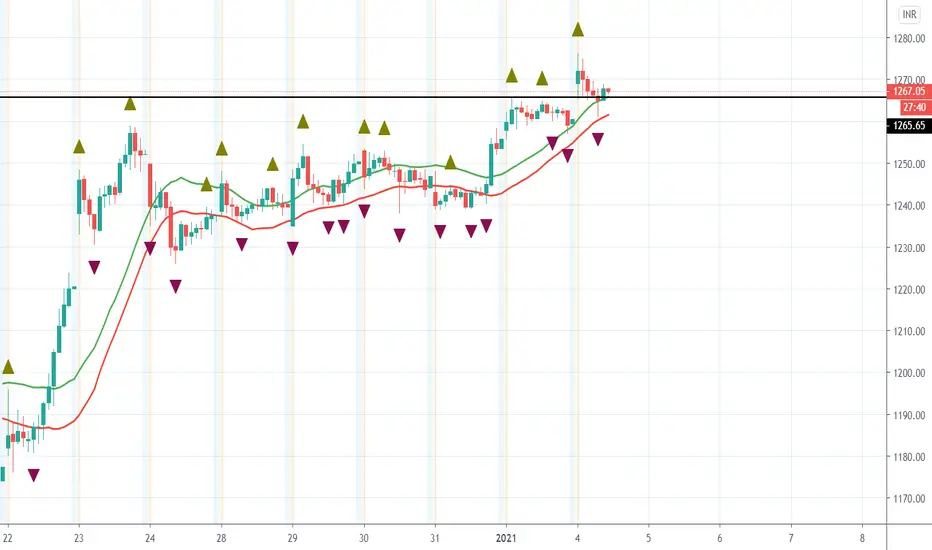
Trade Set up 1267.60 is the level below it short for at least 15 points. If you have missed you can average it at 1267.60 if comes for a retest. keep SL as per your target like if capturing 15 points profit keep SL of at least 15 points.


IT STOCKS - Start of another leg of bull rally? - ANALYSISThe analysis is done purely based on chart patterns and price action.
The analysis is done on 15 min TF, but the target as shown in charts can take couple of days upto weeks.
As can be seen from NITFY IT chart as well as from charts of stocks linked below, price went for retracement phase, made a low on 21st December 2020 and then gave breakout from trendline.
Thereafter the price gave good breakout and came down to retest the levels.
This can be a signal another leg of bull rally.
Targets are determined with the help of Trend-Based Fib extension tool.
Traders must check for signals of reversal before entering into any trade.
This analysis is just for study purpose and to show beginners how to analyse a sector and its stocks.
This is not a trade recommendation. Traders must trade with their own risk and money management.
TCS chart analysis-
INFY Chart analysis -
WIPRO chart analysis -
HCLTECH chart analysis -
Feel free to comment for any suggestion or query regarding price action or chart analysis.

Infy Buy - Long CallStock breaking down word trendline on hourly chart. To limit the risk one can go for bull spread.

INFY EW wave counts with HarmonicsSee how nicely Harmonics and EW waves work togther.
We can find high probable setups with these tools.
Right now Wave 4 is in progress and i am expecting one impulse leg further to complete the strcuture. We need to see how the waves are emerging and then attempt to count them using corrective waves pattern.


INFY Profit booking zone No short yetRight now the question is where is wave 3 top
I have just show WAVE 4 as a ref only not per FIB levels.
However Wave 3 top and harmonic pattern confluence lead me to belive wave 3 top is somehwere between 1400 to 1450

Trade Set up BUY if the price sustains above 1265.50. target 1 1275 rest trail the SL. 1265.50 is a good support
INFYI'm not an expert I'm just sharing my views on INFY for next trading day
I'm not responsible for any profit or loss this is not a recommendation.

INFY - Ascending Triangle + Bull Flag - Swing/Short termThe above analysis is based purely on price action & chart patterns.
The analysis is done on 60 min TF, hence it may take price to reach the targets in few days to few weeks.
Trade setup along with Entry range + SL & Targets are given in image itself.
Traders must do their own study before entering into any trade. They must trade with their own money & risk management.
Feel Free to comment for any suggestion or query regarding price action analysis.


INFY-setup for 16Dec 2020.the setup is valid for 16Dec 2020 only. the overall trend is bullish, if candle closes above the green line we can take a trade.
note:the BO candle wick should not be more than 25% of the body

Nifty it index viewNifty it index given upside break out after a correction.
Many stocks like Tcs, Mindtree, Infy, Techm and other stocks also given break out or ready to break out. Buy on dip simple.
