Long-Term Spot Technical Analysis of INJ CoinWhen evaluating INJ coin for long-term spot investments, it is evident that the price continues its downward movement after being rejected from the daily resistance level at $16.33. If INJ fails to receive a strong buying reaction from the $13.16 support in the coming days, the downtrend is likely to persist.
Our preferred long-term spot entry zone lies between the $11.86 – $11.26 support range. If INJ retraces to the blue support zone marked on the chart, we intend to accumulate with a long-term target of $23.
As long as INJ continues to close daily candles above the $10 level, we will maintain our long-term spot positions. Should the price rebound from the $11.86 – $11.26 zone, our initial upside target will be $16.33.
Not Financial Advice (NFA).
Injectiveprotocol

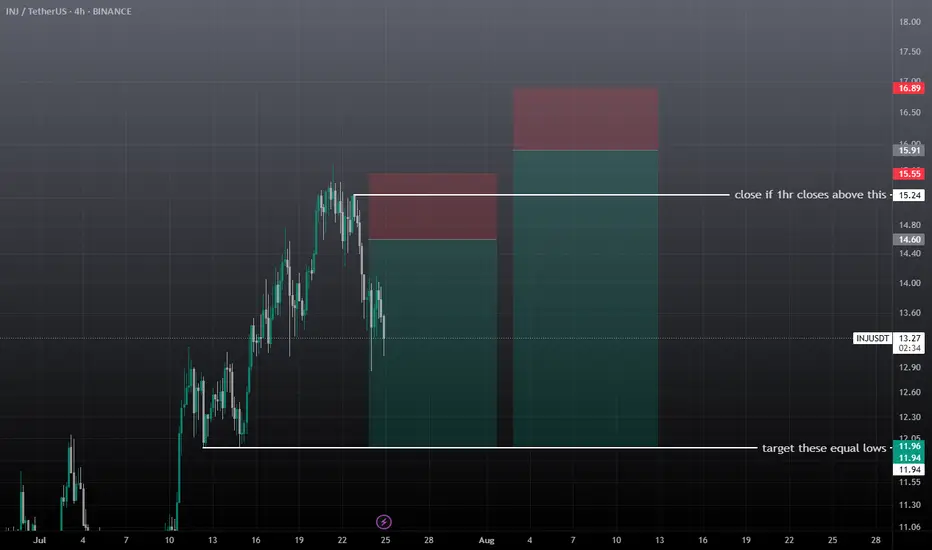
inj swing short setupWait for the entry, don't take it at current market price, entry can take time. There are two short setups forming on injusdt, after achieving the first entry if 1hr closes above the mentioned zone then close trade before sl, and then take the 2nd short setup, if tp achieves first then don't take the trade wait for the new setup.
TradeCityPro | INJ Battles Key Resistance Amid Altseason Buzz👋 Welcome to TradeCity Pro!
In this analysis, I want to review the INJ coin for you. It’s one of the RWA and AI projects, currently ranked 63 on CoinMarketCap with a market cap of $1.51 billion.
📅 Daily Timeframe
On the daily timeframe, after a drop to the 6.94 level, this coin has bounced back and is now moving upward along with a rising trendline.
✨ A strong support has formed at 10.28, and after price reacted to this level, a new bullish leg started and pushed the price up to 16.04.
🔔 There is a Maker Seller zone around 16.04 that has repeatedly prevented the continuation of the upward move, and currently price is struggling with it again.
📈 Breaking this zone will initiate a new phase of the trend. I plan to have a long position open if 16.04 is broken.
🛒 This trigger is also suitable for spot buying, and if Bitcoin pair and Bitcoin dominance confirm the move, we can consider buying in spot too. But personally, I prefer opening a futures position.
💥 Breaking the 72.87 zone on the RSI will be a solid confirmation for the entry of bullish momentum, and with this breakout, a new bullish leg can begin.
🔽 If a correction happens, I will wait for the trendline to break and will not open a short position for now.
Currently, the first trigger we have for a short is at 10.28.
📝 Final Thoughts
This analysis reflects our opinions and is not financial advice.
Share your thoughts in the comments, and don’t forget to share this analysis with your friends! ❤️

INJUSDT Bulls Are Back! All-Time High Could Be Next!
BINANCE:INJUSDT has shown a strong and clean bounce from a major support zone, indicating that buyers are stepping in aggressively at lower levels. This bounce reinforces the strength of the current uptrend and reflects growing bullish sentiment.
At the moment, the price is facing a significant resistance level. This area has previously acted as a barrier, but with increasing volume and momentum, we expect BINANCE:INJUSDT to break out from this resistance and continue its upward move.
If the breakout occurs, our target is the previous all-time high, as there is limited resistance above the current zone. This presents a high-reward opportunity for traders looking for breakout setups.
As always, managing risk is key. Use a well-placed stop loss below the support level to protect your capital. Breakouts can be explosive, but discipline and proper risk management make all the difference.
BINANCE:INJUSDT Currently trading at $14.4
Buy level : Above $14.5
Stop loss : Below $11
Target 1: $20
Target 2: $35
Target 3: $40
Target 4: $53
Max leverage 2x
Always keep stop loss
Follow Our Tradingview Account for More Technical Analysis Updates, | Like, Share and Comment Your thoughts
inj buy long setup, scalp intraday setupTake it tension free sl is very tigh, wick below the sl doesn't matter candle closed then setup is invalid. If tp hits without filling entry then setup is not valid

inj swing trade setupInj has broken downside, expecting more downfall before any leg up, wait for the entries to be filled, these are swing trades based on 1 day TF, so here wick doesn't matter wait for the closing, you can hold them without SL if entry achieved, take 1st entry on mentioned points 2nd entry below SL, and then wait for the closing, IF any entry achieved and candle closed above the short then wait for the pullback and close on entry points if long entry achieved then hold the trade 2nd entry take from previous wick low and wait for the tp this leg down will be the final shakeout before any major move. That's why giving you some short entries. BTC will take a final leg down sooner or later, then Boom your alt season starts.

INJ Head & Shoulders patternINJ Analysis:
Injective (INJ) is nearing the completion of a right shoulder in a potential chart pattern, with a double bottom forming below, indicating a strong liquidity level. There’s also a high-probability demand zone right after that liquidity level, so i can expect that institucional buyers are looking for that levels for an entry to start the next big leg up.
Short term Sell idea with target ending in a Long term buying idea.
BTC Outlook & Altcoin Impact:
I expect Bitcoin (BTC) to climb to around $96,000 before its next major upward move. If this happens, it supports the idea that some altcoins, like INJ, may dip to capture untapped liquidity at lower levels before rallying.

INJ/USD Bullish Heist: Crack the Vault & Grab the Loot!Ultimate INJ/USD Heist Plan: Snag Profits with the Thief Trading Strategy! 🚀💰
🌍 Greetings, Wealth Raiders! Ciao, Hello, Bonjour, Hola! 🌟
Fellow profit hunters, get ready to crack the INJ/USD "Injective vs U.S Dollar" Forex vault with our slick Thief Trading Strategy! 🤑💸 This plan blends razor-sharp technicals and fundamentals to loot the market. Follow the chart’s long-entry blueprint to strike at high-risk zones like the Yellow Moving Average Zone. It’s a wild ride—overbought conditions, consolidation, and potential trend reversals mean bears are lurking! 🐻 Stay sharp, grab your profits, and treat yourself—you’ve earned it! 🎉💪.
📈 Entry: Storm the Vault!
"The heist is on! Wait for the breakout (14.700) then make your move - Bullish profits await!"
The market’s ripe for a bullish grab! 💥 Place buy limit orders within the most recent 15 or 30-minute swing low/high levels. Set alerts on your chart to stay locked in. 🔔
🛑 Stop Loss: Guard Your Loot!
Set your Thief SL at the nearest swing low or candle wick. on the 8H timeframe for day/swing trades. Adjust based on your risk tolerance, lot size, and number of orders. Safety first! 🔒
🎯 Targets: Claim Your Prize!
🏴☠️ Short-Term Target: 15.700
👀 Scalpers, Listen Up!
Stick to long-side scalps. Got deep pockets? Jump in now! Otherwise, join swing traders for the heist. Use trailing stop-loss to lock in gains and protect your stash. 💰
🐂 Why INJ/USD is Hot!
The "Injective vs U.S Dollar" bullish surge is fueled by key fundamentals. Dive into Macro, COT Reports, On Chain Analysis, Sentiment outlook, Intermarket trends, and future targets via the linkss below for the full scoop. 👉🔗. Stay informed to stay ahead! 📰
⚠️ Trading Alert: News & Position Management
News releases can shake the market like a heist gone wrong! 🗞️ To protect your profits:
🚫 Avoid new trades during news events.
🛡️ Use trailing stops to secure running positions.
💥 Boost the Heist!
Hit the Boost Button to supercharge our Thief Trading Strategy! 💪 Every click strengthens our crew, making it easier to swipe profits daily. Join the squad, trade smart, and let’s make money rain! 🌧️💵

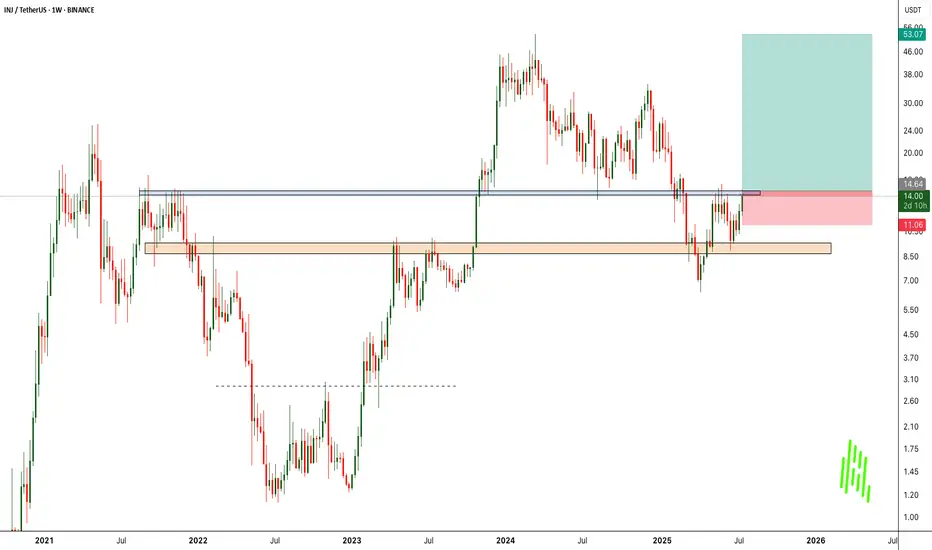
$INJ on WeeklyThe asset bounced within the Demand zone on the Weekly, creating room for a possible rally up to the $20-25 area.
Volatility is still open but with steadily decreasing bearish pressure.
A Daily FVG overlaps with the Weekly FVG so as to create possible room for maneuver.
The widely used RSI has broken the barrier of a bearish trendline that has lasted since December 2023. Whether it maintains the trajectory will only be seen at the close of this week.
Funding rates positive.
Open Interests slightly up.
Detail not to be overlooked in the coming days: the market cap line is rising, but the price is lagging slightly. Positive sign.
Stable volume, with an improvement in the last two days. Very mild data.
With the whole crypto sector seemingly showing signs of life, I am confident of its uptrend.
Remember: until proven otherwise.

TradeCityPro | INJUSDT Best Position Among Altcoins! 👋 Welcome to TradeCityPro Channel!
Let’s dive in and analyze one of my favorite coins in the cryptocurrency space, INJ, which is showing strong potential. We’ll check the new entry triggers together.
🌐 Overview Bitcoin
Before starting the analysis, I want to remind you again that we moved the Bitcoin analysis section from the analysis section to a separate analysis at your request, so that we can discuss the status of Bitcoin in more detail every day and analyze its charts and dominances together.
This is the general analysis of Bitcoin dominance, which we promised you in the analysis to analyze separately and analyze it for you in longer time frames.
📊 Weekly Time Frame
On the weekly time frame, I see that the seventh period is stable, INJ, and compared to the majority of altcoins that have their own low price levels, it is in a better space and is engaged in its own supports!
After breaking the primary trend ceiling, namely 9.28, we experienced a sharp upward movement and formed a historical ceiling at $53, and after forming a distribution box and breaking the important floor of 16.20 and pulling back to it, we experienced a continued decline.
Currently, we’ve bounced from the key support at 6.54 and experienced a 90% move, which highlights the importance of this resistance. If we form a higher low above 6.54, the 13.54 trigger will be excellent for a spot buy, and I’ll personally add another buy position at that level.
📉 Daily Time Frame
On the daily time frame, our trend is completely bearish as you can see, and the events are completely accompanied by the formation of a downward bottom and top, but we are likely to suffer for a while.
After getting rejected from 34.16 and forming a box between 20.16 and 25.93 and losing the bottom, it made a move and then while pulling back with low volume and the next conversion to red, it became an inverted Sharpe, we experienced a decline!
After breaking the daily trendline and activating its trigger at 8.54, we saw a move and got stuck at the 10.32 resistance. After forming a higher low, we moved up to 13.76. Currently, the 13.76 trigger, and even better, 16.25, can serve as our futures long and spot long triggers, respectively. We’re still holding the position opened at 10.32.
✍️ Final Thoughts
Stay level headed, trade with precision, and let’s capitalize on the market’s top opportunities!
This is our analysis, not financial advice always do your own research.
What do you think? Share your ideas below and pass this along to friends! ❤️

Injective | INJ & AvalonThe price of Injective 8 dollar today with a 24hour trading volume of 69 million dollar. This represents a 13% price increase in the last 24 hours and a 29% price increase in the past 7 days. With a circulating supply of 80 Million INJ, Injective is valued at a market cap of 640 million dollar.
Injective is a blockchain built for finance. It is an open, interoperable layer1 blockchain powering next gen DeFi applications, including decentralized spot and derivatives exchanges, prediction markets, lending protocols..
Injective is upgrading its Avalon mainnet with overwhelming community support. The upgrade aims to enhance L1 scalability, achieve sub-second block generation time, and implement PoS delegation transformation.the upgrade will optimize transaction processing speed, network efficiency, and security within the Injective ecosystem
Inj price is up 400% since we posted the first analysis on January and it tries to recover as fast as possible. most indicators sending a buy signal and the volume looks strong too

INJUSDT - Monthly chart telling everything!A nice bounce occurred as soon as it touched the legendary support — the primary trendline and the grey zone.
Just look at the price behavior every time it approaches this rectangle.
You'll notice that, based on the Elliott Wave Impulse, Wave 4 has likely completed, and we’re now entering the final impulsive leg — "Wave 5"
$100 is a very modest target in the long term.
Best regards Ceciliones 🎯

INJ at Key Support – Will History Repeat?INJ/USDT Weekly Chart Analysis
INJ is currently trading at a crucial technical level, touching the strong rising support line of a long-term ascending channel. Historically, this trendline has acted as a reliable base for strong upward reversals.
The Stochastic RSI is also deeply oversold, similar to the levels seen during previous bottoms in early 2022 and early 2023 — both of which led to significant rallies.
If the support holds, INJ could be poised for another upward move toward the key resistance line of the channel.
However, a breakdown below this support would invalidate the structure and could lead to further downside.

TradeCityPro | INJ: Key Triggers Amid Downtrend and Volume Shift👋 Welcome to TradeCity Pro!
In this analysis, I want to review the INJ coin for you—one of the attractive crypto networks, which with a market cap of $783 million, is ranked 73rd on CoinMarketCap.
📅 Daily Time Frame
In the daily time frame, as you can see, we have a downtrend that started after the price was rejected from the 25.43 top, and after breaking 16.04, the main bearish leg of the price began and dropped down to the 6.94 zone.
🔽 This bearish move has followed a trendline that we can also observe in most altcoins. Currently, market volume is decreasing, and it can be said that the price is diverging from the volume—and if this divergence is activated, the price will reverse trend.
✔️ The first trigger for a trend reversal is the break of the trendline. Given the volume divergence, if this happens and the trendline breaks, we can consider the break of the 8.96 trigger as the main reversal confirmation.
📈 If the price stabilizes above the 8.96 zone, it can move upward and start an uptrend. The next resistance for the price would be 16.04. However, for a spot buy, the 25.43 trigger is the most important one, which the price is still far from.
💥 On the other hand, if the 6.94 zone is broken, the price will move downward and may start another bearish leg. But an important point is that there’s a very strong support at the 5.65 zone, and if the price moves downward, it may be supported by this area—so it's better to confirm the next bearish leg with a break of 5.65.
⏳ 4-Hour Time Frame
Let’s move on to the 4-hour time frame to examine suitable triggers for futures positions.
🧩 As you can see in the 4-hour time frame, there’s a descending channel in which the price is moving, and it is currently near the top of the channel.
🔼 For a long position, if the channel top is broken, we can enter a position with the activation of the 8.51 trigger. If the price tests this zone multiple times, the position can become much more reliable, and the possibility of a sharp bullish move increases.
📊 The important point is that buying volume should increase as the price moves toward 8.51, because for a trend reversal, volume must converge with price.
📉 For a short position, the first trigger is the break of the 7.61 zone, which is a good trigger because the price is being rejected from the channel top, and there is a possibility that the price moves toward the midline or bottom of the channel.
🎲 The main trigger for the short position is the break of 6.94, which is a very important low, and breaking this zone can lead to a sharp move down to the 5.65 zone.
📝 Final Thoughts
This analysis reflects our opinions and is not financial advice.
Share your thoughts in the comments, and don’t forget to share this analysis with your friends! ❤️

#INJ/USDT#INJ
The price is moving within a descending channel on the 1-hour frame, adhering well to it, and is heading towards a strong breakout and retest.
We are experiencing a rebound from the lower boundary of the descending channel, which is support at 7.20.
We are experiencing a downtrend on the RSI indicator, which is about to break and retest, supporting the upward trend.
We are heading for stability above the 100 Moving Average.
Entry price: 7.20
First target: 7.70
Second target: 8.15
Third target: 8.64


INJ | ALTCOINS | Bottom Likely CLOSEIn the previous cycle, INJ made a near full retracement after the bullish cycle.
This would put us round here, to which we are already fairly close:
To make it a little easier to reference, I'll use the Elliot wave tool (although these are not Elliot waves).
In short, the bottom is likely very close for INJ - but accumulation / sideways phase may take another while.
_______________________
BINANCE:INJUSDT

Injective Protocol to $100? Looks for a nice run upIt looks like the road to $100 for Injective Protocol is getting stronger and stronger.
After bouncing right off the 50% retracement, things finally look good for INJ to make a new expansion move higher.

Breaking: Injective Protocol ($INJ) Set For a Comeback The first and only blockchain built for finance that is open, interoperable layer-one blockchain powering next-generation finance applications, including DeFi, RWAs, AI, decentralized exchanges, prediction markets, lending protocols, and more, is set for a comeback with a speculated 140% surge in sight.
Weeks after Breaking down from a rising wedge which is a bearish pattern, CRYPTOCAP:INJ has shown signs of a reversal. With the Relative Strength Index (RSI) already oversold at 28 CRYPTOCAP:INJ is gearing up for a massive comeback with the All-time high of $52.75 a move to the $19 pivot point could spark the resurgence to the recent ATH attained.
Similarly, with growing momentum and the asset trading below key moving averages (MA) CRYPTOCAP:INJ is currently up by 3.41%. The Injective Protocol is becoming an asset worth watching.
Injective Price Live Data
The live Injective price today is $8.77 USD with a 24-hour trading volume of $166,682,991 USD. Injective is down 7.91% in the last 24 hours, with a live market cap of $867,892,886 USD. It has a circulating supply of 98,970,935 INJ coins and the max. supply is not available.

INJ Price Analysis: Key Zones & Reversal ScenariosHey everyone! 👋
Let's dive into this price chart and see what’s going on with INJ.
Overview:
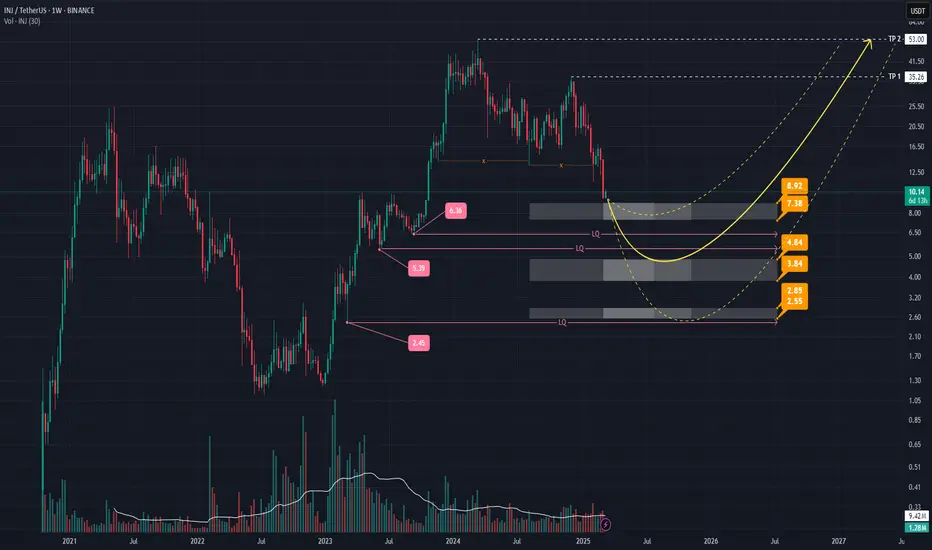
We’re looking at INJ on a weekly timeframe , and there are some interesting levels to watch. The chart shows **three key zones** where price reactions might happen, marked with price levels. There are also areas of liquidity (LQ) , where the market might make a move before reversing direction.
Potential Reversal Scenarios:
Three possible price movements are shown with yellow arrows , each representing a different way the price might reverse. The second arrow is the primary scenario, suggesting that after sweeping at least one liquidity level, the price could bounce back up—especially if there’s solid volume and a strong candlestick pattern.
- Main Support Zone (3.84 - 4.84): This area is the most important. If the price reaches this zone and shows good volume and a strong candlestick pattern, it could signal a trend change.
- Other Support Zones (2.55 - 2.85 and 7.38 - 8.92): These are additional key levels. A drop below these could change the outlook.
Take Profit (TP) Targets:
TP levels are marked on the chart. If the price reverses as expected, these targets may be reached.
Final Thoughts:
Nothing in crypto is guaranteed! Always look for confirmations like volume and candlestick patterns before making decisions. Stay informed, trade smart, and always do your own research! 📊💡
#INJ/USDT#INJ
The price is moving in a descending channel on the 1-hour frame and is adhering to it well and is heading to break it upwards strongly, and retest it
We have a rebound from the lower limit of the descending channel, this support is at a price of 12.
We have a downtrend on the RSI indicator that is about to break and retest, which supports the rise
We have a trend to stabilize above the moving average 100
Entry price 14.60
First target 15.57
Second target 16.77
Third target 18.22


INJUSDTINJUSDT is showing good structural shift.
As the market is broke through the minor bearish structure and also break the descending trendline.
A moving average cross over also showing the good movement to the upside. If it sustains the local support of 19 then the upside target could be 26.
