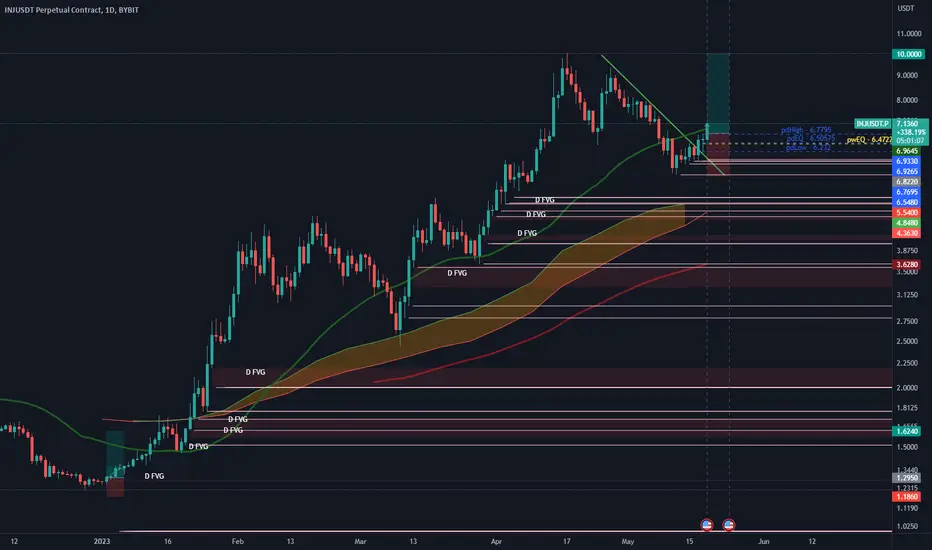
INJUSDT(Injective) Daily tf Range Updated till 20-05-23INJUSDT(Injective) Daily timeframe range. the range of this alt is pretty insane, it comes with potential of both insane gain and risk. its trying to retest at #7.700 breaking above open up space till #10.620. if not than back to #4.944.
INJUSDT

inj long setup Hello Traders, here is the full analysis for this pair, let me know in the comment section below if you have any questions, the entry will be taken only if all rules of the strategies will be satisfied. I suggest you keep this pair on your watchlist and see if the rules of your strategy are satisfied. Please also refer to the Important Risk Notice linked below.
INJ warming up, ready for breakoutLadies and gentlemen, we have an exciting development in the world of cryptocurrencies as INJ (Injective Protocol) starts to warm up and appears to be gearing up for a potential upside move. This digital asset, known for its innovative approach to decentralized finance (DeFi), has caught the attention of investors looking to capitalize on the next big opportunity. INJ has been simmering beneath the surface, consolidating its gains and building a solid foundation for what could be a significant breakout. The price action has shown signs of accumulation, with higher lows forming, indicating increased buying interest and potential bullish sentiment in the market. While nothing is guaranteed in the ever-changing world of cryptocurrencies, the stars seem to be aligning for INJ, presenting a compelling opportunity for those willing to seize the moment. So, keep a close eye on INJ as it continues to warm up, for it might just be on the cusp of an exhilarating upside move that could reward astute investors. As always, in the world of digital assets, caution and thorough research should guide one's investment decisions.

Inj Looks bullish Here Seems Like Ready For Upside Continuation Descending Broadening Wedge Breakout & retest Has already done Expecting 35 to 40% bullish Wave

inj The triangle is now breached Upon breaching such a pattern, the currency is likely to rise from 10% to 50%.

INJ. Seed before they INJect a PUMP!INJ is registering significant accumulation at the current price point. A poke at a downtrend line break was broken after 6 days of descent.
This is a hint of a major price shift in the next coming days. 5.0 to 6.0 is a reliable order block support so expect some position buys from here.
-----------------------------------
Fundamentally speaking, INJ is one that you don't want to miss.
Injective Value Proposition
Injective provides the most advanced, next-generation financial infrastructure for building DeFi applications on top of the Injective blockchain. Users can access these applications in a fully decentralized, fast, cross-chain, low-fee, and secure manner.
Some of Injective's key elements include:
Layer-1 smart contract blockchain: Injective provides a start of the art interchain L1 that is able to achieve ultra fast speeds while charging zero gas fees.
Unlimited DeFi applications: Injective allows anyone to build DeFi applications with Injective’s robust infrastructure and financial primitives such as an on-chain orderbook.
Cross-chain trading and yield generation: Injective is capable of supporting a diverse array of trading and yield generation activities across distinct layer-1 blockchain networks such as Cosmos and Ethereum.
Community driven network governance: Injective is governed by its decentralized community in which all new innovations are voted on by a Decentralized Autonomous Organization (DAO) structure.
Pioneering interoperability: Injective is the most interoperable blockchain with native connections to Etheruem, Cosmos, Solana and much more.
Fully Customizable: Ship your products with the ability to swiftly modify any parameter to fit your use case.
Intuitive developer experience: Flexible and expressive development environments powered by Rust and Golang.
Environmentally Friendly: A 99% lower carbon footprint through Injective’s Tendermint PoS consensus mechanism
TAYOR.
safeguard capital always.

INJ SHORT!!!price looking bearish. abc correction together with supply and demand zones suggesting a short trade

INJ BearishAfter big pumps i think we will see 18%+- dump. I m still waiting for retest on 1 day TF , however pattern is bearish , we got a new low and we need retest most important EMA !
Give me like if you agree !

INJUSDT again at daily support, likely to aim for daily resistLets take another long from the daily support targeting the daily resistance again. This spike was due to this market not being that liquid like Binance one. But if you are not playing with very big size, not so liquid markets (provided this market is very liquid elsewhere) can be a boon as it can give you a very good entry and exit.

INJUSDT close to hit daily support, long favorable from thereThe price is very close to hitting the daily support around 6.56-6.66 zone. This support shall provide bounce to the price and make a long favorable from there. Lets watch how the price reacts when it hits that support zone.

Inj | Update Injusdt
Inj/usdt triangle breakdown confirmed retest is in process
If btc fails to break the 28500 resistance another 30/50% drop is expected for inj
Dyor

inj played out perfectlyinj trade idea was shared which worked perfectly well and pumped over 10% in few hours. Crazy gains.

Important update on INJ!We have just seen a new contraction zone appering on the daily timeframe for INJ, this means we are likely to see price whipsaw through the center of the box the coming days. I will update on scalps that will be possible in this period. Since momentum has changed to the downside, I believe we will be looking at shorts!
TPI update on INJUSDT
For now the TPI for INJ has fallen quite a lot from it's top, it's currently slightly bullish, but I'm sure that will change soon:
ps. I've linked the Momentum Channel indicator below, I made it a public script for everyone to use<33

INj is ready for another pumpInj is making bullish structure and ready again for another bullish rally in short term. Lerts ride on it

INJ - at what price will investors buy INJas we see at (D) chart, look at the corrective market structure. Goin to wave 5?

INJUSDT on 4h support likely to head towards 7.65The price has reached 4h support and a bounce is expected here. A long is favorable here for a target towards 7.54 first and then 7.65.

Injective (INJ): A Top Performing CryptocurrencyInjective has been one of the top-performing cryptocurrencies this year. Let’s see what happens next!
What is Injective? Injective is a blockchain designed for finance, powering DeFi applications such as decentralized spot and derivatives exchanges, prediction markets, and lending protocols. It offers core financial infrastructure primitives and a fully decentralized MEV-resistant on-chain orderbook. Its cross-chain bridging infrastructure is compatible with Ethereum and other blockchains. Injective uses the Cosmos SDK and a Tendermint-based Proof-of-Stake (POS) consensus mechanism, providing fast performance and transaction finality. It also provides a highly interoperable smart contract platform based on CosmWasm. INJ, its token, is used for protocol governance, dApp value capture, POS security, developer incentives, and staking.
Injective’s Current Trend
Injective (INJ) has been making waves in the cryptocurrency market, gaining 700% since the beginning of the year. INJ has stood out in the market due to its consistent upward trend, avoiding any significant periods of consolidation.
Currently, it appears that INJ is pulling back to its support level of $5.00. This pullback will result in a 50% drop from its 2023 high. The $5.00 support level is expected to hold, and afterwards we may see INJ continue its uptrend towards the all-time high.
For traders, one of the best aspects of INJ is its volatility. The daily candles of INJ are very large, which means that there is a lot of intraday volatility. This characteristic is a great advantage for day traders, as they can make quick returns.
Conclusion: Injective has proven to be one of the top performing cryptocurrencies this year, offering consistent upward momentum and high intraday volatility. With its pullback to the $5.00 support level, traders should keep a close eye on the price action of INJ in the coming days.

INJUSDT likely to visit 4h support around 7.20It seems the price wants to visit the 4h support area. A short seems favorable here till 4h support around 7.20 and a bounce shall be expected there which will provide a long opportunity.

3 waves completed INJUSDTThis is my count for INJ/USDT, currently correcting for wave 4.
usually after a strong bullish move wave 4 is a shallow correction especially if consider the rules of alternation because wave 2 made a deep correction, I am expecting wave 4 to correct between .236 of fib or .382.
there's still a wave 5 I am expecting.
(i don't trade wave 4's personally, one of my trading rules)

INJUSDT likely to head up towards next resistance around 8.20At this level, INJUSDT is also offering a favorable long trade. The price has reclaimed the support and trading inside it. I expect the price to move towards the next resistance around 8.20.

INJUSDT likely heading for next 4h support towards 7.21This one seems to be heading down towards the next support which is quite a bit away. The price is trading below the support and it will lose this support if current 4h candle closes below it. The probability favors a short here towards the next support around 7.21.

INJUSDT on 4h support, likely to head to 8.81The price has hit the 4h support area. I would expect the price to hold and bounce from here. A long trade is favorable with a target of 8.81.

INJUSDT likley to head towards 8.79The price has hit the hourly support here. A long seems to be favorable here with a limited risk. The target for the long should be 8.79.
