TradeCityPro | INJ: Key Triggers Amid Downtrend and Volume Shift👋 Welcome to TradeCity Pro!
In this analysis, I want to review the INJ coin for you—one of the attractive crypto networks, which with a market cap of $783 million, is ranked 73rd on CoinMarketCap.
📅 Daily Time Frame
In the daily time frame, as you can see, we have a downtrend that started after the price was rejected from the 25.43 top, and after breaking 16.04, the main bearish leg of the price began and dropped down to the 6.94 zone.
🔽 This bearish move has followed a trendline that we can also observe in most altcoins. Currently, market volume is decreasing, and it can be said that the price is diverging from the volume—and if this divergence is activated, the price will reverse trend.
✔️ The first trigger for a trend reversal is the break of the trendline. Given the volume divergence, if this happens and the trendline breaks, we can consider the break of the 8.96 trigger as the main reversal confirmation.
📈 If the price stabilizes above the 8.96 zone, it can move upward and start an uptrend. The next resistance for the price would be 16.04. However, for a spot buy, the 25.43 trigger is the most important one, which the price is still far from.
💥 On the other hand, if the 6.94 zone is broken, the price will move downward and may start another bearish leg. But an important point is that there’s a very strong support at the 5.65 zone, and if the price moves downward, it may be supported by this area—so it's better to confirm the next bearish leg with a break of 5.65.
⏳ 4-Hour Time Frame
Let’s move on to the 4-hour time frame to examine suitable triggers for futures positions.
🧩 As you can see in the 4-hour time frame, there’s a descending channel in which the price is moving, and it is currently near the top of the channel.
🔼 For a long position, if the channel top is broken, we can enter a position with the activation of the 8.51 trigger. If the price tests this zone multiple times, the position can become much more reliable, and the possibility of a sharp bullish move increases.
📊 The important point is that buying volume should increase as the price moves toward 8.51, because for a trend reversal, volume must converge with price.
📉 For a short position, the first trigger is the break of the 7.61 zone, which is a good trigger because the price is being rejected from the channel top, and there is a possibility that the price moves toward the midline or bottom of the channel.
🎲 The main trigger for the short position is the break of 6.94, which is a very important low, and breaking this zone can lead to a sharp move down to the 5.65 zone.
📝 Final Thoughts
This analysis reflects our opinions and is not financial advice.
Share your thoughts in the comments, and don’t forget to share this analysis with your friends! ❤️
INJUSDT

INJ Analysis: 300% Profit Potential (1W)AI Sector Symbol Analysis: 300% Potential
The AI sector symbol is currently undergoing a significant correction, and it seems to be forming a diametric pattern, with the price now in Wave D. This wave could potentially end within the green buy zone, after which we expect the price to transition into Wave E.
It's important to note that this analysis is based on a weekly timeframe, meaning it will take time to unfold. Additionally, the entry zone is quite large, so a gradual REBUY strategy is recommended to manage risk effectively.
Target Levels are clearly marked on the chart, offering clear points of interest for traders.
However, be cautious: A weekly candle close below the invalidation level will invalidate this setup, so always monitor closely.
For risk management, please don't forget stop loss and capital management
When we reach the first target, save some profit and then change the stop to entry
Comment if you have any questions
Thank You

#INJ/USDT#INJ
The price is moving within a descending channel on the 1-hour frame, adhering well to it, and is heading towards a strong breakout and retest.
We are experiencing a rebound from the lower boundary of the descending channel, which is support at 7.20.
We are experiencing a downtrend on the RSI indicator, which is about to break and retest, supporting the upward trend.
We are heading for stability above the 100 Moving Average.
Entry price: 7.20
First target: 7.70
Second target: 8.15
Third target: 8.64

$INJ BULLISH PATTERNCRYPTOCAP:INJ showing a bullish Descending Broadening Wedge Pattern on the weekly.
Breakout could send it to $26, a potential 267% move!
👀📈

TradeCityPro | INJUSDT Best Trade Setup of the Week?👋 Welcome to TradeCityPro Channel!
Let's analyze and review one of the most popular cryptocurrency coins, which is in a more favorable situation than the majority of altcoins together!
🌐 Overview Bitcoin
Before starting the analysis, I want to remind you again that we moved the Bitcoin analysis section from the analysis section to a separate analysis at your request, so that we can discuss the status of Bitcoin in more detail every day and analyze its charts and dominances together.
This is the general analysis of Bitcoin dominance, which we promised you in the analysis to analyze separately and analyze it for you in longer time frames.
📊 Weekly Time Frame
On the weekly time frame, I see that the seventh period is stable, inj, and compared to the majority of altcoins that have their own low price levels, it is in a better space and is engaged in its own supports!
After breaking the primary trend ceiling, namely 9.28, we experienced a sharp upward movement and formed a historical ceiling at $53, and after forming a distribution box and breaking the important floor of 16.20 and pulling back to it, we experienced a continued decline.
We have now reached support again, which was previously a very important resistance, and now, as a result, it is probably not lost, but the weekly candle is a very good and bearish candle! Don't forget to save your profit, your strategy booklet and your positions, otherwise you will have made a 450% move without adding anything to your capital!
📉 Daily Time Frame
On the daily time frame, our trend is completely bearish as you can see and the events are completely accompanied by the formation of a downward bottom and top, but we are likely to suffer for a while.
After getting rejected from 34.16 and forming a box between 20.16 and 25.93 and losing the bottom, it made a move and then while pulling back with low volume and the next conversion to red, it became an inverted Sharpe, we experienced a decline!
Currently, we are forming a box between 8.63 and 10.68, and for selling and short positions, you can do this by breaking 8.63, and for the trigger spot risk and buying, if you feel the price is good, it is better to wait for the trend to break and do the trigger at 10.68. Let it structure.
✍️ Final Thoughts
Stay level headed, trade with precision, and let’s capitalize on the market’s top opportunities!
This is our analysis, not financial advice always do your own research.
What do you think? Share your ideas below and pass this along to friends! ❤️

INJ - BUY SETUP (MARCH 2025)INJ - BUY SETUP (MARCH 2025)
INJ is currently at strong support around $10, making it a solid long-term investment. Hold onto it as it has the potential to reach $100.


INJ | ALTCOINS | Bottom Likely CLOSEIn the previous cycle, INJ made a near full retracement after the bullish cycle.
This would put us round here, to which we are already fairly close:
To make it a little easier to reference, I'll use the Elliot wave tool (although these are not Elliot waves).
In short, the bottom is likely very close for INJ - but accumulation / sideways phase may take another while.
_______________________
BINANCE:INJUSDT

METISUSDT UPDATEMETISUSDT is a cryptocurrency trading at $17.57. Its target price is $32.00, indicating a potential 80%+ gain. The pattern is a Bullish Falling Wedge, a reversal pattern signaling a trend change. This pattern suggests the downward trend may be ending. A breakout from the wedge could lead to a strong upward move. The Bullish Falling Wedge is a positive signal, indicating a potential price surge. Investors are optimistic about METISUSDT's future performance. The current price may be a buying opportunity. Reaching the target price would result in significant returns. METISUSDT is poised for a potential breakout and substantial gains.

#INJUSDT is setting up for a breakout Long BYBIT:INJUSDT.P from $10,346
🛡 Stop loss $10,182
1h Timeframe
⚡ Plan:
➡️ Waiting for consolidation near resistance and increased buying activity before the breakout.
➡️ Expecting an impulsive upward move as buy orders accumulate.
🎯 TP Targets:
💎 TP 1: $10,550
💎 TP 2: $10,730
💎 TP 3: $10,849
🚀 BYBIT:INJUSDT.P is setting up for a breakout—preparing for an upward move!

INJ/USD "Injective Protocol vs Dollar" Crypto Market Heist Plan🌟Hi! Hola! Ola! Bonjour! Hallo! Marhaba!🌟
Dear Money Makers & Thieves, 🤑 💰🐱👤🐱🏍
Based on 🔥Thief Trading style technical and fundamental analysis🔥, here is our master plan to heist the INJ/USD "Injective Protocol vs U.S Dollar" Crypto market. Please adhere to the strategy I've outlined in the chart, which emphasizes long entry. Our aim is the high-risk Red Zone. Risky level, overbought market, consolidation, trend reversal, trap at the level where traders and bearish robbers are stronger. 🏆💸Book Profits wealthy and safe trade.💪🏆🎉
Entry 📈 : "The vault is wide open! Swipe the Bullish loot at any price - the heist is on!
however I advise to Place Buy stop orders above the Moving average (or) Place buy limit orders within a 15 or 30 minute timeframe most recent or swing, low or high level.
Stop Loss 🛑:
Thief SL placed at the recent / swing low level Using the 4H timeframe (13.000) swing trade basis.
SL is based on your risk of the trade, lot size and how many multiple orders you have to take.
Target 🎯:
Primary Target - 20.500 (or) Escape Before the Target
Secondary Target - 25.000 (or) Escape Before the Target
🧲Scalpers, take note 👀 : only scalp on the Long side. If you have a lot of money, you can go straight away; if not, you can join swing traders and carry out the robbery plan. Use trailing SL to safeguard your money 💰.
📰🗞️Fundamental, Macro, COT, Sentimental Outlook:
INJ/USD "Injective Protocol vs Dollar" Crypto Market is currently experiencing a bullish trend,., driven by several key factors.
🟣Fundamental Analysis
1. Project Overview: Injective is a blockchain built for finance, offering high transaction throughput, interoperability, and financial primitives.
2. Tokenomics: INJ is the native asset, used for transaction fees, staking, and governance.
3. Development Activity: Injective has a strong development team, with frequent updates and improvements.
🔴Macro Economics
1. Inflation: Global inflation trends may impact investor sentiment and cryptocurrency prices.
2. Interest Rates: Changes in interest rates can influence cryptocurrency prices, as investors may seek alternative investments.
3. Global Economic Trends: Economic uncertainty and market volatility can drive investors towards cryptocurrencies like INJ.
🟤On-Chain Analysis
1. Network Congestion: INJ's network congestion is relatively low, indicating a healthy network.
2. Transaction Volume: The transaction volume on the INJ network is stable, showing consistent activity.
🔵Market Sentimental Analysis
1. Investor Sentiment: Currently leaning towards a bullish outlook, driven by increasing adoption and positive market trends.
2. Market Positioning: Investors are optimistic about INJ's potential, with some expecting a breakout above $18.
3. Next Trend Move: Potential for an upward movement, with some analysts expecting a retest of the $18 zone before the next leg up.
🟢Positioning
1. Long Positions: 58.2%
2. Short Positions: 41.8%
🟠Overall Summary Outlook
Considering the current price of 16.500, INJ/USD is expected to maintain its upward momentum, driven by increasing adoption and positive market trends. However, investors should be cautious of potential price volatility and market fluctuations.
⚠️Trading Alert : News Releases and Position Management 📰 🗞️ 🚫🚏
As a reminder, news releases can have a significant impact on market prices and volatility. To minimize potential losses and protect your running positions,
we recommend the following:
Avoid taking new trades during news releases
Use trailing stop-loss orders to protect your running positions and lock in profits
💖Supporting our robbery plan will enable us to effortlessly make and steal money 💰💵 Tell your friends, Colleagues and family to follow, like, and share. Boost the strength of our robbery team. Every day in this market make money with ease by using the Thief Trading Style.🏆💪🤝❤️🎉🚀
I'll see you soon with another heist plan, so stay tuned 🤑🐱👤🤗🤩

Trading opportunity for INJUSDTBased on technical factors there is a Buy position in :
📊 INJUSDT
🔵 Buy Now
🪫Stop loss 8.75
🔋Target 12.50
📏 R/R 2,5
💸RISK : 1%
We hope it is profitable for you ❤️
Please support our activity with your likes👍 and comments📝

KAVAUSDT UPDATEKAVAUSDT is a cryptocurrency trading at $0.4711. Its target price is $0.7500, indicating a potential 70%+ gain. The pattern is a Bullish Falling Wedge, a reversal pattern signaling a trend change. This pattern suggests the downward trend may be ending. A breakout from the wedge could lead to a strong upward move. The Bullish Falling Wedge is a positive signal, indicating a potential price surge. Investors are optimistic about KAVAUSDT's future performance. The current price may be a buying opportunity. Reaching the target price would result in significant returns. KAVAUSDT is poised for a potential breakout and substantial gains.

INJUSDT 1WINJ ~ 1W Analysis
#INJ Test this support, buy gradually from here with a short -term target of at least 20%+.

Injective Protocol to $100? Looks for a nice run upIt looks like the road to $100 for Injective Protocol is getting stronger and stronger.
After bouncing right off the 50% retracement, things finally look good for INJ to make a new expansion move higher.

Breaking: Injective Protocol ($INJ) Set For a Comeback The first and only blockchain built for finance that is open, interoperable layer-one blockchain powering next-generation finance applications, including DeFi, RWAs, AI, decentralized exchanges, prediction markets, lending protocols, and more, is set for a comeback with a speculated 140% surge in sight.
Weeks after Breaking down from a rising wedge which is a bearish pattern, CRYPTOCAP:INJ has shown signs of a reversal. With the Relative Strength Index (RSI) already oversold at 28 CRYPTOCAP:INJ is gearing up for a massive comeback with the All-time high of $52.75 a move to the $19 pivot point could spark the resurgence to the recent ATH attained.
Similarly, with growing momentum and the asset trading below key moving averages (MA) CRYPTOCAP:INJ is currently up by 3.41%. The Injective Protocol is becoming an asset worth watching.
Injective Price Live Data
The live Injective price today is $8.77 USD with a 24-hour trading volume of $166,682,991 USD. Injective is down 7.91% in the last 24 hours, with a live market cap of $867,892,886 USD. It has a circulating supply of 98,970,935 INJ coins and the max. supply is not available.

$INJ next support is at $8.45I don’t have good news.
I remember buying CRYPTOCAP:INJ last June and selling it at a loss in December. Looking back, I’m glad I did—if I had held, my losses would now be over 80%, which is catastrophic.
I’ve spent some time in the Dojo Trading Telegram chat, talking with some great people. No doubt, there are real believers and long-time holders there. I feel for them, seeing how bad things are going now.
📉 The chart shows the next support at $8.5—I can’t believe I’m writing this, but it is what it is. Hopefully, that will be the bottom.
In another idea (check my profile), I predicted a bearish crypto market until May 2025, followed by two months of relief with a pump and a mini altseason.
That said, nothing is certain in this toxic environment filled with war tensions, tariffs, and a looming recession.
I’m sticking to my view that May and June will be bullish, purely based on indicators and charts.
The dump is global. A few new coins are hyped for a couple of weeks, but the entire crypto market has been bleeding since June 2024. The brief relief in December? Completely erased—and worse.
Prepare for the worst. The storm will end in May. Go fishing, touch some grass. CRYPTOCAP:INJ and NASDAQ:ATOM are solid projects, but right now, only whale stakers are profiting, while retail investors are getting slaughtered.
DYOR.

INJ Price Analysis: Key Zones & Reversal ScenariosHey everyone! 👋
Let's dive into this price chart and see what’s going on with INJ.
Overview:
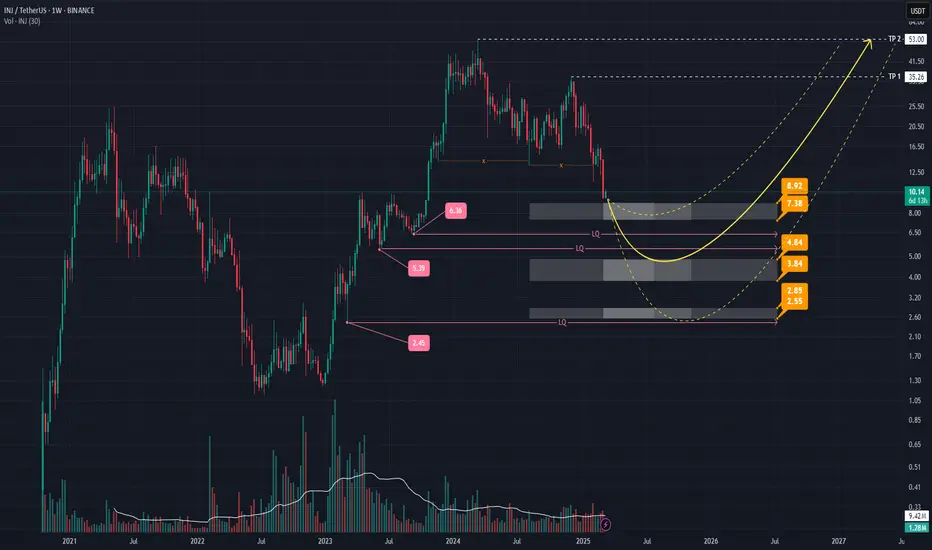
We’re looking at INJ on a weekly timeframe , and there are some interesting levels to watch. The chart shows **three key zones** where price reactions might happen, marked with price levels. There are also areas of liquidity (LQ) , where the market might make a move before reversing direction.
Potential Reversal Scenarios:
Three possible price movements are shown with yellow arrows , each representing a different way the price might reverse. The second arrow is the primary scenario, suggesting that after sweeping at least one liquidity level, the price could bounce back up—especially if there’s solid volume and a strong candlestick pattern.
- Main Support Zone (3.84 - 4.84): This area is the most important. If the price reaches this zone and shows good volume and a strong candlestick pattern, it could signal a trend change.
- Other Support Zones (2.55 - 2.85 and 7.38 - 8.92): These are additional key levels. A drop below these could change the outlook.
Take Profit (TP) Targets:
TP levels are marked on the chart. If the price reverses as expected, these targets may be reached.
Final Thoughts:
Nothing in crypto is guaranteed! Always look for confirmations like volume and candlestick patterns before making decisions. Stay informed, trade smart, and always do your own research! 📊💡
INJ PUMP LOADINGINJ is at key level which was acting as resistance and after breakout now it has become support level. It is also in weekly FVG. Expecting reversal from here, upside key level marked if we close above that level then we will see huge pump in INJ as we witnessed in early 2024.

INJ Long OpportunityMarket Context:
INJ has retraced into a strong support zone, presenting a high-probability long trade for a potential rebound.
Primary Trade Setup:
Entry: $13.00 - $12.00
Take Profit Targets:
$16.00
$18.00
Stop Loss: Below $11.30
Secondary Trade Setup (Deeper Support):
Entry: $10.00 - $9.50
Take Profit: Adjust based on price action
Stop Loss: Below $9.00
This setup targets a bounce from major support, with the potential for a stronger rally if bullish momentum returns. 🚀

INJ 100$INJ is aiming for $100! The project has completed unlocking tokens, 80% of the entire issue is in the hands of the project team and their investors. We also formed a bullish flag and pushed from its lower boundary. Pay attention to this project!
Horban Brothers.

inj short midterm"🌟 Welcome to Golden Candle! 🌟
We're a team of 📈 passionate traders 📉 who love sharing our 🔍 technical analysis insights 🔎 with the TradingView community. 🌎
Our goal is to provide 💡 valuable perspectives 💡 on market trends and patterns, but 🚫 please note that our analyses are not intended as buy or sell recommendations. 🚫
Instead, they reflect our own 💭 personal attitudes and thoughts. 💭
Follow along and 📚 learn 📚 from our analyses! 📊💡"
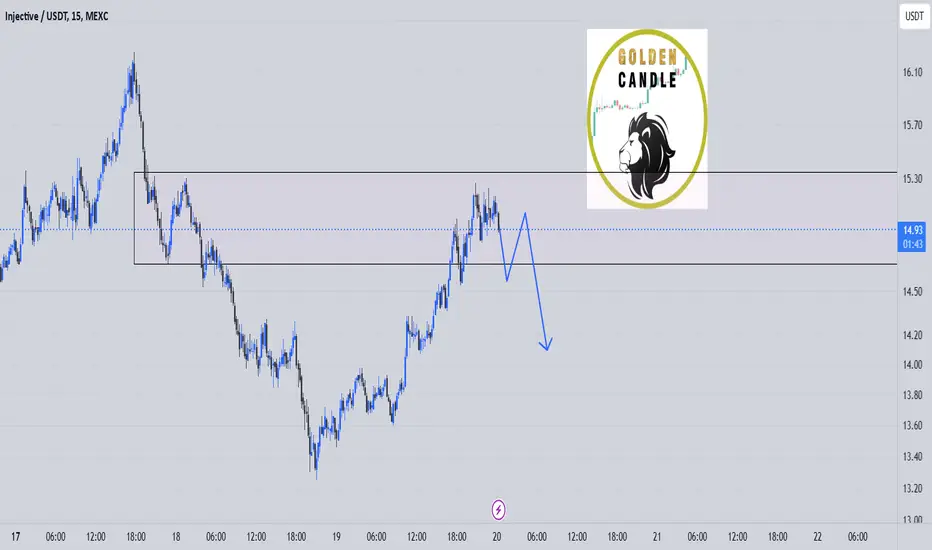
DEVIATON INJIt looks like we have a deviation below the demand zone and the $13.8 support, which could present a buying opportunity.
I’m waiting to see if the price finds support around $14.4.
If the price drops below $14 and stays there for an extended period, I’ll reassess the trade, as we could see another leg down toward the $8-$11 zone, where stronger support is likely.
For now, the weekly oscillators look decent—Stoch RSI is close to a bullish cross, and RSI has found support at 40.
