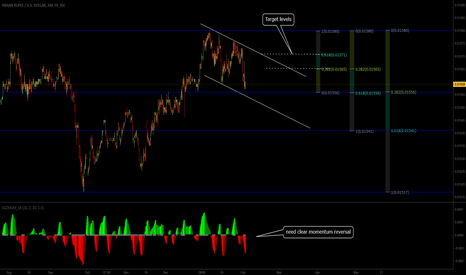
USD / INR - 2025 & 2026 will decide the path3M candle (Q1 2025) printed a bearish signal with a top at $88.
Structure looks weak for now, a break below this candle could confirm a bearish shift.
DXY is cooling off due to a dovish Fed outlook, easing inflation, and broader macro rotation into risk assets. If the 100–102 zone breaks, expect extended downside which could support INR, gold, crypto, and other non-USD assets.
First Support - $63.64
INRUSD
INRUSD - Indian Rupee Collapse UPDATEMy initial post on INRUSD was back on Sept 2022 more than 2 years ago.
My update is more of the same going forward. INR will continue to collapse despite its nominal economic growth.
When the economy is very small relative to its population, the growth rate doesn't matter as if a major economy like the US has similar growth. It's like comparing apples to oranges. But I certainly understand how people can be misled. That's why I am trying to explain it to you here today.
DXY v's Brazil Russia India China B.R.I.C. CurrenciesNote how the two large pattern #HVF's kept you dollar long as the main directional trade from 2011 to 2022
But things may be turning around and this trade may, potentially be reversing.
Often when commentators have given up on the idea
of a multi polar world, end of dollar dominance , as price keep going the opposite direction.
Is when the trade actually starts to kick into gear.
These are major resource nations , with 40% of global pop.
30% of the land
and well over a 1/4 of global GDP
Would make sense to see this basket of currencies outperform our beloved Greenback.
RDY: Top candidate to go long indian shares...$RDY has a very strong monthly trend that is currently active, and also a strong daily chart, showing a trend is now active. We can go long risking a fall under the red line on chart, if aggressive, following the daily signal but aiming to capture the monthly trend as well. This would be a huge reward to risk position if it were to pan out favorably for us.
I see the $INRUSD chart as significantly strong, and similar to the period from 2016 to 2018, and $RDY has a good valuation here, as well as substantial growth potential going forward. Free cash flow yield is 7.93%, EPS growth is positive in the last quarter and in the last year, and they are not too indebted, the company certainly has good liquidity and sales are steadily albeit modetly growing.
Best of luck,
Ivan Labrie.
USDINR (U.S.Dollar / Indian Rupee) Currency Analysis 29/03/2021on a bullish impulsive wave we can see there exist a Hidden Bullish Divergence with MACD which is the sign of trend Continuation, followed by a Milled Bullish Divergence
there total of 2 Targets Defined by Fibonacci projection,
79.50 Rs seem to be a good target for the end of 2021
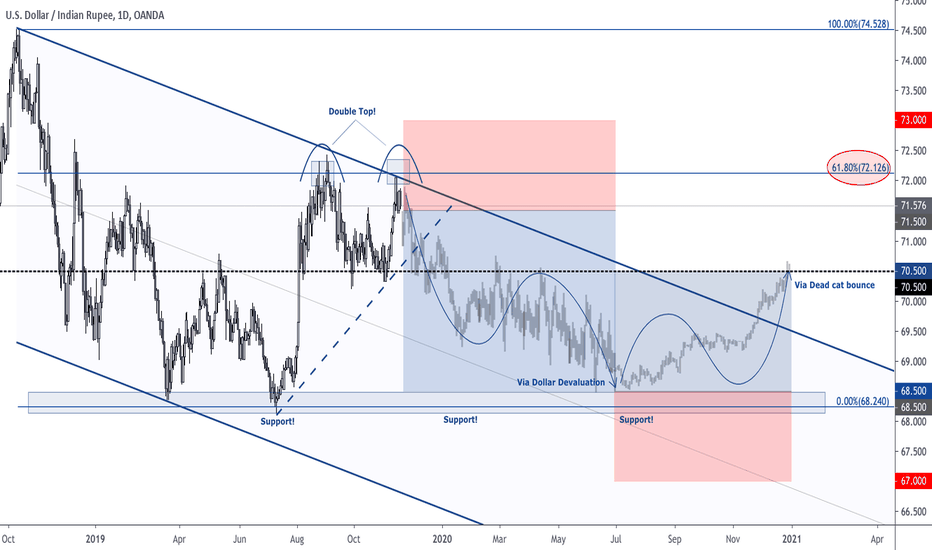
Large Swing In Play For USDINR in 2020Here we are tracking the 2020 macro map for USDINR, a high yielding EM currency. The expansion in volatility here will come from CB coordination, and being short USDINR which generally would also support a view for better risk appetite means it acts a great portfolio hedge for those looking for high carry.
On the INR side, macro figures are starting to indicate further upside although still stuck in low gears. The tax cuts from the fiscal side doing some of the heavy lifting thanks to Modi (India's version of Trump). Inflation is subdue with a lot more slack left in the labour market and a cheap commodity board.
Should investors see the deficit handled appropriately then all boxes are checked for capital flows into India. Demand for INR looks set to improve and combined with the USD devaluation theme it makes a great few months for INR to see some appreciation.
Risks to my thesis come from US-China protectionism, private capex not picking up (low odds after the attractive tax cuts) and to a lesser extent if RBI push the INR down by accumulating.
USDINR Daily Chart: An ending diagonal coming home?USDINR seems to have completed a 5 wave move as per ending diagonal pattern shown as 1-2-3-4-5, and also an impulse wave of higher degree shown as (1)-(2)-(3)-(4)-(5). Can expect a fall to 70.41 by 30/08 - 04/09
A move above 72.30 invalidates the pattern.
Wave count in Nifty too supports short term weakness.
USD/INR: Buy & Sell Full Trade Setup !!BUY & SELL Above Given Chart or
You Can Also set Own Risk reward.
Let see what Will be Next Move.
Warning- I m Not a Financial Advisor this idea Only For Educational Purpose Only.
Thank You !!


