ATVI inside day after all time highIt's obvious to find out that Blizzard is able to catch their players attention well recently,
and it reflects on it stock price significantly!
(Both Hearthstone and Call of Duty are killing my office's vibe lol.)
I would very love to long the inside day after new high today.
Let's see how it goes yo!
Inside Bar

IQ daily XYAB and inside day breakout longOne of the strongst IP of Iqiyi "I can I BB" just started its 7th season.
On the Contrary, its stock fell significantly after they announced their share issuing plan.
Compared to its peer BILI, IQ's stock had been terribly weak in the past 2 months,
it's not a very crazy idea to try to look for some long opportunities here.
Here we got this inside day after daily XYAB
I'm willing to long this one if it's able to break to the upside today.
Let's see how it goes yo!

Break out from a continuation pattern NASDAQ:CRSP Continuation wedge after a big break out. The trading range has got very tight with buyers and sellers starting to agree on the current price. Potential
buy through 152.5 against 147.

NZDCHF, daily tf, inside bar pattern continuationHello my friends,
Another setup for next week is NZDCHF pairs.
As you can see there is an inside bar pattern on this pair right now.
I think we could pretty much see price continue to go up because NZD is bullish.
It is supported by the EMA which is below the price so we will only look to buy this pair.
We could also use an assumption that this upwards movement might respect elliott waves rules and marked the first 2 swing as Wave-1 and Wave-2.
Right now we're on Wave-3 and i think it could go until 0.6380 area whic is where we put our take profit.
Buy limit NZDCHF 0.6285
Stop loss 0.6250
Take profit 0.6380 (2.7R)
RR Ratio 1 : 2.7
Use only 1-2% risk
Good luck
Check my NZDJPY trading plan as well on the link provided below.
Give it a like and follow me for my next update.

EURUSD inside 30 / structure pullback after inside day breakoutEURUSD has an inside day break out today to break the 1.2200 fig.
Here we got this inside 30 trade, to long the breakout is of course a trade that I'll be interested in.
Also, if it breaks to the downside,
I would also like the pullback long @ 1.2170
Let's see how it goes yo!

C inside day after new high!Bank stocks started a very nice rally since November, C almost went up for 50% already!
Here we got this inside day after new high as a potential chance to get on the train!
Let's see how it goes yo!

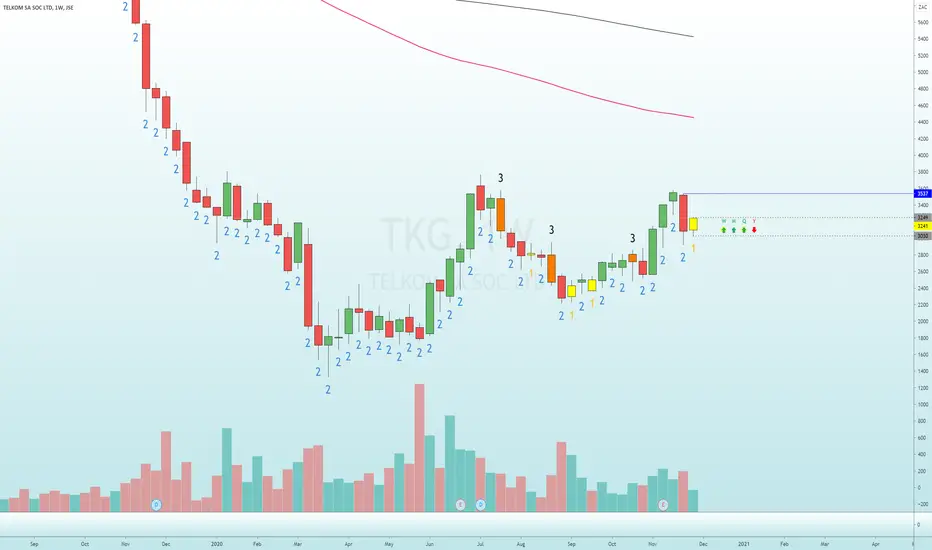
TELKOM - Inside Bar- Another stock which formed an inside week
- Above R32.49 will target R35.37
- Longs are favoured as depicted by timeframe continuity ( trend)
-- MANAGE YOUR RISK - -
Disclaimer: All ideas are my opinion and should not be taken as financial advice.
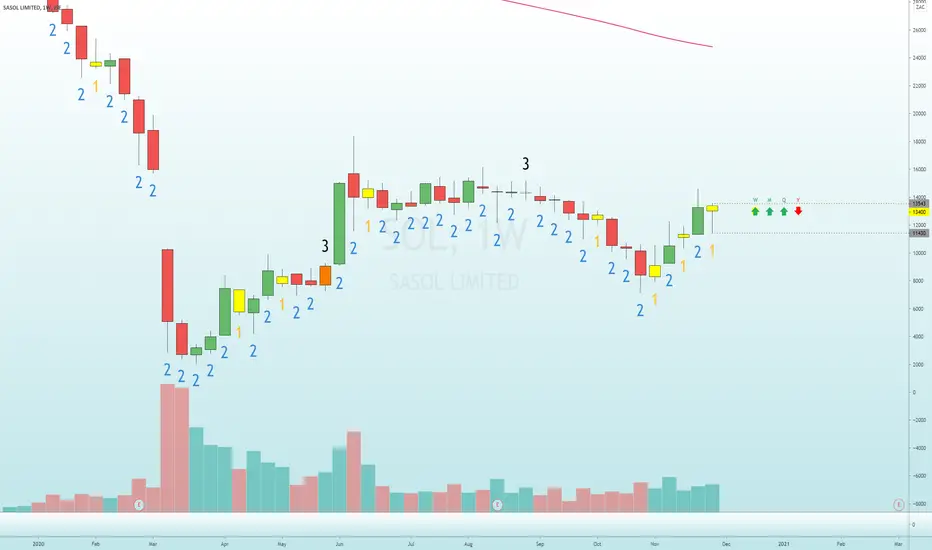
SASOL - Inside Bar #theStrat- Sasol formed an inside bar (#1) for the week past.
- A break above R135.43 will target R146 which is the high of the "mother bar" or previous candle.
- Below R130 could signal a pullback towards the lows of the week
-- MANAGE YOUR RISK - -
Disclaimer: All ideas are my opinion and should not be taken as financial advice.
GBPUSD Long Positions Entries: 1.32671 1.33123 1.33980GBPUSD Long Positions Entries: 1.32671 1.33123 1.33980


USDCAD 4hr triple inside bar after inside week breakdownCommodity currencies had been very strong recently,
USDCAD had an inside week breakdown earlier in this week,
and here I got this 4hr triple inside bar to get involved!
Let's see how it goes yo!

usdoil inside 1h shorteven through that the USDOIL has an inside week break up ,but it seems that the price is rallying to the supply zone ,and that's price action show the supply zone is still works,we just need to wait the more signal like inside 4H to catch up this short train.

GBPUSD gartley and 15m inside short planGBPUSD has formed a bearish gartley and the price just touch the 4H supply zone,i choose the an inside 15m to do that's combination short short plan.

Rare prediction on GSX before ER !?I don't do any kind of prediction on the market for quite a long time
as I prefer to take trades with my system and respect whatever result the market gives.
This one is more an verification idea than a trading idea.
GSX stocks had been fallen a lot after the scheme, and it broke the inside week to the downside before ER.
I will pretty much be pessimistic about both the ER result and the price.
Well, I still won't take trades before an ER, this is just to see if this inside week breakdown
may be some sort of implication of the following price actions.
Let's see how it goes yo!

BTC inside day after new high, looking scary? looking tasty!Again again and again, BTCUSD has an inside day after new high.
Basically all of the past ones were successful trades, and all of which were looking scary.
This is a debate about: "how to define an exception"
If we don't have any reason to say this one would be the exception,
this inside day will still be definitely a very good trade to take!
(despite all the lousy voice that tells to avoid chasing highs)
More than welcome to check my previous "scary trades" in Mandarin version of TradingView!
inside day after new high (1)
inside day after new high and 8ema correction
Let's see how it goes yo!

BNTX daily shooter after all time highAfter the encouraging news on Monday to gap high to all-time high,
BNTX has formed a daily shooter.
Not a crazy idea to long the breakout and aim for the completion of the butterfly.
Let's see how it goes yo!

GA pullback & movePrice broke 1.787 level and made new low at the weekly key level at 1.75 . After this price has been on a rally to the upside creating new prominent highs at 1.853 . Price retraced back lower breaking the trendline with a huge shooting star telling us that the bears are in control of the market. Weekly closure has formed a bearish engulfing . Also the moving averages are crossed . Looking for the weekly level to be met at 1.78687, but before this I do favour a small pullback to the liquidity area to find the right momentum to drop the price lower.
#tradesafe #theforexdaddy #tfd

Double Inside Bar Formed at Daily SupportPrice action on this pair has now formed a double inside bar pattern on the daily chart.
This is a pretty rare pattern because whilst we will often get a series of candles that are formed inside one large candle, they are not often consecutive inside bars.
This pattern is sitting directly on the recent resistance level and new price flip support level.
If we can see this level hold, we could see the pattern break to the upside to activate potential long trades for a run into the overhead resistance.
Thanks for your like and support....


Bitcoin - Keep your eye on 4 hour inside bar for direction Bitcoin is currently printing a 2nd inside bar for us to decide which way Bitcoin may break.
Watch for a break if we move past the high of $13,387.30 or the low of $13,149.43 from the previous inside bar.
Whether we break bullish or bearish, I would still expect us to stay within the broader tightening equilibrium pattern for now.
Current equilibrium resistance is $13,687.82
Current equilibrium support is $12,976.29 and then $12,891.57
Good luck trading.


XAUUSD hourly shooter after inside week breakdownA very good trade on Monday morning !
XAUUSD had broken its inside week to the downside earlier, which created a weekly bearish perspective on it.
Here we got this hourly shooter right after that, of course I'll be willing to the this trade!
Let's see how it goes yo!
