Insolar (Dec 08) 46% PProfit in 35 Days#INS/BTC (Binance)
Entry Zone: 2400 - 2500
Take Profits: 2600 - 2800 - 3000 - 3250 - 3500
Stop Loss: 2150
Insolar


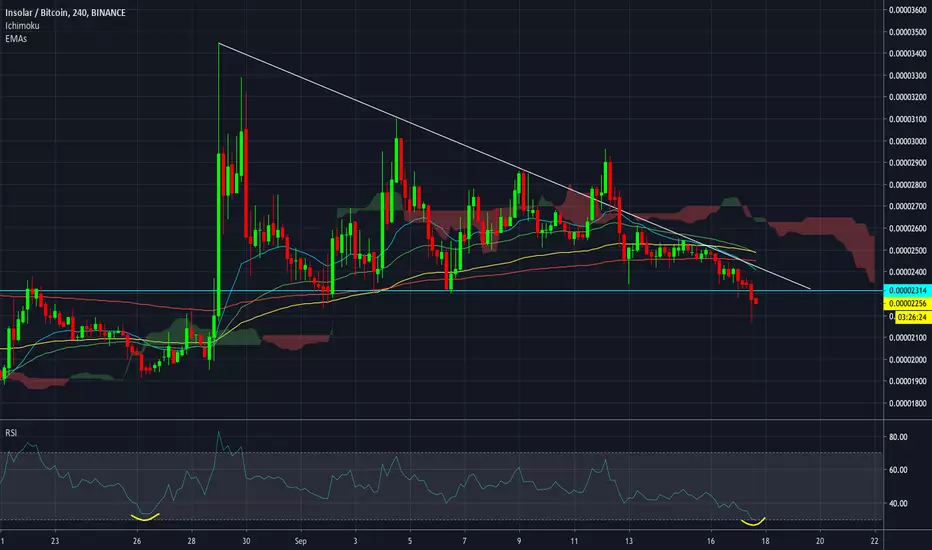
INS/BTC (Update) | Symmetrical Triangle Breakout..!!INS/BTC (Update)
Symmetrical Triangle Breakout Done & Now Facing Another Resistance (EMA100) in daily TF Chart.
Volume in Increasing Slowly But need More Volume For EMA100 Breakout.
Major Indicators Are Bullish & I'm Expecting Big move in Coming Days if It Remains Above the Symmetrical Trendline..!!
Please, give us your opinion in the comments.!!
If you like the idea, please hit the Like button and subscribe to the profile in order not to miss our updates.
The information given is never financial advice. Always do your own research.

INSBTC 1DInsolar-daily; possibility of the breakout to falling wolf pattern and harmonic and H&S patterns. Break a leg!

INSBTC 4HMACD is bullish crossover mode and ADX weak bullish trend on Insolar coin. Must be considered after a slight correction for now RSI swollen though.. break a leg, good luck!

Today`s ALT!!! INSBTCBINANCE:INSBTC
Exchange : Binance
Coin: INSBTC
Buy Zone: 0.000025~0.000024
Target Point: 0.0000274 / 0.00000294/ 0.0000308/ 0.0000325/ 0.00000339
S/L: 0.0000223
Risk: HIGH
Term: Middle
It`s making Symmetrical Triangle
The Chart and RSI are very similiar
The Volume is slowly down, so we need more time to pumping !!
=====================================================================
Today`s ALT is that information is raised regardless of the Coin market situation
So sometimes there`s a high risk trading
Investment is your responsibility.
I'm just providing about coin`s information
=====================================================================

Classic ascending triangle formed on Insolar/Bitcoin chartAs you can see on the chart, a perfect ascending bullish triangle has formed. Expected to break out at the level shown on chart per measurement

Insolar (Oct 09) #INS $INS #BTC $BTCWhat to know :
- My Red Arrow indicates the expected target and expected time
- All Free Signals are hidden the trade info


CHAINLINK vs INSOLAR, Fractal TAKEOFFIf fractal works out, Insolar INS may be ready for takeoff, targeting above 3 USD by Q12020.

INSOLAR - INSUSD > READY TO ROKET?Nice setup on the bottom of the channel.
2 days to the Mainnet launch and 30 before the final token SWAP.
Fractal vs LINKUSD bottom may deliver a first short term target around 5.3$ by April 2020.

Keeping an eye on $INSMaybe this has dropped too much allready with mainnet and other FA upcoming end of month but ill take a small position.

INSOLAR $INS vs CHAINLINK $LINK FractalMaybe a double bottom (vs Dec18) is in place.
Volume increasing stably on most Exchanges. As AVG 1,5M$ per day (not considering BITHUMB where token exchanged are in the Top25, even ahead of ETC).
Huge Volume peak @ the end of August.
Drawing some up-trending lines & comparing with some fractals, possibly hitting the 37-38 $cents by the end of Sept and in the 50 $cents by end of Oct19.
Then we have the Mainnet launch and the token swap (XNS), therefore some profit taking could be reasonable.
Best

INSOLAR, BITCOIN, XRP : INTEGRATIONAlt Season maybe ahead or maybe not.
After knowledge and adoption next step is integration;
World knows crypto; some, both private and Institutional have already adopted them (or they will);
Next step is to "integrate" the different concepts into the different industries and let them work jointly and smoothly (blockchains with "real world" via other "oracle" blockchains- placing smart contracts among other smart contracts-, or with other blockchains through "atomic-swap" etc).
First to be "partially" integrated have been the "coins" intended as means of payment or transfer of value... quite logical considering that we already operate into a System (Financial System) completely de-materialized.
But World doesnt need thousands of token, blockchains or coins.
We may need probably multiple of tens:
1- BITCOIN as "store of value", decentralized, fair, limited, public, etc etc etc to "save" the system from the "irrational exuberance" of ITSELF with infinite money printing, fractional reserves practices, etc etc...
2- MAYBE XRP as the "public" settlement token (since many banks etc are already using or working on their "private" one); have to say I dont Own or like XRP: centralized and "privately governed" as much as could be the PBOC future token, however more "FAIR" than all the possible "others" that any Central Bank or Government can issue in the future, efficient, "regulated" and accepted\used (also considering that its Consortium is backed from the same Banks that are anyway now working on their own platform), etc etc. Clearly there is NO FUTURE (unless into the "dark market" I suppose or in the very "third world" countries) for "privacy coins": Korea started already among the "crypto friendly" countries... then.... we always had China and, India..... then Japan (?) and USA will probably follow.... then maybe EUROPE (France and Germany already "struggling" with "LIBRA", etc etc); clearly the most "advanced" blockchain jurisdictions, if jointly represent also regulated countries, will be the first to "fight" the concept of "privacy" that can be used to illicit scopes, that can deteriorate their image, rating, relations etc, let them become the next "dark" heaven for some reasons.
3- Some Blockchains projects, functional to their "being": TRUST. Here clearly we have Ethereum ETH, the "grandmother"... but as everyone knows with some limitations (clearly arised thanks to adoption..who could know before...): scalability, speed, somehow security (for itself and other networks\dapps relying and built on it), etc etc; here comes the other projects trying to "bypass" the bugs: TRON, NEO, CARDANO, etc that clearly gained their "rank" into the industry BUT if ETH is nonetheless the most adopted and trusted "infrastructure" I suppose there is a reason. Even EOS (I personally prefer and Own TLOS, from my perspective a much more efficient, decentralized and fair project.... forked from EOS) was unable to get the "throne". However TRUST is not sufficient, because if "CORE" blockchains maybe functional for a specific purpose\dapp, then each blockchain need to interoperate with another AND, in many cases, need to be connected with the REAL WORLD. And so, on such, project like CHAINLINK (LINK) pumped like rockets. Obvious :). And now other are coming. Therefore its reasonable thinking that beyond the "core" (or FIRST\SECOND Generation) blockchain projects, now its time for projects being "utilities" of the existing infrastructure. Maybe the case.. or maybe not. If you build facilities into an existing building with a weak basement to attract more guest, probably the only result you achieve is to have the building "overcrowded" when it comes down.
Maybe are the 4th\5th generation blockchains the ones who will completely change the overcrowded "token\mainnets" marketplace.... to rescue all guests of the building. Once someone will deliver a "code" and mainnet infrastructure trustworthy, able to "talk" with the other private or public infrastructures, connected to the real world, in the position to manage transactions, information flows, security, compliance and regulation rules, etc etc then probably we will experience the real MIGRATION, not only of "dapps", but of habits, adoption, USE. Then probably we will have Bitcoin as "store of value" against the political systems inefficiencies, XRP as "public" alternative among many others "value transfer" private solutions, and a bunch of 4th\5th generation blockchains that like the Iphone or SAMSUNG will enter and be into Our day-life to interact securely and efficiently with everything.
On such Insolar may represent the Iphone or SAMSUNG, maybe a real GEM... maybe not. I personally Own some of her.. and not only because of the potential "profit", but because somehow I would like to think to be one of the, perhaps, 16.000 token holder, who helped and funded "Steve Jobs" to build and drive a revolution... for me, my kids, my friends......
Looking at the chart (I'm not a chartist "pro", but think that a chart can summarize much around the "mood" of people and investors in the Company\Project... unless its manipulated clearly :) ), INSOLAR (INS) first target could be 3,48$ ( equaling 149MM$ Market Cap considering 36.250.000 token issued);
MAIN-NET alive from 1st October with Token Swap 1st November: insolar.io
Token staking: insolar.io
4th Generation Blockchain: insolar.io
Big partnerships in place and a remarkable Team: xangle.io
N1 GITHUMB commits: www.cryptomiso.com
Major Exchanges: Binance and Bithumb with volumes and liquidity in the TOP100: etherscan.io
Dapps and Products under testing already, as the Transactive Energy System (TES): medium.com
In essence a real project extremely undervalued from my perspective, and that may represent the NEXT "grandfather" with a long term target around 73$ (2.6B marketCap)? who may know... and as soon as those "minds" will work and try to change Our life in better, I'm with them.
Best

INSBTC Breakout it's never later every morning comes with possibility
Entry : 230- 235 , small amount at current price 238
Stop Loss : 5%
Target : 5% , 10% .. Open

INS - Can it live up to the hype...??INS is down like any other alt and currently getting squeezed in much tighter range. Broke support and now trying to get back to the support level.
Maine used to be very high pump factor sometime back and with public testing of mainnet 1.0 this month, can register good gains?
This needs to be seen. Was shilled heavily few days back. Lets see if fundamental news can drive this alt..
Since it broke support so trade carefully with it in case it find support at bottom which is another 10-15% down from here.
INS | Close to the Breakout!In this Chart we see a Symmetrical triangle which tells us the Breakout is approaching.
The main question in this case where to? Well, very often this pattern is considered as a continuation pattern , and the last downtrend line prompts us the next direction where price will go. But I would not recommend to hurry and make some quick conclusions. There is no single pattern that is working 100%.
So our only way is to wait for the Breakout to be confirmed and use the opportunity to catch the movement!
Please give your feedback and share your ideas! Also hit the like button, in case you like this idea and subscribe to the Channel in order not to miss new ideas and signals.
Remember this analysis is not 100% accurate. No single analysis is. To make a decision follow your own thoughts.
The information given is not a Financial Advise.

INSUSD has formed bullish shark | Upto 111% from herePriceline of Insolar (INS) / US Dollar has formed a bullish shark and entered in potential reversal zone.
RSI is already in oversold.
Price action take bullish divergence soon from this PRZ area insha Allah.
I have defined targets using Fibonacci sequence:
Buy between: 0.1975309 to 0.1403828
Sell between: 0.2756556 to 0.4187189
Regards,
Atif Akbar (moon333)

INS - Great FA - Not Took Off Yet...Odd one to see. Great Fundamentals and developments but no real push yet.
EMA34 is holdings above on the longer-term chart (6 hours) but still in a bear trend.
BTC Dominance is still very high.

INS bullishINSolar has a nice slowly forming uptrend and currently near breakout of triangle. Within same bullish trend may test ~250-260 once again, before going higher. Or continue without pullback. In any case look promising. Check out chart for targets - nearest are at 290 - 300.

INSBTC BULLISH 1 Hourwell breakout is done and looking good to me
15 min Bullish Divergence in RSI
Very good you can buy near 247 if comes i'm also later let's see
And a humble request please book small profit or whatever you get 1-3% it's an request we are not in a good market right now

INSOLAR - Developments + Fundamentals Pushing This TrendWith Mainnet + Wallet releases this is starting to trend up. Could get interesting. Keep an eye on it, could keep going up.
