Short signal on Es500 4h chartHello guys I wish you the best.
As we know there is nothing 💯 In trading but I think this idea might work.
Please leave comment for me and share with your friend, thanks.
Cheers 🥂.
Institutional

Inflection PointBKI caught my attention for a few reasons.
1. Held by Scion Asset Mngt- if you haven't heard of them or Michael Burry, check it out. Crazy returns off the financial Crisis.
2. SP sitting at an inflection point at bottom of long term demand zone and near lowest long term demand zone.
3. BKI's shiller PE ratio range over the past 10 years is from 36.26-43.09 and currently sitting at 37.37 implying that it is near its lowest valuation in 10 years.
4. Mornings Star Fair Value market valuation sitting at $61.1. My own target of $77.5 is based on a Fibonacci retrace of 61.8% of 2020 highs.

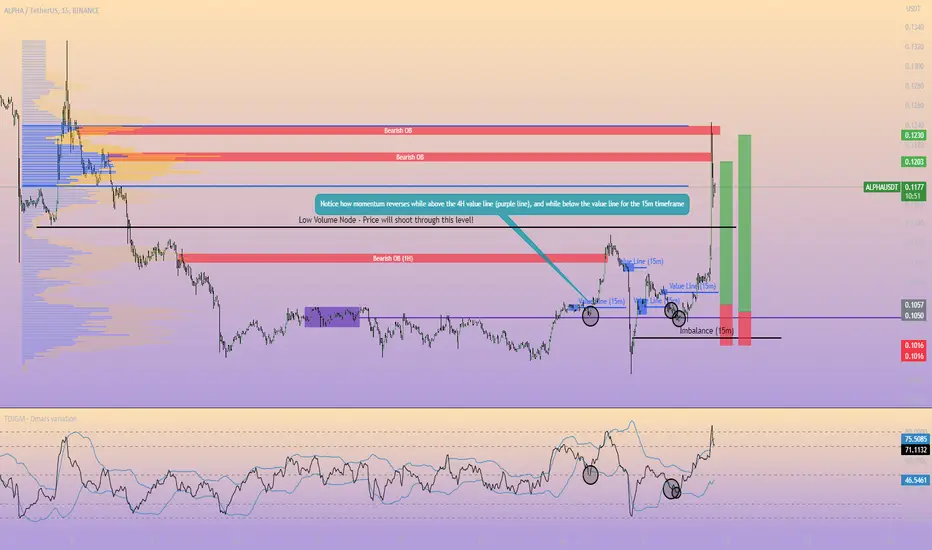
How To Trade Like The InstitutionsI wanted to prove that you can genuenly use some good trading concepts to catch trades in the market. The market is chaotic, but it's not totally random. It's an efficient market that tries to price everything as well as possible!
I used the Volume Profile from the session before the pump to find out value area (where there is most liquidity). Furthermore I found a Low Volume Node. This is a place where there is little liquidity, I know that price will shoot through this level to the next level of liquidity!
I furthermore detected some bearish Order Blocks to aim for as I am looking for longs.
The reason you would be looking for longs, is because that price was trading above the 4H value line (center of contraction). This is typically a higher low, followed by a lower high (or vice versa).
Another important aspect is to go to a lower timeframe, where you can react faster to changes in momentum. Here I used the 15m timeframe to draw more value lines.
Whenever price is below a value line for the smaller timeframe, but above the one for the higher timeframe, we wait for momentum to give us a long.
The changes in momentum for longs are marked in the circles.
By doing this, you can accumulate a lot of good setups. Your targets are typically the high levels of liquidity of the volume profile, the value area and the bearish orderblocks.
Make sure to also look for imbalances, I have linked a previous setup where this was done.
EJ BuyOverall bullish, waiting for a retracement into the the 1hr institutional candle which also resides in the previous support and 147.500 psychological level.

EURUSD Break Weak HighEURUSD is returning to a zone of demand, bollinger bands assist in identifying possible oversold conditions as it breaks through the lower band. The bands have widened representing increased volatility. Price is likely to rise above the simple moving average line and possibly break through the weak high over the next 24 hours.
Although, I am not well experienced, so please do your own technical analysis!!

Dollar index 💵 short idea base on 1hHello my friends if you saw it and make profit please share and comment 😜

EURUSD I am goning long on EURUSD around the 1.0965 price level. There is a lot of buyside liquidity to be taken. I will update my entries here 🏹🎯

SPX Looks WEAK on Daily | SMC AnalysisHey All,
These Chart Represents SMC Analysis,
I hope this might give you some insights.
_________________________________________________________________________________________________________
Black Dots Represent = High Timeframe Structure (Daily Chart)
Pink Dots Represent = Mid TF Structure (Hourly Chart)
Light Blue Dots Rep = Lower TF Structure (15 Min Chart)
Trendline Represents the Liquidity (Simply meant as Pool of Orders)
_________________________________________________________________________________________________________
🪑 Huge Liquidity (Pool of Orders) Sitting at 4200 Level 🪑
🌊Price can take (Sweep) Buy Side Liquidity, And then might continue to the Downside 🌊
⚫ Because on Daily TF (Represented by the Black Dots), We are Still on Downtrend ⚫
🔻High Probability, That the Market could continue on to the downside🔻
🤷♀️ If Price wants to invalidate this, Then it has to break 4300 Level, Then the Downtrend will Shift to Uptrend 🤷♀️
Thanks,
Happy Trading

GJ BullishLooking to take some of the downside liquidity before coming to a nice zone where we saw price consolidate before tapping in and creating this big bullish move. Thinking we will see this repeat. Plans to enter on a change of character confirmation out of this zone, however possibilities of a downside entry on inverse confirmation may be possible.

$EURUSD Possible 5:1 Scalp *SMC**SMC = Smart Money Concept. See related Ideas* It's showing willingness to go to buy side on a Tuesday meaning this could make the high for the week. I put the entry as now, put the take profit near the current high could be below, and the stop loss at the xurrent low minus the average true range and you'll get 1.88. I believe this should result in a winning trade if not at least 30 pips. even though I think i have it much more than that.
Good Luck!
OANDA:GBPUSD
MOEX:GU1!
TVC:DXY

EURUSD Looking for a run on the buyside liquidity. I am looking for a weak dollar this period. First target for DXY will be 102.2 and latter 101.8, which brings me a bullish bias for EURUSD. I will update my entry on the comments. Stay tuned!

EURUSD I am looking to short EURUSD on the grey area i have noted. I am looking for a distribution on the red area between 8:30 to 9:30 on 1 min TF.

EURUSD I am looking for a run to the upside on EURUSD today. I am waiting for more confirmations today for a long entry. I like the mitigation of DXY on the Daily opening Gap, and it is looking bearish.

$GBPUSD - Fed Rate To Rally Dollar Until 2Q *SMC**SMC = Smart Money Concept - See related Ideas for Tutorials on these concepts.
I pulled two smart Money Fibs on the latest waves. The largest of the two has a Liquidity point that could be broken by the end of the quarter as "Smart Money" or the intuitional powers that be, may push it that way. After it breaks the Liquidity Level (Below 1.20120) or near the top of the Order Block, which is also my first safe entry, then I believe The Pound will catch up and turn Bullish. So My SL is 1.18693 and Take profit is 1.25092 making it a 2:1 R:R I'm taking the Smart Money principles and risking the Most that you should at 3% of your account. Typically, you don't want to risk more than 2%. Just an FYI for any new trader that maybe reading this idea.
Happy Trading
- BXW

EURUSDI am looking to short EURUSD on one of the RED areas. I am waiting for a distribution on 1 min Time frame, the entry will be on that TF. I will update my entry and the stop loss here on the comments. I would prefer an entry on the 8:30 NY time. Stay tuned!

chfjpy buy!!!!!1hey traders , noticed that all jpy para's looking for buy
and chf jpy also
in h4 timeframe it was upward trend and we came close to recent low where our orderblock is and in 15 timeframe it broke the structure and it is indended to move forward up
poi 142.000-141.500
tp 1 143.000
tp 2 143.500
rsi also approves the idea !

gbp jpy up from 160.000 !!!!!1hey traders price broke recent high and going to orderblock in timeframe h4 between the area 160.000-159.500
the reason why we buying form there is in larger timeframe it is going up and the price where it stands right now giving us a clue that it cam be nice institutional buy level
more over rsi is shoving us that it can be trend continuation

EURNZD high probability 3.5rr short tradeHigh probability Trade (3.5rr)
Volume Spread Analyse:
1. high volume: at low in comparison to high => at higher timeframe structure
2. high volume at low in comparison to high => at lower timeframe structure
=> high volume at low => means a lot of Liquidity/ Money at low=> high probability that the price reach this levels
=> 0.382 Fib. setup validation lvl triggerd

FEB 16 2023- BUY TRADEUSDCAD buy trade
entry at 1min OB and wyckoff schematics - feb 16 2023 ---> TP feb 24 2023
-A clear demand to demand scenario because of imbalance.
TP: 1:100 RR

EURUSD This is my analysis for EURUSD today. Looking on what price will do. I am considering both longs and shorts. Depending on the Price action and what confirmations it will give to me until 8:30 I will decide which side I will support. Everything is noted on the chart.

EURUSD LONG!!Looking to buy EURUSD on this area. I will wait for a comeback and a accumulation formation on 1-5 min charts. I will keep you up to date

USDJPY SELL ON M30I see a break of structure to the downside . waiting for a pullback to the Order block + imbalance FVG created . stop loss above the recent swing high and take profit target at the liquidity sitting below. Going for a Risk to Reward of 1:2.5 on USDJPY.

EURUSD SHORTI am looking to sell EURUSD. I will wait for a distribution formation on the 8:30-9:30 time interval. It is related to the DXY setup I posted earlier. I will update my entries.
