GBPJPYI AM LOOKING A SELL FOR GBPJPY AS A TL BREAK WITH LH CONFIRMATION , LETS LOOK FOR A REVERSAL PATTERN, REJECTIONS, etc TO ENTER THIS TRADE.
CURRENTLY, PRICE IS AT GOLDEN RATIO
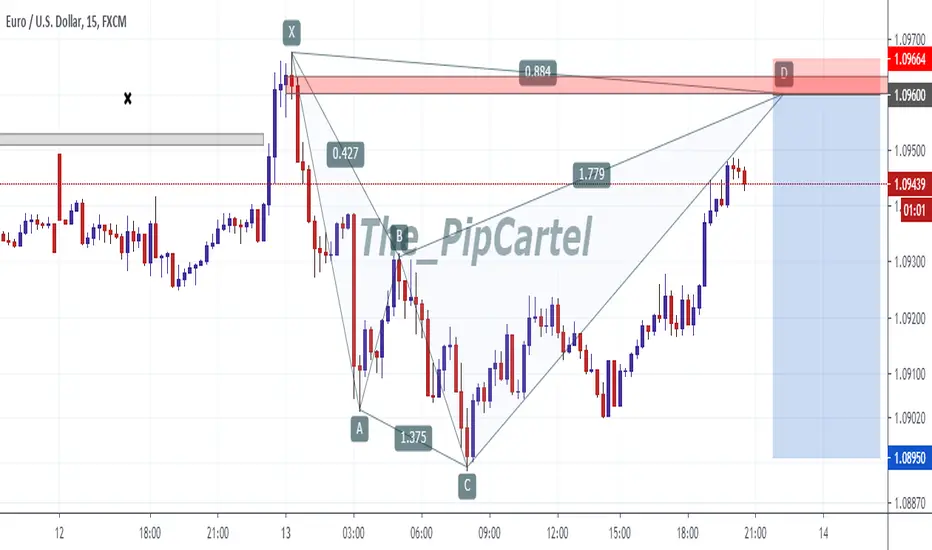
Institutionallevels


EURUSD M15 After price took out liquidity we can see as price is pulling back to institutional level, A shark pattern spotted which congruent with the institutional manipulation. Going for a quick 65 pip with a 1:10 RiskReward. Price might react towards tp or shoot all the way down, whichever way we watch the reaction.
GBPUSD OVERVIEWPrice approaching an OB (h4). Coming down to the 30 minutes time frame, a deep crab pattern is projected aligning perfectly with the 50% of h4 OB. Expecting price to drop from that zone filling up Imbalance, creating a higher low and continue the initial uptrend.


AUD/NZD Possible short for the next weeksPending orders filled.
Manage your position: look the breakeven level

BTC Market OverviewPrice is currently trapped on the is pair forming a bearish pennant kind of pattern. I'll be looking at price to do a false breakout triggering the H4 OB and then the drop. Here's my bias on BTC, comments are welcome.

AUD/USD BREAK, RETEST & GODaily chart on aussie dollar looks really bearish. We had a nice break of the institutional/key level of 0.67 and looks like price is going for a last kiss. This idea also correlates with 50day EMA. Personally would prefer some price action candlestick to take place at the propose level.
#tradesafe

🔔 GBPCAD LONG-TERM SHORTOn the weekly timeframe, we can see the weekly IC level had attacked the previous high made in April. This gives me a reason to believe there was some sort of manipulation play and therefore the price may magnetize towards this region to satisfy that IC level.
However, price may ignore that level for now as there is another set-up playing out in the 4HR timeframe whereby price is creating a bullish corrective wave that is estimated to lead to the 50% of our IC level which is our Optimal Point of Entry (O.P.E). This is a long-term swing trade so the reward is between 1000-2000 pips.

🔔 USDJPY LONG-TERM SHORT We have an IC point at the top of the swing right above an Imbalance in the market where I would like to see price close the gap in the market which is highly anticipated. A move upwards to 111.960 (our O.P.E) will mean a move into the 978-886 fib region which is a region of high reversal. This set-up may work or we could potentially see price drive higher to our 11.850 IC level to satisfy that candle. If this set-up is successful, we would have a 30 pip risk for a potential 860 pip swing to our -0.27 golden profit level; 1:28 risk/reward ratio.

🔔 USDCAD SHORTUSDCAD short position now activated as our daily IC region was satisfied. I now await CAD weakness to allow price to dive and created a retracement of the bullish impulse it has been creating for the past few weeks.

🔔 USDCAD SHORTWe have two EQH's that formed below our IC region. I'd like to see price spike upwards 60 pips taking out the liquidity of both the EQH's and also taking out the sellers of the accumulation playing out on the 15min TF. I will look to execute this trade noon tomorrow at the start of the New York session with all the medium-impact USD. With a 30 pip risk and 250 pip potential reward, we have 1:8 r/r.

🔔 EURNZD 🔔 EURNZD
Speaking from a weekly perspective I am overall bullish for EURNZD as we have a 900 pip retracement to fulfill for the previous bearish impulse. Price has created three distinctive higher lows and I would like to see this move Euro strength push this pair to the upside. In the meantime, there is a smaller set-up playing out in the lower timeframe, and that is these three drive up towards a potential Institutional region where I would look to short price to 1.6700. I have reason to believe that price will be magnetized to the downside in the short term to fill the gap in the imbalance and to satisfy the IC region before making its bullish wave. The short consists of a 30 pip risk and a potential 250 pip reward with a 1:8 r/r; the long consists of a 40 pip risk and a potential 850+ pip reward (long-term swing), with a 1:21 r/r.

🔔 EURCHF UPDATED POSITION🔔 EURCHF UPDATED POSITION
EURCHF has reached our weekly SC region and I am now looking for long opportunities. I would like price to spike up to 1.07610 and take out the seller's liquidity and return to around 1.06850 to add to the long position which is at the 786 fib level for extra confluence. Seeing as we have medium-impact Euro news release to the end of the week I will look to enter long positions during the New York session on Thursday. With a 30 pip risk and a potential 280+ pip reward, we have a 1:9 r/r.


AUDCAD ShortSmart Money Concept. How the banks trade your money.
Update from the very last AUDCAD Long setup. Enjoy :)

USDCAD Institional LongLooks to me as if the institutions are taking
price to the upside, In lue of the Long story,
What seems to have played out is the sell off
right before the up move. Giving us the buy
entry Between the 1.29 and 1.30 levels. Since
there has been tell tale signs of institutional
sponsorship, we are looking for more upside potential to USDCAD


