IXIC Testing Resistance/Weekly IdeasIt looks like the IXIC might be making itself a new downward trend. Possible bearish flag after the initial selloff over the last few weeks. This week I will be looking for the IXIC to break up through the downward trend line and then the 13610 resistance line. If it fails the trend line, I think we will have more of a gradual downward trend, but if it fails 13610 and double tops, that could mean a large fast movement downward. This time it may drag the SPX/DIA down with it.
On the downside we have some protection at 12610. Whether we do or don't test either resistance level, if it finds support here, this could indicate a strong bullish reversal. However I think that to be unlikely given the valuation of the market today and the necessity of a correction to maintain reasonable valuations in the tech sector. Unfortunately, the rest of the market will probably get caught in the crossfire.
I am also watching the SPX for a probable normal dip along its trading trendline. Looking for some possible short plays there.
Looking for a possible bear PCS on INTC this week as it tests previous resistance line for support in rising wedge pattern...
Another possible bear PCS on AGI this week or early next as it shows a bearish flag in an overall downward trend while showing overbought on the Stoch. Will probably look for a MACD crossover before entering into the position. This will be especially effective if it tests and fails the downward trendline this or next week.
Also looking for entry on a PCS for BK after failing $47 and a bearish crossover in the Stoch and one possibly forming on the MACD.
Looking for a similar play on ED after possibly failing resistance for 3rd time while showing overbought in Stoch with a bearish crossover.
Everything of course seems to be dependent on the TNX so keep an eye out for more panic selling with rising rates.
INTC

INTC-RM (MOEX) - Be CarefullGreetings
Humbled, we would like to thanks for your support who has already liked, commented and followed us. Your support, strengthens us, to help in analyzing the market. If you have any questions, do not be hesitant to send us message (inbox). Our Service : Signal recomendation, Trading Course, Portofolio Consultation for multi asset such as Stock, FX, Derivative, Crypto, etc. If u are newbie on the stock market, do not be hesitant to contact me at Private Message. Our Job is to make u Prof trader and proftable trader.
Strategy
- Please care for Money Management
- Have a good psychology
- Do not be hurry to open position
- Evaluate and upgrade your trading plan
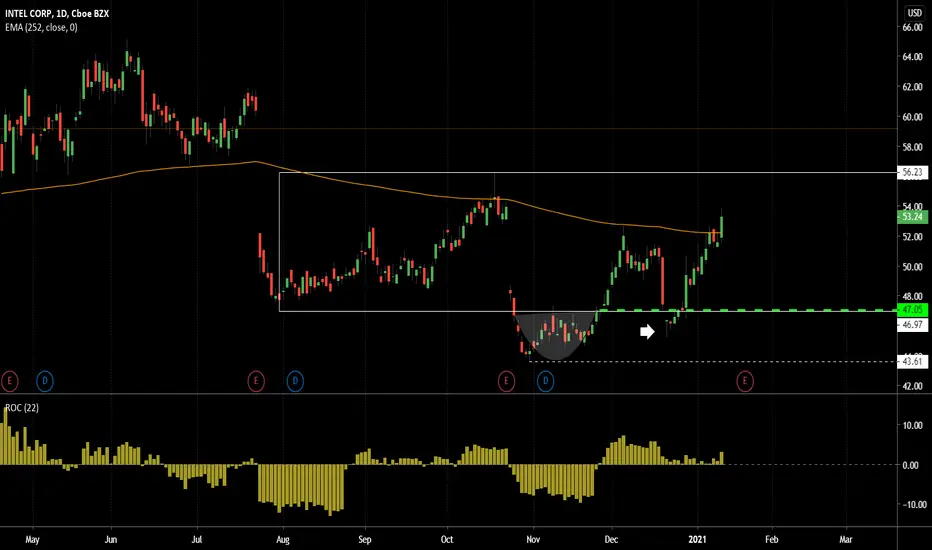
INTC-RM (MOEX) - Be Carefull

Cup and handle in Intel Potential gain:10%
Reward/Risk:2.9
Timeframe: 1-2 wks
I always try to present the charts in a simple comprehensive format to prevent any confusion.
This is just my technical view, neither a fundamental comment,nor a recommendation to trade..!
Please review my track record and calculate the odds for yourself..!
You’re likes and comments encourage me to continue this.
Stay tuned great live stream and quality content videos coming soon..!

INTC: looking for a breakout, $70 could be nextGreat chart here for INTC - bouncing off nicely from the $60 level and breaking smoothly (and with strong momentum as shown by the UTO) thru the supply/demand "balance line" at $61.5 ..
we hope to see a continuation of the move up - to be confirmed by a breakout of resistance at $63.5 - maybe today or tomorrow..
Price projection: this was a measured move of $16 from the low set in late Jan of $54 = a short term target of $70 if that move materializes
let's keep watching this chart ... and see if these projections hold.


INTC - PUTS Options REAchedBeautiful execution price targets met easily and fast.
Great rejection where you could of grabbed OPTION CALLS contracts
More to come
* Well meet again* At&t chart drop tomorrow. Currently bearish


Faith and Passion: INTCHave you ever been at a party and talked to a very intelligent person about their specific field of expertise? Those conversation can get very long and hard to follow...
Last night I had such an opportunity to speak with a software developer that knew a lot about Intel's chip architecture. He was incredibly passionate about NASDAQ:INTC and its future product releases. I asked him if he thought they would reclaim their crown as the top chip manufacturer and after a lengthy explanation of all the different ultraviolet laser chip making methods the answer was "Yes!" Independent of the recent bullish news of the CEO leaving I started a stake in the company.

INTC - PUTS OptionsOptions Bearishness for NASDAQ. Attention goes to tech sector. Intel had a good run last week. Unexpected climb almost a full $10.00 bull move. Should retrace to re-balance and fill pending orders that got stuck in the gap up.


OPENING: INTC APRIL 16TH 37.5/FEBRUARY 19TH 45 MONIED LCD**Long Call Diagonal
... for a 6.83 debit.
Notes: The smaller account, skip month long call diagonal referenced in my INTC (IRA) Post (See Below). Buying the back month 90, selling the front month monied 75.
Metrics:
Max Profit: .67
Max Loss: 6.83
ROC at Max: 9.8%/70.1% annualized.
Break Even: 44.33
Delta/Theta: 17.45/1.4

OPENING (IRA): INTC FEBRUARY 19TH 42.5 SHORT PUT... for a .70/contract credit.
Notes: As with my BA trade (See Post Below), targeting some options highly liquid single name for premium selling. Here, it's the beaten-down Intel, with the short put lining up nicely below support. 30-day at 44.8%, expiry-specific at 41.6%. I generally like to sell premium in single name at >50% implied, but occasionally settle for less when there's nothing better "at the top of the board," so to speak.
One of my New Year's resolutions is to not be so lazy with these plays, so compared monied covered call setups with delta metrics similar to those of going naked short put, the advantages and/or disadvantages of going with a particular expiry over just defaulting to the monthly, and whether something like a long call vertical or long call diagonal would make any sense here. I used to do these comparison and contrasts much more often, but it takes some additional time, but thought I'd set out the basic process of deciding what setup to go with here, even though I'm probably not going to do that with each and every trade I take.
COVERED CALL VERSUS NAKED SHORT
The February 19th 42.5 covered call would have a max profit of .60 currently with a break even of 41.90; the 45 monied, 1.14, with a break even of 43.84. For contrast, the 42.5 naked has a 41.80 break even, so you get a smidge (.10) more out of going naked versus going with the 42.5 monied. The 45 monied, with a 2.6% ROC at max, has a better return, but a break even that is nearly $2 higher than both the 42.5 monied and the 42.5 short put, so the trade-off there is less room to be wrong and therefore a higher return on capital. Both of these types of plays, however, have high buying power requirements, particularly in a cash secured environment, with the cash secured naked short put costing 41.80 to put on, with its primary advantage being ease of trade of management.
CHOICE OF EXPIRY
The other thing I've tended to be lazy with is choice of expiry. Here, there may be an advantage to "shopping" for the highest implied expiry, which -- in this case -- isn't the February 19th monthly; it's the expiry nearest Intel's earnings announcement, which is the January 22nd weekly with an expiry-specific implied of 47.1%. To get any short put to line up nicely with that support around 44, you're going to have to sell something like the 17 delta 44, which is paying around .52 right now for 23 days' of "work." On an annualized basis, you're probably going to get more bang for your buck out of going with the January 22nd versus going with the February monthly, which is more than twice as long in duration. The January 22nd 44's ROC%-age is 1.12% at max; 17.8% annualized while the February 19th 42.5 is 1.67% ROC at max, 12.0% annualized. Again, however, the trade-off is less room to be wrong versus getting in and out of these plays rather quickly to maximize annualized return on capital.
LONG CALL VERTICAL/LONG CALL DIAGONAL
When working with smaller accounts, long call diagonals have been one of my favorite plays to go with when I can't or don't want to afford a covered call or a naked short put, but want to do something synthetically that mimics a covered call. Given where Intel is at currently, I think it would set up nicely for either a one-off long call vertical or diagonal. Here's a couple plays with similar delta metrics to going with a naked short put with a delta value of between 16 (2 x the expected move) and something more aggressive, like a 30 delta.
The first example is the February 19th 37.5/45 long call vertical with a delta metric of around 20. A 7 1/2 wide, it would cost around 6.55 to put on, with a max profit metric of .95 and a 44.05 break even with a 14.50% ROC at max -- a whopping 103.8% annualized. What's not to like? The primary disadvantage is that one generally doesn't "manage" one-off debit spreads -- they either work fantastically or you take them off for a loss (e.g., 2 x max profit). Naturally, you can go with something far less aggressive than a monied, but one of your goals here should be taking profits relatively quickly, churning in and out of plays to maximize return on capital, rather than sitting out endlessly in an underlying without locking realized gains in on a regular basis.
The second, a diagonal, where you buy a high delta, longer-dated back month call and sell a shorter duration call, working it like a covered call. My general preference is to go at least "skip month" in duration for the back month, so I'd probably buy the April 16th 37.5 (90 delta) and sell the February 19th 74 delta 45, yielding a net delta metric of around 18. As with the static long call vertical, it's a 7.5 wide, but going longer duration with the back month costs a little more. Here, the whole setup costs 6.78 to put on, with max profit being the difference between the width of the diagonal (7.5) and what it cost to put on (6.78) or .72, an ROC%-age of 10.6% at max, 75.9% annualized. The advantage here is that you have opportunities to roll the short call to reduce cost basis further and therefore increase your ROC, but have a timer of sorts when you will have to exit the play, win or lose, at April expiry.
Here, I'm taking the "ease of trade management" route,* but will consider doing more monied short call verticals and/or diagonals going forward, particularly in some of the smaller accounts I'm working.
* -- To be completely honest, I hit click and send and got a fill before doing this post, but may do a separate play in one of the smaller accounts I'm working.


The power of patience I bought intel on a reversal trade at 47.05 in late November. The trade started of well with a big surge in early December only to give up all the gains by December 21. I stuck with the trade though because the broader reversal play back into the range was still intact- price held above the lows of 43. By the beginning of January the gains returned and on the news this morning the stock has now broken out the top end of the range near 60. As long as the stock can hold 55 now that its up here there should be clear skies ahead.
INTC -- iron condor over againI like doing iron condors on Intel all the time and consistently just keep rolling them out. Never a huge risk play with Intel in my opinion with smaller spreads but always adds a little daily theta to my portfolio.
I don't do a lot, really none at all, Elliot wave counts with Intel. Recently, I just draw supply and demand zones and trade the range.
My play: will look to enter an iron condor tomorrow, looking to sell the $57.50 strike call to upside (buy 60) and sell the 47.5 strike put to downside (buy the 45). Simply approach play and not throwing a lot at it. Something to balance out portfolio a bit and grab some daily theta. Earnings are approaching, however, but will still look to enter this play.

INTC looks readyINTC could be setting up for a big move.
The dip below the 50 mark was eaten up fast. Usually INTC is not a fast mover, also closed above the 200 ema today.
Watching for a break and hold of 52.76 to go long.
PT1 54.67
PT2 56.23
PT3 58.70
PT4 gap fill over 61

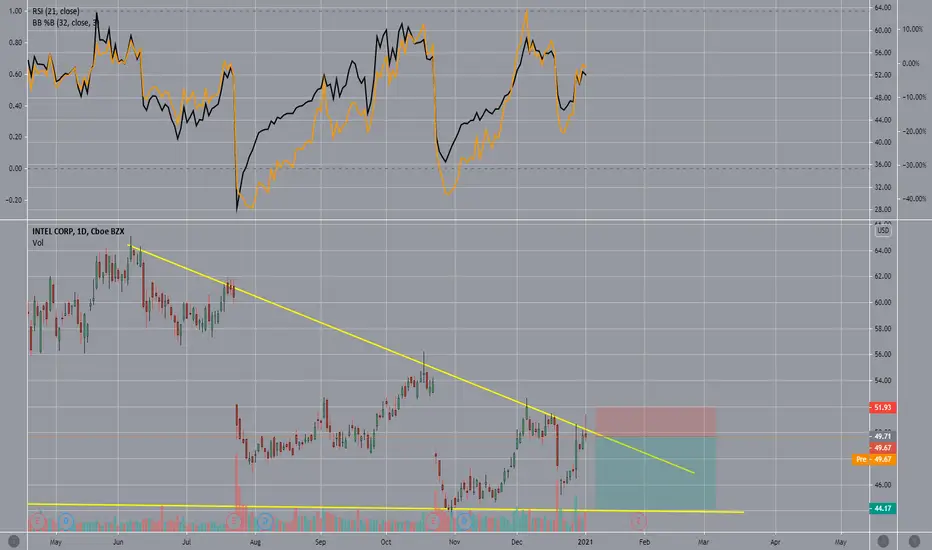
$intc 2-3 month shorttop of trend short here $intc loss limit 51.93 take profit 44.25
timeframe is long though 2-3 months
INTC - INTEL - NASDAQMy idea it will go up!
Just in case, under the blue line you should stop-loss!
I wish you good profit!
Thanks
Important Notice
- The index, stock, commodity, etc. I share here should not mean that I personally take a position.
- It is important that my shares are not interpreted as buy-hold-sell advice in any way.
-Please process according to your own risk appetite
-You can send me a direct message for your financial, technical or training requests.
- Liking the shares and following the account is an important indicator for the continuation of the shares.
- All the works I have shared; all the information, drawings, graphics and comments, the notes I have taken for myself and / or my experiments on technical analysis , my training notes.
Legal Notice
Investment information, comments and recommendations contained herein are not within the scope of investment consultancy. Investment consultancy service: It is offered within the framework of an investment consultancy agreement to be signed between brokerage houses, portfolio management companies, banks that do not accept deposits and the customer. The comments and recommendations contained herein are based on the personal opinions of those who make comments and recommendations. These views may not be suitable for your financial situation and risk and return preferences. Therefore, making an investment decision based solely on the information contained herein may not produce results in line with your expectations. Nevertheless, I cannot be held responsible for any direct and / or indirect damages, loss of profit, moral damages and damages that may be incurred by third parties, which may be incurred by investors as a result of the use of the information on the site and the resources used for the site


Will Intel go Nokia's way?#INTC is under pressure from AMD, NVIDIA and now Apple and Microsoft.
To start the uptrend #INTC needs to break the resistance line around $52.
If drops below 43,50 there is way down to 36,50 and 27 as seen on multi-year charts.
Would make sense to cautiously buy around 43,50 with stop at 41,50 in hopes for the better for Intel.
