INTC

Can the run continue?When the model signaled buy late last month I will admit I didn't think it would be one of the better positions but to my surprise it has. We don't trade on narratives or fundamental analysis so we have no explanation for the move but the question is where from here? We would like to see it fill the earnings gap but nothing moves in a straight line. We can expect some chop potentially but as long has it holds $49 it will remain in the portfolio
Ingenuity Trading Model is an algorithm used in- Stock, Forex, Futures, and Crypto markets. The model is a Geometric Markov Model : Focuses on reversal and continuation wave structures
In probability theory, a Markov model is a stochastic model used to predict randomly changing systems. Markov Models are used in all aspects of life from Google search to daily weather forecast. The randomly changing systems we focus on are the equity, futures, and forex markets. The geometric element of the model is the fractal sine wave structure you can find on any chart you look at across any market and across all time dimensions.
Our model focuses on the current sine wave formation (current state)- geometric price formation along with its volume and volatility over a given time period and using that information to predict the future state- future price movement. For questions or more information feel free to contact me in the comment section or via private chat

$INTC Daily MomentumJust thinking about it, what have more people been doing more than ever? Using the computer & internet and with that comes parts nessary for computers to work. Intel chips are found just about everywhere, computers, phones, cars, all sorts of things. So with that in mind more people now than ever are buying new tech in 2020. Its the mark of a decade & I know people want to upgrade or just get the latest and greatest. So with that in mind I have no doubt stocks like
$AMD $INTC $NVDA $MSFT $TTWO $CRSR $SNE will continue to see substantial growth in 2021.
Option ideas
.INTC210115C52.5
.INTC210115C55
.INTC220121C60

INTC longINTC near bottom of range, lower risk, higher reward trade. Entry 45.50 and is negotiable + or - stop firm at 43.00 and sell target at 53.00. RRR 3. Bullish divergence on the RSI on the daily and weekly. Seller exhaustion on the MACD.

Rebound in INTC I think there is a possible rebound towards the MA200 in the short term. A good risk/reward ratio, with target price = 54 and stop loss in case it breaks the big support on 43.

Intel stock price forecast 2020To many investors’ surprise, Intel stock has been beaten up badly in the past months. However, not too many traders will know why Intel stock cannot drop below the $42 price level. Many short-term and intraday day traders will think of potential short scenarios now that the momentum has “turned” against the company.
The momentum has turned against Intel stock? Well, if you think the momentum has turned against is because you are probably looking the smaller timeframes and you are only seen noise and chaos without any apparent direction. Direction trading on stocks is critical, if price action analysis and supply and demand is added as tools in your trading arsenal, you will see things in the stock market that have always been there but you were unaware of.
Although everything looks good for the company, as a dividend growth stock, it wasn’t appealing because of its combination of low dividend yield and relatively low dividend growth rate. That should be taken into account only if you are interested in buying shares of stock that provide a high dividend yield. Intel stock is one of those stocks to own because we like it or not, their processors are in most desktop PCs and Apple Mac.
What is a good price for Intel INTC? The imbalance created back in 2018 has been holding several pullbacks and it seems that Intel stock is about to rally again from that same price level and imbalance.
Find below a supply and demand stock analysis for Intel stock (NASDAQ:INTC). The attached chart is the monthly timeframe. The imbalance at $45.97 has been holding the stock price for a few years. Going short against it is suicidal. Only buying shares of Intel stock is possible. It’s not the clearest scenario, but no shorts at all.

INTEL - sleeping giant!Intel (INTC) Down 15.8% Since Last Earnings Report: Can It Rebound?
Zacks Equity Research
Sun, November 22, 2020, 12:30 AM GMT+8
It has been about a month since the last earnings report for Intel (INTC). Shares have lost about 15.8% in that time frame, underperforming the S&P 500.
Will the recent negative trend continue leading up to its next earnings release, or is Intel due for a breakout? Before we dive into how investors and analysts have reacted as of late, let's take a quick look at its most recent earnings report in order to get a better handle on the important drivers.

Buy Signal: 47.06 #stocksIngenuity Trading Model used in- Stock, Forex, Futures, and Crypto markets. For Stops and overall trade management join the club.
The model is a Geometric Markov Model :
In probability theory, a Markov model is a stochastic model used to predict randomly changing systems. Markov Models are used in all aspects of life from Google search to daily weather forecast. The randomly changing systems we focus on are the equity, futures, and forex markets. The geometric element of the model is the fractal wave structure you can find on any chart you look at across any market and across all time dimensions.
Our model focuses on the current wave formation (current state)- geometric price formation along with its volume and volatility over a given time period and using that information to predict the future state- future price movement. For questions or more information feel free to contact me in the comment section or via private chat


Really good entry for INTC BULLSWe can set 2 entrys to this strat, 1ST now ($45.21) assuming price will fully respect the long-term support and 2ND entry with the old min trying a duble floor.
SL 1ST Entry: $42.83
SL 2ND Entry: $41.94
OBJ: Old Max $65.11
Long Term Invest


RECAP on $AAPL So as predicted again. WE got the consolidation under resistance on the daily and finished the day choppy and without a decision on where AAPL wants to go. That is represented in the Spinning Top Candle on the daily where buyers and sellers tried but no one won. We didnt get the usual AAPL pump but with so much overhead on the chart it couldn't be done without conviction. The probability of AAPL seeing downside relies heavily on the movements of SPY, but if we get a market wide pullback we could see outselfs at support quick. A break here would have us under the EMAs and my HULL indicator. We will see if anything yields from the bullish spinning top, Any upwards movments from SPY could send us over the daily resistance and up on a bullish trend! Happy trading!

$AMD. A great buy!This stock has taken a beating since its event and purchase of $XNLX and it retested that support, bounced and broke resistance. My price targets I tried to mark out in this video, and alot of these are smaller so if you are scalping then pay attention to those big ones, and fill in on the smaller time frames. $AMD is a no brainer. Great CEO, profits, expansion, and good products. im long $AMD

Great Buy on Intel. Here is the setup.Td9 on the daily, previous horizontal support, fibonacci calculator setup, megalodon momentum and volume setups, and insider buying. Seems to be the time to accumulate.

INTC LONG TERM TRADEWe have the stock on levels of 2017, its a long term set up with a juicy R:R of 8.23 and a profit expectancy of 50%.

AMD Earnings Play, Bull triangleAMD Bullish triangle forming, should run up for earnings and as consequence of INTC earnings today if disappointing. Ideally buy friday at close for the next week. Should also retest the lower structure before trying to breakout. Dont rush, needs to cool off red momentum, wait for a clear signal of reversal.
PT1: 88$ (feasible)
PT2: 94$ (extended).
Market is in a very precarious position, so be careful and watch for INTEL earnings results.
STOP if market crashes.

Descent in the DJI (October 26th-Nov 9th 2020)Dow Jones Industrial Average Index (DJIA) (October 26th through November 9th 2020)
Low: 27,843.7 points
High: 28,374.2 points
May have been way too ambitious with my last DJI projection, have now since adjusted for short term just to see where we are for my own learning purposes.
Thanks for tuning in :) Disclaimer, I am not responsible for any losses incurred while attempting to use my data, I hope this can prove to be some sort of learning tool for some and give insight as to how I personally come up with my own numbers. Take into full consideration this could be a completely bad forecast. Cheers

Intel Stock AnalysisBased on Technical analysis, just hold for now before going log as per tentative bullish trendline or channel theory.
Intel — Shares of the chipmaker lost more than 11% after Intel reported weaker-than-expected revenue for its data center unit during the third quarter. The company also reaffirmed the delay of its next generation chips. Intel’s overall earnings and revenue results were roughly in line with projections.
NASDAQ:INTC

INTC Elliott Wave & Fib Retracement | Week #43For INTC this week MACD turned positive and stock is above Fib 38.2% as of 10/15/20. High chances that it will close the week by staying above that level. This combines with AMD stock which has almost run out of steam (Check its MACD). There is high likelihood that INTC reaches its 50 Day MA next week (10/19/20 - 10/23/20) and also touch Feb 50% which might conclude the 3rd leg of Elliott Wave which started in week of Aug 3rd. Core Retail Sales & Retails Sales number are due tomorrow (10/16/20). If these numbers are better than expected it will support the positive move in the stock. Intel currently dominates laptop market with wide variety of laptops to choose from. This means there is 3% ~ 5% upside from closing price of 10/15/20. (This is a weekly chart)
(This analysis is just my point of view. Trading involves risk. Do your own research before trading)
drive.google.com
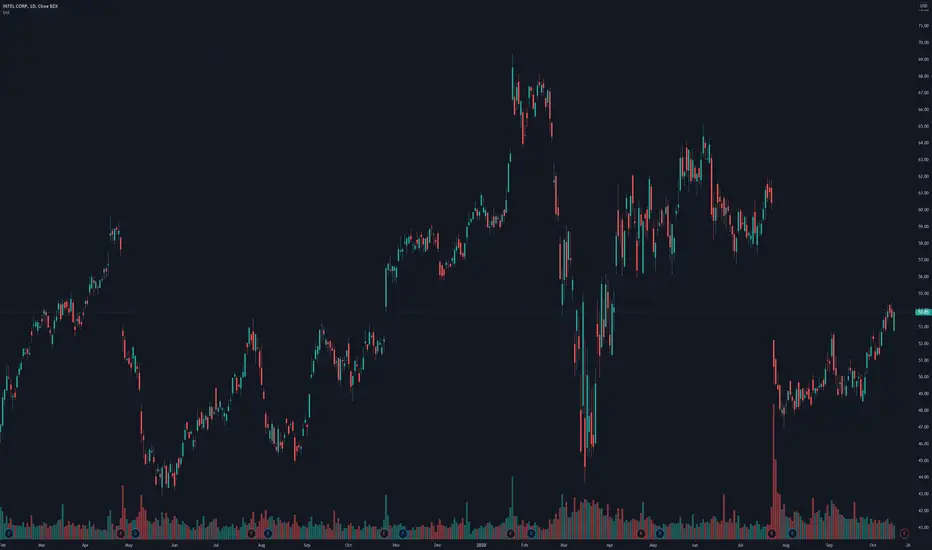
BUY INTEL (INTC) on any dip towards the $48 support areaBy looking at the daily chart, we can see the strong bullish rally that took the price from the March 23rd lows of around $44 to the June highs at $64, for an outstanding 45% increase in just couple of months. However, the stock didn’t stay there for long as a combination of a high profit taking interest and some further selling pressure took the price down again at the end of July to the $47-48 strong horizontal support zone. Since then, we have seen a volatile and choppy sideways price action between $48-52 levels.
The stock is currently sitting at the $54 mark after an attempt to make an upward break out of the above-mentioned range. However, we see multiple different and also strong resistances that are currently threatening the current bullish move. We can find the 100 DMA lying at the $54 mark and the strong horizontal resistance at $56. Today’s price action on the daily chart shows a bearish rejection candlestick, which in turn confirms the strength of the above-mentioned resistances and indicates that there might be further selling pressure ahead. This up move was anticipated as the stock built a meaningful support base around the $48 mark throughout the last couple months. However, we believe that the stock market in the US currently holds a lot of intrinsic risks - COVID-19, the upcoming presidential elections, the economic recovery etc. - which would probably mean that we could be in for a continued sideways and choppy price action in the coming months. At any rate, we our analysis shows that the uneven capital allocation across the different market sectors will continue to support the tech sector as well as the stocks in it. The large institutional investors will start looking for places to reinvest the tremendous profits that they have generated from the likes of ZOOM, TESLA, NETFLIX, Shopify etc. throughout the last 3-6 months, which will lead them to stocks like INTC!
We are bullish on the INTC’s stock and believe that any profit-taking corrections would give us a great opportunity to buy the stock at a good discount. This, in turn would give us a chance to maximize our profits to the upside, once the stock resumes its uptrend movement. Furthermore, some of the technical indicators that we are monitoring closely (50 DMA, 100 DMA, Bollinger Bands, RSI etc.) are currently showing exhaustion of the recent up move and are signaling that a potential return-move to the $48-52 range might occur very soon. This will be the right time to jump on the bullish Intel train, that will take you up to the $60 mark in the coming weeks and months.
Our long-term target levels are $61 and $66 respectively.
Sincerely,
DowExperts

Intel breaking out Technical Analysis
INTC breaking out of a consolidation channel after its drop due to disappointing earnings.
RSI confirming breakout; at 62.
Intraday volume is above its 10sma average.
200sma lining-up with previous tested support. Breaking this resistance , would take us into next parallel channel.
Attractive risk-reward-ratio at 2.5, placing a stop-loss just below channel top, and profit-exit around the 200sma.

Intel headed towards $60 per share.Intel and AMD are basically only two good CPU manufacturers and they have no real competition, although I favor AMD, I am bullish on both these companies.
I look to buy the break of $53 per share and take profit below $60 per share, overall almost 12% profit.
Good luck with this trade!
Tibor
