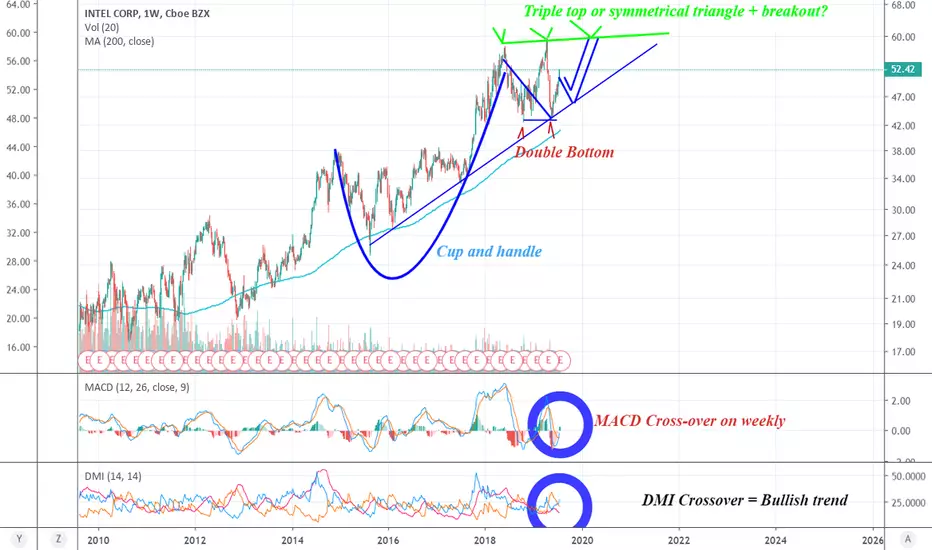
#VolatilityWatchTechnical indicators looking bullish for #intel. Weekly chart shows recent MacD Crossover, with Directional Movement indicator (DMI) crossover suggests bulls have control of trend with $INTC. INTC is currently trading above the 200 day moving average, which has acted as support but is not support traders should be watching. Previous pattern suggests Intel will continue to build out a symmetrical triangle pattern along with a current cup and handle formation where #INTC would get close to testing the $60 level. On the other hand, at this $59.92->$60 price level there is a potential triple top to watch out for as it could be a point where shorts would start piling in. On the event of a breakout, INTC could easily be trading back above $60.
Downside risk seems minimal if you are a long term investor. Watch for 618 retracement to continue uptrend. This would also take price to long-term support at $46 and I believe this would make a very compelling value play for investors and funds who are still sidelined.
Follow me on Instagram and Twitter @VolatilityWatch
Like and follow so I can continue finding awesome trades. Thank you in advance.
Disclosure: I do not own INTC. I am not a financial adviser and this is not note to buy or sell. Please do your homework before investing.
INTC
Meeting with tech executives on Huawei ban at White House - NewsReported by Reuters
White House economic adviser Larry Kudlow will host a meeting with semiconductor and software executives on Monday to discuss the U.S. ban on sales to China's Huawei Technologies Co Ltd , two sources briefed on the meeting said on Friday (July 20th).
Treasury Secretary Steven Mnuchin will also attend the White House event, to which chipmakers Intel Corp and Qualcomm Inc have been invited, the people said.
The subject of Huawei was expected "to come up but that it is not the reason why they are convening the meeting," said the official, who spoke on condition of anonymity.
The future of U.S. companies' ties to Huawei, the world's no. 1 maker of telecommunications equipment, remains uncertain after the Trump administration put the company on a blacklist in May, citing national security concerns.
One of the people briefed on Monday's meeting said Broadcom Inc was also invited to the White House event. Microsoft Corp was also expected to receive an invitation, the person said.
-----------------------------------
*We could possibly see some volatility this week with this meeting.

Good buy for potential 5-15% on INTCGood potential for buying INTC. Has been on upward trend over the past couple weeks with no break in pattern. Buy next week for a potential 5-15% return.


INTC AnalysisDecending wedge breakout possible here for the bulls or bears... keep watching for rsi to diverge and break trend lines 1st... $42 area must hold or plummet occurs... spot is $54.00 that looks ripe and sweet or $42.00 which makes for queezy stomachs for holders.

INTC stock price forecast timing analysis by pretiming algorithm27-Jun
Price Forecast timing analysis by pretiming algorithm of Supply-Demand strength
Investing position about Supply-Demand(S&D) strength: In Falling section of high risk & low profit
Supply-Demand(S&D) strength Trend Analysis: In the midst of a downward trend of strong downward momentum price flow marked by temporary rises and strong falls.
Today's S&D strength Flow: Supply-Demand strength has changed from a weak selling flow to a suddenly strengthening selling flow.
read more: www.pretiming.com
D+1 Candlestick Color forecast: RED Candlestick
%D+1 Range forecast: 0.2% (HIGH) ~ -0.7% (LOW), -0.3% (CLOSE)
%AVG in case of rising: 1.4% (HIGH) ~ -0.7% (LOW), 0.6% (CLOSE)
%AVG in case of falling: 0.3% (HIGH) ~ -2.1% (LOW), -1.4% (CLOSE)
Price Forecast timing is analyzed based on pretiming algorithm of Supply-Demand(S&D) strength.


INTC Has Massive Gap to Run DownINTC not only had a poor earnings season, but it also faces challenges from recent new tariffs in China. Intel’s stock price has fallen back to the lows of December 2018. This should provide support for the stock due to fundamentals.

INTEL - The Strong Support and New Buy OpportunityThe market made a huge gap and it helped the price to reach a support zone. This zone is between SMA100 and SMA200. It also includes 50.00 support level. The price reversal from this zone will be able to give a possible buy opportunity.
RSI line is at the oversold zone and it will be able to give us a good confirmation for the price reversal. MACD histogram also will be able to support an upward movement as soon as we will get several bullish candles.
If the price drops below SMA200, the trading ideas based on the reversal from the support zone should be changed into a new one.

INTC: New high likely to shift sidewaysINTC is in the 5G competition this year. It has moved out of a short-term sideways pattern to a new high, but not a new all-time high. The previous all-time high of 2000 was approximately $75.00. VWAP orders are likely to chase. The pattern may shift sideways again.

AMD ready for move to $12?Analysts do not have an economic slowdown priced into their fiscal year 1 & 2 earnings estimates.

MSFT still looks higher but reducing exposure is wiseThis is a company that showed up on our radar last December, its performed fantastically since!
Near term risks are present so do yield caution.

AMD: The cost of doing businessWhen you short a stock you are taking on infinite risk, if the roles were reversed I would not be as tactical with this position. For now, it looks like we will trade slightly higher before another opportunity to short appears.

Weekend Review of AMDDespite Friday's low test candle, the weekly charts continue to look very weak.

INTC - LongEntry = Break above breakout. I'll get in if I see its finding support at the bottom of the channel
and moves above breakout level.
Target 1 = 54.30
Target 2 = 55.19
Stop = Close below breakout level

Riding the Semiconductor trend with Intel (INTC)- broke above a double bottom pattern
- MACD turning positive
- semiconductor sector is outperforming the overall market

SOLD 3 MILLION SHARES. $25 MILLION PROFITWE WERE AND STILL ARE BULLISH ON MICRON BUT...
OUR AVERAGE COST WAS DOWN TO AROUND $30.77 AFTER LOWERING OUR COST FROM THE HIGHER PRICES WE PAID, UPWARDS OF $59 A SHARE
THE STOCK WENT UP OVER 10 POINTS WITHIN A SHORT PERIOD OF TIME
NOW, THE NEGATIVITY RETURNS TO THE CHIP SECTOR FROM DOGS LIKE NVIDIA...WE MENTIONED IN A PREVIOUS POST NVIDIA WAS A BUBBLE AND NOW OUR POST IS COMING TO LIGHT
NVIDIA HAS LOWERED REVENUE HOW MANY QTR'S NOW? WE WERE RIGHT WHEN WE POSTED NIVIDA WAS OVER PRICED AND WE ARE STILL RIGHT TODAY!
WE CLOSED OUR ENTIRE MICRON POSITION SELLING 3 MILLION SHARES
AVERAGE COST: $30.77
PROFIT: $25.5 MILLION
WE STILL FEEL MICRON WILL TRADE UPWARDS OF $100 IF YOU HOLD THE STOCK FOR THE LONGER TERM
AS FOR THE BUYOUT, WE WOULD LOVE THE WESTERN DIGITAL / MICRON MERGER RUMOR THAT WE HEARD ABOUT COME TO LIGHT, THAT WOULD BE ONE AMAZING COMPANY COMBINED!
BEST OF LUCK TO THE LONGS!
BULLS MAKE MONEY, BEARS MAKE MONEY, PIGS GET SLAUGHTERED! - DON'T BE GREEDY

Intel Releases their Annual ReportINTC Annual Report
Five years ago, we set out a strategy to transform from a PC-centric to a data-centric company. Our 2018 results serve as a strong proof point that our strategy is working and our transformation is well underway. We achieved record revenue and earnings per share (EPS), driven by strong business performance, continued operating leverage, and a lower tax rate. Revenue from our data-centric businesses collectively increased by double digits. Our PC-centric business grew above our expectations and continued to be a source of profit, cash flow, scale, and intellectual property (IP). While we have had delays in implementing our 10 nanometer (nm) manufacturing process technology, we have continued to innovate in our 14nm products, introducing leadership products that deliver more value to our customers. We've expanded beyond PC and server businesses with significant growth in adjacent products, and gained share in an expanded $300 billion TAM1. Our employees are executing to our strategy by developing compelling technology and delivering innovative products to our customers, enabling strong financial growth.

INTC: Earnings, 5G and HFT Gap RiskIntel is moving rapidly to capture the 5G market, along with Verizon. This was discussed in detail in our recent annual Virtual Course, this time on Emerging Displacement Technologies for the Next Decade. INTC stock has been struggling at a support level, not moving down much but also without a strong pre-earnings run as many blue chip companies enjoyed. The reason is there are some institutions selling, as seen in rotation patterns and other institutions buying in accumulation patterns. Hence, the trading range pattern on the daily chart. For now the sellers have more dominance, but that can change. The Earnings report is due today after the market close. HFTs are likely to be all over it, which means there is gap risk, and they will trigger either way on earnings news.

INTC SELL (INTEL CORPORATION)Hi there. Price is forming a continuation pattern to the downside. Wait for the price to hit the top of the pattern and watch strong price action for sell.


INTC Potentially lowerINTC brings up a buying chance but I prefer to wait and get a better price. At the moment I'd like a short position and the target around 44 it looks ok.
Sidenote: "Top-notch entries are exclusive to members of Cream Live Trading"
Learn how to beat the market as Professional Trader with an ex-insider!
Have a Nice Trading Week!
Cream Live Trading, Best Regards!
