INTELA bullish divergence on INTC, the long signal when the price will break the blue trendline (after a close above it). The first target in the area $51.80/52.50 and the second one in the area $56.00/57.00. The stop loss at $43.75/43.85.
INTC


INTC descending wedge is bullishLooks like a bullish opportunity - worth a risk on some calls here.
Here is the weekly, we are still in uptrend. So descending wedge in uptrend is bullish!

PANW = WALL STREET CORRUPTION - MICRON IS GOING TO $250.00I just took a look at this garbage company and its bleak earnings release, I WAS SHOCKED AT THE STOCK PRICE COMPARED TO THE MONSTERS MICRON, WESTERN DIGITAL, INTEL AND MANY MORE!
PALO NETWORKS IS TRADING AT $220 ... OMG! ... AND ... AFTER HOURS UP $12.00 ON A NEGATIVE EARNINGS REPORT..?
YES, THESE STOCKS ARE BUBBLES AND WALL STREET COMPANIES LIKE MICRON SHOULD GO PRIVATE AND STICK WALL STREET WITH JUNK BUBBLE STOCKS TO TRADE.
PALO HAS AN E.P.S OF NEGATIVE -2.02
PALO LAST SEVEN (7) QTR'S E.P.S... YES I SAID 7 QTR'S ... ONLY $5.41 IN EARNINGS
COMPARED TO MICRON'S LAST SEVEN (7) QTR'S E.P.S ... $13.28 IN EARNINGS AND WHERE IS MICRON'S STOCK TRADING COMPARED TO THIS GARBAGE COMPANY?
TODAY'S NEWS FROM THE CFO OF MICRON WAS NOTHING BUT POSITIVE BUT BECAUSE WALL STREET DID NOT LIKE THE COST OF ONE PRODUCT, NAND MEMORY WAS LOWER, THEY CRASHED THE STOCK PRICE
MICRON CFO SAID "AVERAGE SELLING PRICES ""INCREASED"" FROM THE SECOND QTR TO THE THIRD QTR DUE TO MULTI-CHIP TECHNOLOGY THAT HAVE BOTH NAND AND DRAM / DUAL TECHNOLOGY ON A CHIP"
DAVID ZINSNER / CFO OF MICRON JUST TOLD WALL STREET THIS COMING QTR WILL BEAT ESTIMATES!
THE LIST OF GARBAGE COMPANIES GOES ON AND ON, PALO IS NOT THE ONLY GARBAGE "BUBBLE" TECH STOCK!
ELON MUSK / TESLA WAS RIGHT, HE SHOULD TAKE THE COMPANY PRIVATE ALONG WITH ALL THE REST OF THE COMPANIES LIKE MICRON WHERE WALL STREET HAS NO APPRECIATION, CLUE OR KNOWLEDGE AS TO THE FUTURE POTENTIAL OF COMPANY PRODUCTS, SERVICES AND MOST OF ALL, TECHNOLOGY.
DIRTY WALL STREET FIRMS TORTURE THE COMPANIES LIKE MICRON WHILE CHEERING GARBAGE COMPANIES LIKE PALO.
WALL STREET IS NO MORE AN ELITE PLACE TO BE ASSOCIATED WITH!
MY AVERAGE COST IS SO LOW RIGHT NOW ON MICRON, WHEN IT GOES TO $250 A SHARE WITH OVER $20.00 IN EARNINGS, I'LL BE A BILLIONAIRE, NO LONGER A MILLIONAIRE!
THANK YOU CORRUPT WALL STREET FOR CONTINUING TO OPEN MY EYES AS TO THE CORRUPTION PLAGUING THE FINANCIAL MARKETS AND FOR MAKING ME ONE STEP CLOSER TO BILLIONAIRE STATUS!


Start Accumulating WDCShares of WDC have fallen precipitously over the past several weeks from north of $100 to around $62-65. However, a look at the weekly chart shows this level to be significant support, as it's 61.8% retracement of the advance from the lows in 2016 to the highs this year. Furthermore, the dashed line shows that this level was also a significant level back in 2013, because it went on to double in price from that breakout point.
Also worth noting is that we formed a bullish hammer last week, and so far this week the bulls seem to have favor. I'd like to see another flush down to $62 to get the RSI in to oversold territory, and I believe we'll get it over the next few weeks.
Data storage is an obvious requirement for life in this day and age, so the threat of extinction seems unlikely. The main threat will be simply keeping up with evolving requirements better than competitors like STX, and to a lesser extent, MU.
I've began buying to accumulate a position, as I expect it to take time to materialize in to a rally. At current levels, you get a 3.1% dividend while you hold it. Plus, at 5.5x 2018's earnings estimates, it's not expensive on a P/E basis, and with a P/S (price/sales) ratio of 0.92, it's not expensive on that basis, either. In short, I like it for a long term play on the ever-growing data business, and now is the time to start buying.

Micron (MU) - BUY BUY BUYOkay, so I must say that I'd started a post and it got lost, so I'm going to condense this one out of frustration and for the sake of brevity.
Technicals -
This weekly chart shows that shares broke their upward sloping trend line (white line), and it also experienced a bearish breakdown of the R.S.I. (yellow circle). The MACD also confirms this bearish trend. Although not depicted on this chart, shares fell below their 200-day moving average today, which was at $49.97.
Back to the weekly... there are two swings, a major (tan lines) and a minor (blue lines). As such, I'll present the supports as zones rather than absolute levels. The first zone of support comes in at $43.53-45.76. The next zone is at $37.00-41.29. The last zone is around $26.85-30.48. The support at $26.85 is the low from Aug. 2017. Underneath that, there's one more support level at $21.19.
Let me be clear in saying that I don't think we break down beyond the $41 area, as its major support. In fact, I doubt we go too much further from here, so I'm targeting the first zone at, say, call it $43-46.
I added to my long-term position today and will be looking to add more on additional weakness. I also bought some September calls in my shorter-term trading account.
Fundamentals -
Shares are dirt cheap. At current prices, it's trading at 4x 2018's estimated earnings ($11.77), and at 4.1x 2019's estimated earnings ($11.60). The PEG ratio is 0.14, price/sales is 1.9x, and price/cash flow is at 2.9x. All metrics suggest a great value.
Finally, while MU doesn't pay a dividend (which I believe will soon change), it's worth noting that the company recently authorized a $10 billion buyback program, which given its $55 billion market cap, equates to over 18% of the float being bought back, and obviously that should bolster E.P.S. figures significantly.
Given the volatile nature of this name, I suggest scaling in and using this weakness as an "accumulate" setup.
Sure, memory pricing will go up and down, but let's be real... the need for data storage/memory is not going away anytime soon. There's also the "crypto effect" at play, as Micron is in that industry as well, so if any recovery in BTCUSD, LTCUSD, ETHUSD, XRPUSD, etc occurs, Micron should benefit (along with NVDA).
Bottom line - BUY BUY BUY. This thing is too cheap to pass up, and the current risk/reward is growing more and more compelling as share prices decline.

Intel Corp (INTC) Price Prediction using Gann and IchimokuI am prediction Intel will peak within the date and price shown.

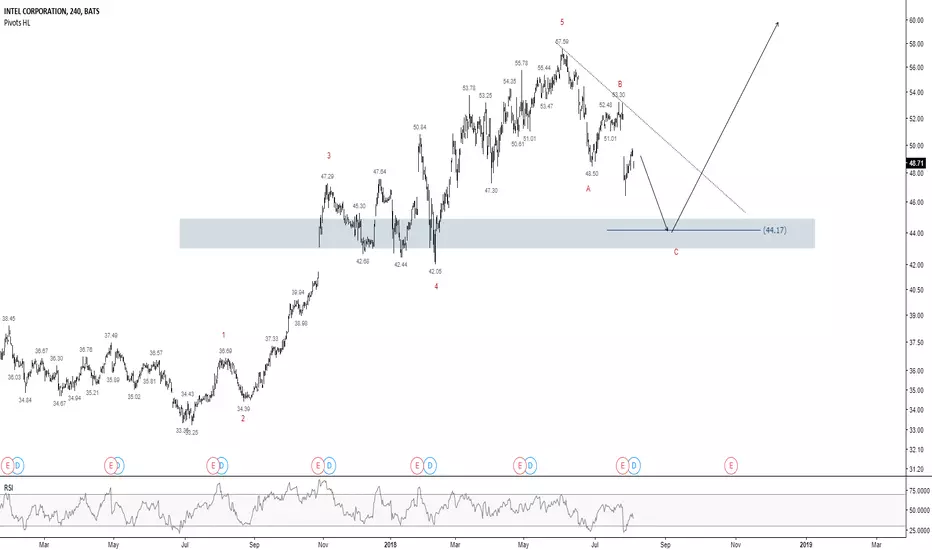
Intel - More upside aheadVery similar to the SFIX analysis, we are seeing a completed 5-wave structure and a potential 3 wave corrective structure.
A potential long opportunity around the 44.17 area for more upside.
*Disclaimer - This analysis alone DOES NOT warrant a buy or sell trade immediately. Before you enter any trade in the financial market, it is very important that you have a proper trading plan and risk management approach.
The sharing of this idea is neither necessarily indicative of nor a guarantee of future performance or success.
Stock Market Weaknesses Confirm Earlier Bearish DivergenceFirst came the bearish divergence and next came the confirming sell-offs. Break downs in key stocks exposed underlying market weaknesses.
"Stock Market Weaknesses Confirm Earlier Bearish Divergence" drduru.com $SPY $QQQ $IWM #AT40 #T2108 #VIX $VXX $AAPL $ACIA $FB $GOOG $TWTR $NLSN $BHP $RIO $CLF $CAT $CMG $DPZ $GE $INTC $MSFT $NFLX $ORLY $QCOM $TLT $UPS $WBA $WHR $XLB

$INTC Intel Oversold at 200d Support$INTC Intel looking oversold catching support around $48.50 / 200d ema
Expecting a move back above $50 in near term
Note: Observation/opinion, not investment advice.

Selling INTCOn the hourly chart of INTC, the price is starting the 4th Elliott wave within a bearish wave cycle. Also, the sell fractal was formed.

INTC rising wedgeINTC showing exhaustion in a rising wedge on the daily. Needs to break 55.06 and close below the uptrend line and preferably below the daily mbb to confirm.


INTEL SHORT/LONG - SYMMETRICAL TRIANGLE/ BEYOND TECH ANALYSISThe symmetrical triangle has resulted in a bearish breakout (over a month so most likely true).
the trend is downwards due to the breakout so shorting it would also be a good idea, especially if it makes the first price check.
This is a short-term trade and will have to be monitored. At this point after looking at the trend; I personally, with my limited experience, recommend shorting it though it may be beneficial to wait to see if it hits the price check and to see by how far it hits it.
At the same time, do note that Intel just confirmed GPU's and hence the stock may start rising; my diagram is one zoomed out so please do be careful on whether the gpu announcement will change anything!!
*Please give me feedback, this is my first time setting a price check so take my words with a grain of salt

INTEL STOCKS LONG HOLD 2-3 YEARS! POTENTIAL FOR LONG TERM PROFITWhile the ADX is quite high, the PVT is however below zero so this might not be the best to invest in..... especially since it seems to now be descending.
However, I'm here to tell you it might be a smart idea to invest as Intel has just confirmed that they are entering the GPU market by 2020 and hence preventing NVIDIA from becoming a pseudo-monopoly.
Intel's stocks will most likely skyrocket and investing during this downtrend may be very profitable in the next 2-3 years; especially as gaming is getting bigger and so is crypto mining, both of which require gpu's.
A lot of investors are probably waiting for more information so it might be beneficial to invest now!

INTC Long Term Elliot Wave AnalysisLong term sell opportunity for INTC approaching as we near completion of ascending triangle pattern. Watch for break down follow elliot wave completion or break downward of triangle. Target is volume profile support.
Elliot wave cheatsheet: i.imgur.com


INTEL (INTC) soon will go longINTC has formed a PBT&CA yesterday.
This means that could have found a support level that could be a good entry point.
Stock strenght is above 60.
I'll keep this stock in my watch list and enter when slowstochastic is going above 20 or check on lower timeframes if there is a entry signal.
Disclaimer:
This is just my tought: don't invest based on this idea.

NVidia Q1 Earnings on May 10th - Will it Follow AMD and Intel?Wow, what an earnings pop in AMD yesterday.
AMD popped 13.65% and Intel 3.25% on good earnings for Q1 2018 on 4/26. Will Nvidia do the same thing on 5/10?
Cryptos and stocks are linked forever now, but listening to Wall Street analysts day in and day out makes it clear that most on the Street do not get crypto. When there is an arbitrage of information and expertise like this, things like double-digit earnings pops in large-cap companies can happen - like they did yesterday with AMD.
Thanks in advance for lending me your attention!
AMD surprised the markets by reporting better-than-expected earnings and making it clear they were not only not hurt by their exposure to cryptocurrency technologies, but perhaps better off for it.
Anyone in the crypto community could have told you that, and crypto-savvy traders made big money with that knowledge with AMD's earnings pop.
INTC 's stock popped on earnings as well for similar but different reasons.
Will NVDA do the same thing? :
1) Some of Nvidia's main technologies (GPU's) are better geared toward crypto mining than part of AMD's main tech (CPU's),
2) GPU's are way up in price (about 80%) as demand continues to climb (and will only climb faster with rising crypto prices), and
3) NVDA's chart looks like it has room to run - similar to AMD's - with favorable technicals.
NVidia could be a winner ahead of earnings. . . or is the news already baked in? Given the lack of expertise of Wall Street in regard to crypto, an upside surprise from NVDA could be in store.
Thank you for reading!
Please like, follow, and share, and maybe we can have fun and do great things together.
Thanks again!
See this and more on the site: holsturr.com/category/markets/charts/
** For speculative and research purposes only - good luck! **

Opportunity to buy the dip before MOON!Hi guys, in my previous articles I was warning about Intel's anticipated drop to 46-48 region. We got exactly 37.34 which is perfectly within the expected range.
Now, it seems that since we have a top above the previous top, wave 1 has started and we have the opportunity to buy before the long third wave. Accumulation price is below 49 USD and for long holders, there is no letting go until the 80 usd mark, maybe even returning to previous highs of dot-com crash of about 90.
If you liked, follow :)
Cheers,
Ragnar

INTC failed to break above resistanceSince March 2018, INTC failed to break above $53.30 levels to form a triple top which could bring sellers to the game, you can note the gradual decrease in trade volume as well which support our bearish view for the stock.
Sell Trade could be entered at 52.10
TP1 50.50
TP2 47.60
SL will be a daily close above 53.30 levels
