One of the most beautiful modelsThe price has spent almost 24 years in a correctional area. It does not make a new top or a new bottom. It just goes on a correction. It flattened out three waves. The end of the correction approached after making another simple and final correction for the shaded area to form the bottom and start from it to break the historical top and make a new peak.
INTC

INTC / 1H / TECHNICAL ANALYSIS NASDAQ:INTC My target is 50.69 with a support level at 45.70 and a resistance level at 51.32. Please don't forget to follow and like. Thank you

Intel Faces Headwinds Amidst Soft Q1 Outlook
Intel Corporation ( NASDAQ:INTC ) , a stalwart in the semiconductor industry, is currently weathering a storm as its shares plunged over 11% in pre-market trading following a sobering first-quarter outlook. Despite delivering better-than-expected fourth-quarter results, the chipmaker's CEO, Pat Gelsinger, anticipates a challenging start to 2024, attributing the softened outlook to weaknesses in subsidiaries and the programmable chip unit. We delve into the key factors driving Intel's recent struggles and explore the implications for investors.
The Q1 Outlook:
Intel's 9 NASDAQ:INTC ) projection for the first quarter paints a challenging picture, with adjusted earnings expected to be 13 cents per share and revenues ranging between $12.2 billion and $13.2 billion. This forecast falls short of Wall Street's expectations, prompting concerns among investors. Gelsinger reassured analysts that the core businesses of PCs and servers remain healthy, citing no areas for market share loss and highlighting the strength of the company's products.
Challenges in Subsidiaries and Programmable Chip Unit:
A notable contributor to Intel's tempered outlook is the weakness in several subsidiaries and the programmable chip unit. Gelsinger acknowledged these challenges but emphasized the overall health of the core business. The company's CEO remains optimistic about overcoming these hurdles, with AI chip orders worth $2 billion and a projection for improved sales later in the year.
Gaming and Commercial Sectors as Bright Spots:
Despite the overarching concerns, Intel's ( NASDAQ:INTC ) fourth-quarter results showcased a 33% increase in sales from its Client Computing division, driven by robust performance in the gaming and commercial sectors. Gelsinger sees these areas as pockets of strength within the PC chip market, expecting a broader normalization throughout 2024 after a two-year slump.
Technical Analysis and Head and Shoulders Pattern:
Intel's ( NASDAQ:INTC ) stock, after breaking out from a nine-month ascending channel in mid-December, faces challenges in gaining further upside momentum. Investors are closely watching the stock's relationship with its 50-day moving average, as a close below this indicator would confirm a head and shoulders topping pattern. Such a confirmation could open the door for a decline towards the lower trendline of the channel. On the flip side, a successful hold of the indicator might empower bulls to make another attempt at a move higher.
Conclusion:
Intel's ( NASDAQ:INTC ) current predicament underscores the complex dynamics at play in the semiconductor industry. While the company faces short-term headwinds, CEO Pat Gelsinger's optimism about the core businesses and future prospects, including AI chip orders and expected sales improvement, adds a layer of resilience to the narrative. Investors will keenly monitor how Intel ( NASDAQ:INTC ) navigates these challenges and whether the technical patterns manifest as predicted, making the coming months a critical period for the semiconductor giant.

AMD vs Intel AMD vs INTEL on a weekly chart NASDAQ:AMD NASDAQ:INTC
you can see the divergence tied to news and developments over the years AMD made faster smaller chips Intel failed to do so then doubled down and claimed they didn't need to make smaller chips The 5-nm debate. Enter AI where AMD has the lead second to NASDAQ:NVDA
AMD still has room to run in this long term channel.

INTC Intel Corporation Options Ahead of EarningsIf you haven`t bought the Double Bottom Pattern of INTC:
Then analyzing the options chain and the chart patterns of INTC Intel Corporation prior to the earnings report this week,
I would consider purchasing the 48usd strike price at the money Calls with
an expiration date of 2024-1-26,
for a premium of approximately $1.86.
If these options prove to be profitable prior to the earnings release, I would sell at least half of them.

Intel - Clear StructureHello Traders, welcome to today's analysis of Intel.
--------
Explanation of my video analysis:
In 2022 Intel broke a massive previous support level at the $45 area towards the downside. This break was followed by a drop of roughly -50%. With a perfect retest of a very long term structure level, this recent pump on Intel was quite anticipated. If Intel pulls back to the previous support level mentioned in the analysis, I am looking for potential long setups.
--------
I will only take a trade if all the rules of my strategy are satisfied.
Let me know in the comment section below if you have any questions.
Keep your long term vision.

$INTC Intel Bearish To bullish ReversalNASDAQ:INTC (Intel) is undergoing a bearish-to-bullish reversal, marked by an oversold Stochastic RSI. It is currently positioned above the 50-day moving average. Our dynamic support level will serve as a stop-out point in case of a weekly close below it.

INTC Holy Grail SetupINTC has pulled back nicely to the 20 EMA on the daily chart (looks even cleaner on the 65min). Candles are narrowing and looks like it wants to break out of this wedge. Active trade at $46.85. Target $51-$55

Immediate short on INTC!Thank you as always for watching my analysis. May God bless you and your family in this new year!

INTC is going from $50 to $85 in the first quarter of 2024There was a clear Eliott Wave abc correction between 2020 and 2022 that found a very strong support around $28 level and MA200 Monthly which acted as a support since 1980s.
Price consolidated for a year around $30 level and just broke out and gained momentum pushing through resistance like through a butter.
The momentum and trend are clearly established and won't stop until new ATH around $80-$85 levels is reached.
What will happen once ATH is reached? No idea, but so far it's a strong buy.

Intel - The Anticipated RallyHello Traders, welcome to today's analysis of Intel.
I will only take a trade if all the rules of my strategy are satisfied.
Let me know in the comment section below if you have any questions.
Keep your long term vision.

INTC in depth TA - INTEL bullish?hey guys its amir whats up?
so NASDAQ:INTC let analyze:
first of all ill start by saying that intel is on uptred for over 6 months. now lets get into details:
- you can see that intel is trading in a uptrend channel for over 6 months, every time the price touched at the bottom trend line the bounced up and every time it touched the upper trend they dropped down, we recently touched the bottom trend line and the price did bounced from there.
- we have on the way up some more major supports and resistances right now the price is in the middle of a support and resistance so for perfect entry ill wait till the price will reach to one of the cyan x's which marks solid entries points.
- lets talk about the MA's, first the 50MA, clear uptrend. 200MA, turned uptrend 3 months ago.
Now lets look at our indicators:
- RMACD crossed bullish about two weeks ago, and now losing a lot of momentum so I think we should wait the RMACD to make a bearish cross and wait till its will cross bullish again, or to see if the momentum is getting stronger in the coming days.
- Volume tells me that its better wait a bit more to see what is going on there.
- good buying pressure moves between moderate and strong buying pressure.
so in conclusion i'd say that now the best thing to do is to wait a little more at least till the price will reach to one of these cyan x's and there we can manage the risk reward in our favor.
price prediction is about $40

$INTC putBought Dec. 15th $41 put for $3.
NASDAQ:INTC is at a local top, there is not much premium in the option.
My break-even is $38

WOW OH WOW. Minus $1 to target please!!INTC is failed the most recent high, it broke its uptrend and sold off right below the point of control (yellow line). I would expect a sell-off to continue to the .382 (white line which is also the next area with the most amount of volume traded.
Calculate Your Risk/Reward so you don't lose more than 1% of your account per trade.
Every day the charts provide new information. You have to adjust or get REKT.
Love it or hate it, hit that thumbs up and share your thoughts below!
This is not financial advice. This is for educational purposes only.
Apple - Sick Fundamentals Mean a New All Time HighI have recent calls on the SPX
SPX ES - Welcome To The Fourth Quarter Rodeo
The Nasdaq
Nasdaq Futes - You Wanted a Dip For That 'Santa Rally,' Aye?
SPY
SPY - Did We Bottom, Or Is Manipulation Coming?
And Tesla
Tesla - Remember, The Ponzi Always Continues
Which generally have a bullish-into-year-end thesis accompanying them, but caution that an October bottom for the second year in a row and a mega three day rally to start November may be something of a trap.
When it comes to Apple, we have reservations that we topped under $200, for really obvious reasons, especially considering that on the monthly, the last three months of bearish price action haven't been that bearish.
Yet, because the weekly shows us that there are two bars under $150 and $140 from last year that never printed a low, that those areas are probably protected until Apple starts to seriously deflate and enter an end-of-life cycle bear market.
If Apple is going to enter an end of life cycle bear market, the MMs will 100% take out the $200 range and sell everything there first.
So, fundamentally, why would Apple be at the end of its life? The answer is simple: the company, all these years, wed itself to the Chinese Communist Party, which is the scourge of humanity, The Beast, and the benefactor to Babylon (Shanghai).
There's lots of really horrific data involving Apple numbers and the Chinese market right now, and the CCP under Xi Jinping is also rushing to replace other phone companies with domestic product, like the notorious Huawei.
The elephant in the room when it comes to cellular and computer purchases in China is that they're down because there are less people in China as a result of the enormous damage the novel pneumonia pandemic that originated in Wuhan City has caused.
SARS 1 in 2003 was covered up by the Party. The CCP made it seem like only a few thousand people died, when in reality, some accounts have stated that several million people died.
Today, the Party still claims that less than 122,000 people died from COVID-19, despite China being the epicentre of the disease.
You don't need an expert, or even a calculator, to figure out what's really going on and why the Chinese economy is in trouble.
What's at stake for Xi and his faction is the 24-year-long organ harvesting genocide and persecution against Falun Dafa's 100 million practitioners.
Although Xi has not participated in the persecution, and has, to the contrary, been killing via his Anti-corruption Campaign the Jiang Zemin faction who started and maintained the persecution all these years, the problem is that Xi is the head of the Party.
When you kill a dragon, you decapitate it. But first, you start with its tail. And it's telling that former Premier Li Keqiang died a few weeks ago, merely in his 60s, at the hands of "an heart attack."
So the fundamentals on Apple are bad because of China. So, with great faith in the principle of reversed logic, we actually look for longs with the chance to sell over $200.
But the charts, as they stand, are not giving us a long signal.
Everything, including Apple, bounced so hard in the first three days of November, and for Apple this came on the back of an earnings report, that we have to view the situation with major reservations, expecting that the candle painting of the low for the monthly bar has not yet been completed.
Last October, Apple pretended to bottom, pretended to double bottom in November, and then gave it all back and set the low of the year at the end of 2022, and all of this happened while the indexes had properly bottomed in October.
There was none of that "Magnificent 7" talk back then.
So, how to trade this? I think it's wiser to go long on a breakout over $183 in a size that allows you to take partials at $198, $205, and $215 than it is to have bought in the last three days.
And if we do dump, where we're looking for reversal patterns is at or below the April of 2022 low at $159.80~.
But if we're about to moon for manipulation, we're actually likely to see a sweep just below the current November low of $167.90.
So long as you can buy there without getting expired worthless on some short dated options, you'll have the best chance to ride the manipulation wave.
But be careful. When it's time for the CCP to fall, all the bigger dominoes go with it, because they're all really lesser dominoes.
Gap down overnight because of the time difference between Beijing and Manhattan means margin calls that scale in brutality, because Wall Street won't be in the mood to go risk on anything ever again.
Nor will it have the money or the breath to.

INTEL 10-month Channel Up targeting $40 and $43 in extension.Intel Corporation (INTC) has been trading within a Channel Up throughout the whole year and as you can see on the chart, the pressure points are best displayed with the use of the Fibonacci Channel levels. Last Thursday's bottom on the Higher Lows trend-line couldn't have come at a stronger demand level, as it hit (and immediately rebounded on) the 1D MA200 (orange trend-line).
The price even broke and closed above the 1D MA50 (blue trend-line) yesterday and more importantly completed the first 1D MACD Bullish Cross below 0.0 since August 30. It is a similar rebound sequence where again the price was just above the 1D MA50 and eventually completed a +25.24% rise, marginally above the 1.382 Fibonacci horizontal extension. Every time the 1D MACD formed a Bullish Cross below 0.0 within this Channel Up, we had the same bullish confirmation signal and the stock rose by +25.24%, +38.83%, +36.47% on those occasions, always hitting at least the 1.382 horizontal Fib level.
As a result, we expect the stock to complete the 'minimum' +25.20% fractal rise, thus we target $40.00 on the short-term and on the long-term, extend to at least $43.00, which is the 1.382 Fibonacci extension and would make an optimal technical Higher High on the 2023 Channel Up.
-------------------------------------------------------------------------------
** Please LIKE 👍, FOLLOW ✅, SHARE 🙌 and COMMENT ✍ if you enjoy this idea! Also share your ideas and charts in the comments section below! This is best way to keep it relevant, support us, keep the content here free and allow the idea to reach as many people as possible. **
-------------------------------------------------------------------------------
💸💸💸💸💸💸
👇 👇 👇 👇 👇 👇

INTC Intel Corporation Options Ahead of EarningsIf you haven`t bought the Double Bottom on INTC here:
Then analyzing the options chain and the chart patterns of INTC Intel Corporation prior to the earnings report this week,
I would consider purchasing the 34usd strike price Puts with
an expiration date of 2024-1-19,
for a premium of approximately $2.56.
If these options prove to be profitable prior to the earnings release, I would sell at least half of them.
Looking forward to read your opinion about it.

intel - analysis - inside 💻Hello TradingView Family / Fellow Traders. This is Richard, also known as theSignalyst.
📉 INTC has been overall bullish trading inside the rising wedge pattern in blue and it is currently approaching the lower bound / blue trendline.
Moreover, the 31-32 is a strong support zone.
🏹 So the highlighted red circle is a strong area to look for buy setups as it is the intersection of the green support and lower blue trendline acting as a non-horizontal support.
📚 As per my trading style:
As INTC approaches the lower purple circle zone, I will be looking for bullish reversal setups (like a double bottom pattern, trendline break , and so on...)
📚 Always follow your trading plan regarding entry, risk management, and trade management.
Good luck!
All Strategies Are Good; If Managed Properly!
~Rich

Intel (INTC) -> Don't Forget This StockMy name is Philip, I am a German swing-trader with 4+ years of trading experience and I only trade stocks , crypto , options and indices 🖥️
I only focus on the higher timeframes because this allows me to massively capitalize on the major market swings and cycles without getting caught up in the short term noise.
This is how you build real long term wealth!
In today's anaylsis I want to take a look at the bigger picture on Intel.
Looking back at January of 2023 - after a massive dump during 2022 - Intel stock perfectly retested and started to reject a major monthly structure level at the $27 level.
With the next clear resistance level being at $46 I am now expecting more upside on Intel stock before we could then see a short term rejection away from the $46 resistance area.
- - - - - - - - - - - - - - - - - - - -
I know that this is a quite simple trading approach but over the past 4 years I've realized that simplicity and consistency are much more important than any trading strategy.
Keep the long term vision🫡

INTC IS A BIG LONG TERM BUY TRUST MEINTC is looking very good my friends. It is a good time to buy long and hold. Minimum position length I would say 2 months. Maximum length infinite. Do not be dumb. INTC is INTC we are living in computer world. NOW REMIND ME WHAT CPU STANDS FOR. CENTRAL PROCESSING UNIT. WITHOUT CPU THEN COMPUTER IS MORE LIKE PPU (POOPY POOP UNIT) ONLY 2 BIG CPU AMD AND INTC AMD IS BEING PPU BUT INTC BEING BCPU (BEAST CENTRAL PROCESSING UNIT) so be smart my friends. ride with me into Valhalla. WITNESS ME

$INTC - Rising Trend Channel [MID-TERM]🔹Between support 32.86 and resistance 37.24 in Rectangle Formation.
🔹In case of a NEGATIVE reaction, it has support at approximately 33.
🔹Technically POSITIVE for the medium long term.
Chart Pattern:
◦ DT: Double Top | BEARISH | 🔴
◦ DB: Double Bottom | BULLISH | 🟢
◦ HNS: Head & Shoulder | BEARISH | 🔴
◦ REC: Rectangle | 🔵
◦ iHNS: inverse head & Shoulder | BULLISH | 🟢
Verify it first and believe later.
WavePoint ❤️

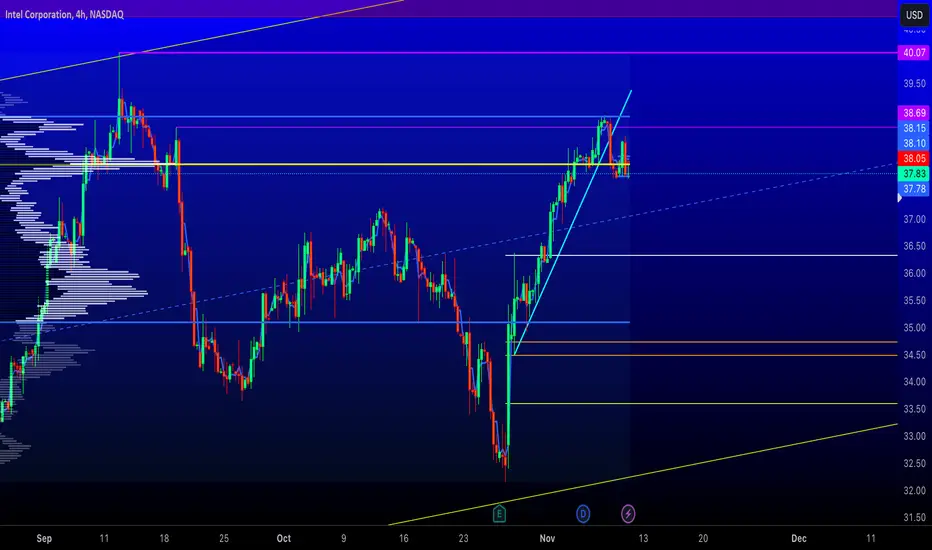
INTC re entry August 3rd 2023INTC is giving us re entry and target would be $38 and then $40. DO NOT TRADE OPTIONS.

INTEL CORPORATION still bullish market for expect
Hi viwers, INTC in last periods bullish trend we are can see, here now zone breaked, showed strong volumen, for next peridos still bullish trend here expecting to see.
TP1: 41.41
TP2: 44.40
