SPY - kung fu chop the chopIn review. I see a lot of people complaining about "chop" lately. These are not the people to be following in my honest opinion. There is opportunity in all markets it is just a matter of risk management and being able to navigate the choppy waters. Circled some of the opportunity I took in this "Chop"
A week in review these are some of the best trading days I have had.
Sometimes the easiest trading is done in chop but you have to be patient and let it come to you.
Don't let the chop push you off course. Stick to your trade criteria and navigate accordingly. You just need to be patient, post your lookouts, and be ready to sound the alarm to enter the right trade.
Set alerts off of great areas of value so you don't have to spend the entire day staring at the screen.
Trade safe have fun!
INTC


Aapl bit more to fall Respect the channel
Has more to go today then bounce back up. Wait for a good few green bars off this support for entry long and keep it simple. Cheers!

TSLA updateBuying value around 168 after this gap down to gap fill potentially pre market. Waiting for call opportunities for possible H&S fill out (zoom out) and back up to 196 then 224
Trade safe have fun!
Follow and like for more updates

TSLASelfdrive PART DEUX - Area of ValueI missed this earlier, thought it important to repost this idea, inverse H&S (HAS NOT FILLED OUT YET) potentially forming... I will watch this chart closely and look for entires above neck line for sure, perhaps get a bit crazy and enter before neckline fills.. Let me know your thoughts in the comments below!!
Keep in mind friday Dec 9 PPI news 830am as well as Consumer sentiment. after 4 red days in a row probabilities of a green are high. expecting green Friday but looking to see this H&S fill out after breakout of descending triangle and retest. This is a good area of value
Trade safe and have fun!

Visa - Weekly analysisIs this a fakeout or is this a breakout. Wondering why ex speaker would sell all of her shares? Not entering until I see price action, break above recent highs outside channel or a break back down below the channel. Will zoom in for entry.
Overall, We could see a green day tomorrow due to the fact we had 4 red selloff days in a row... so probability has it a 5th could go green. Waiting to see a bounce but ready to take some more puts tomorrow as I see price action happen real time.
Indicators are lagging, you want to see price action, market psychology, market structure, gaps, imbalances, and use all the tools available to make a good trade!
Trade safe have fun!!
Like and comment for more!


Bullish Spike on Intel (INTC)This morning's 10am scan yielded bullish price action spikes on both AMD and INTC. I like the level that Intel NASDAQ:INTC is holding to for a swing trade. The first target will be a retest of this week's high.
In the longer term after a very long bearish trend the chip makers have begun to turn. It is somewhat "late" in the turn from October but there are now confirmed signs of a possible reversal. Daily chart:

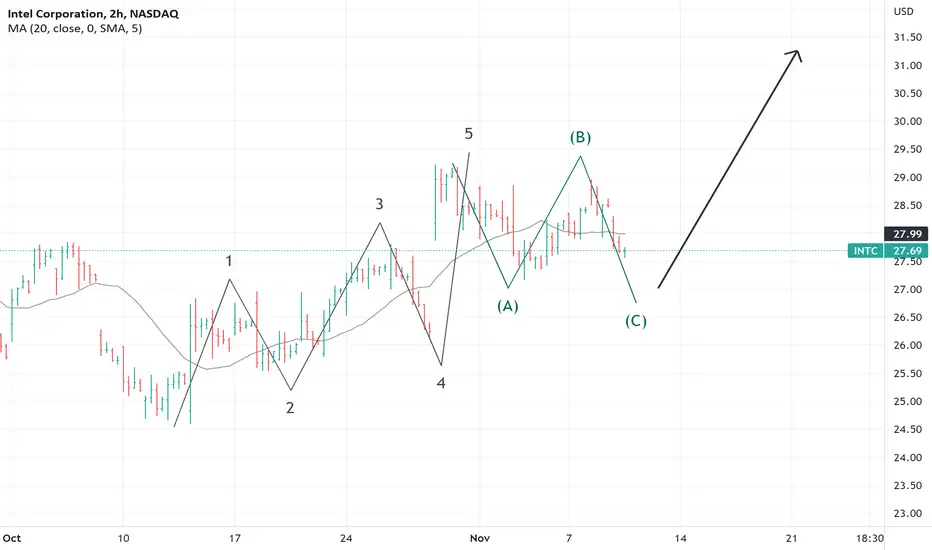
INTL - Higher Highs Ahead?Coming in from a Bullish Market standpoint, Intel may be setting up for a big rally. Following the A-B-C correction, INTL would move into a wave 3, pushing for much higher prices.

Buying Intel..?Intel Corporation - 30d expiry - We look to Buy a break of 28.02 (stop at 25.88)
We are trading at oversold extremes.
In our opinion this stock is undervalued.
Price action has posted a Doji candle and signals a possible reversal of the recent trend.
The RSI is trending higher.
Bullish divergence is expected to support prices.
We need to see a break of bespoke resistance (at 28.00) to confirm the positive outlook.
Our profit targets will be 33.69 and 36.69
Resistance: 27.00 / 28.00 / 30.00
Support: 25.50 / 24.50 / 23.00
Disclaimer – Saxo Bank Group.
Please be reminded – you alone are responsible for your trading – both gains and losses. There is a very high degree of risk involved in trading. The technical analysis , like any and all indicators, strategies, columns, articles and other features accessible on/though this site (including those from Signal Centre) are for informational purposes only and should not be construed as investment advice by you. Such technical analysis are believed to be obtained from sources believed to be reliable, but not warrant their respective completeness or accuracy, or warrant any results from the use of the information. Your use of the technical analysis , as would also your use of any and all mentioned indicators, strategies, columns, articles and all other features, is entirely at your own risk and it is your sole responsibility to evaluate the accuracy, completeness and usefulness (including suitability) of the information. You should assess the risk of any trade with your financial adviser and make your own independent decision(s) regarding any tradable products which may be the subject matter of the technical analysis or any of the said indicators, strategies, columns, articles and all other features.
Please also be reminded that if despite the above, any of the said technical analysis (or any of the said indicators, strategies, columns, articles and other features accessible on/through this site) is found to be advisory or a recommendation; and not merely informational in nature, the same is in any event provided with the intention of being for general circulation and availability only. As such it is not intended to and does not form part of any offer or recommendation directed at you specifically, or have any regard to the investment objectives, financial situation or needs of yourself or any other specific person. Before committing to a trade or investment therefore, please seek advice from a financial or other professional adviser regarding the suitability of the product for you and (where available) read the relevant product offer/description documents, including the risk disclosures. If you do not wish to seek such financial advice, please still exercise your mind and consider carefully whether the product is suitable for you because you alone remain responsible for your trading – both gains and losses.

The world no longer needs chips! LOLThis is in my opinion like buying oil stocks in the march 2020 crash. Semis to technology is like oil to transport. The world will not survive without either. So I place my long here today confidently regardless of the next few weeks or months. I will hold this until we re-reach our previous ATH which will be sooner than most anticipate. I expect by 2025 this will rereach those highs and achieve a much higher value by 2030. This is a serious chance to change your wealth status. Buy red sale green as always this is not financial advice. Do not be short-sided with this dip. Get in front of big money. Retail is gone from the markets, now all that is left is big money to choose their picks... high probability this bounces soon major.

Intel is also visiting multi decade support around 25$Prime time for a bounce.
Disclaimer : Not a financial advice

INTC stonks under 4th Elliott's wave This is an update regarding last update for INTC stonks. In M1 we can easily see 4th Elliott's wave begins, so I recommend to wait till 5th wave for some buys

Massive drops incoming on Intel. INTCIndeed. Check out that epic gap and we are about to crash through the most recent low set in July. Fractally ~ zigzag nearing completion.
We are not in the business of getting every prediction right, no one ever does and that is not the aim of the game. The Fibonacci targets are highlighted in purple with invalidation in red. Confirmation level, where relevant, is a pink dotted, finite line. Fibonacci goals, it is prudent to suggest, are nothing more than mere fractally evident and therefore statistically likely levels that the market will go to. Having said that, the market will always do what it wants and always has a mind of its own. Therefore, none of this is financial advice, so do your own research and rely only on your own analysis. Trading is a true one man sport. Good luck out there and stay safe.

INTC: BIG SDUPPORT, BOUNCE PLAYINT C at big support .
RSI oversold on every time frames, even monthly!
This is monthly chart.
Good risk reward for a long swing trade with a stop right below the red line. A bounce to 33.76 is possible.
If goes down, not much to lose here...
Trade safe!

SHORT Intel - Weak Performance - Target 30 near termBroke Below Moving averages - Intc followed the FIB lines down
RETRACED to support and got Rejected
STRONG BEARISH divergence on the Oscillators
ANALYSTS just LOVE Intel.....Whoo Hoo
Tech is going to retreat -- AMD and INTC will be First to go down
Intel Corp. has been missing from a rebound in technology stocks that’s lifted almost every other member of the Nasdaq 100 since the index bottomed in June.
Aug-02-22 Downgrade DZ Bank Hold → Sell $30
Jul-29-22 Downgrade Susquehanna Neutral → Negative $40 → $33
Jul-29-22 Downgrade Robert W. Baird Outperform → Neutral $60 → $40
Jul-13-22 Reiterated Susquehanna Neutral $50 → $42

INTC in trouble!Intel Corporation
Short Term
We look to Sell at 35.22 (stop at 36.86)
Preferred trade is to sell into rallies. The medium term bias remains bearish. Price action has been negative with losses breaking below our previous support level and we expect a further drive lower to follow. There is scope for mild buying at the open but gains should be limited.
Our profit targets will be 31.92 and 30.18
Resistance: 35.00 / 40.20 / 43.80
Support: 33.73 / 32.50 / 29.00
Disclaimer – Saxo Bank Group. Please be reminded – you alone are responsible for your trading – both gains and losses. There is a very high degree of risk involved in trading. The technical analysis, like any and all indicators, strategies, columns, articles and other features accessible on/though this site (including those from Signal Centre) are for informational purposes only and should not be construed as investment advice by you. Such technical analysis are believed to be obtained from sources believed to be reliable, but not warrant their respective completeness or accuracy, or warrant any results from the use of the information. Your use of the technical analysis, as would also your use of any and all mentioned indicators, strategies, columns, articles and all other features, is entirely at your own risk and it is your sole responsibility to evaluate the accuracy, completeness and usefulness (including suitability) of the information. You should assess the risk of any trade with your financial adviser and make your own independent decision(s) regarding any tradable products which may be the subject matter of the technical analysis or any of the said indicators, strategies, columns, articles and all other features.
Please also be reminded that if despite the above, any of the said technical analysis (or any of the said indicators, strategies, columns, articles and other features accessible on/through this site) is found to be advisory or a recommendation; and not merely informational in nature, the same is in any event provided with the intention of being for general circulation and availability only. As such it is not intended to and does not form part of any offer or recommendation directed at you specifically, or have any regard to the investment objectives, financial situation or needs of yourself or any other specific person. Before committing to a trade or investment therefore, please seek advice from a financial or other professional adviser regarding the suitability of the product for you and (where available) read the relevant product offer/description documents, including the risk disclosures. If you do not wish to seek such financial advice, please still exercise your mind and consider carefully whether the product is suitable for you because you alone remain responsible for your trading – both gains and losses.

INTEL Corp. $INTC - Buy @ ~ $35/$36INTEL Corp. $INTC - Buy @ ~ $35
I'm always on the Buy Side of the S&P500 Stocks.
I believe $INTC price is fairly good to buy it now for a long term investment.
My analysis is based on the trend lines (SMA 20 & 50) and Support & Resistance on the Daily time frame.
Target Prices are respectively as follow $40, $42, $45 & $56 and you can aim higher ($70) since the entry price is fairly too low.
NASDAQ:INTC

SOXS to SOXL ratio DAILY CHARTAMEX:SOXL
This chart strives to setup a trading plan where the SOXS and SOXL
are oscillated. They are 3X leveraged ETFs with great range.
SOXS was up 400% YTD at its peak. The new CHIPS
ACT is a catalyst for US semiconductor manufactures
Right now the ratio is on a downtrend, meaning Sell SOXS
or BUY SOXL or a combination of each.
I believe that this strategy could yield 5X annually
to investors or long-term swing traders with little effort
especially if an alert is employed to notify the ratio
is changing trend direction at a pivot.
The timeframe could be lower but then the number
of trades is likely to increase as is the amount
of profit. This could be backtested by those
familiar with the mechanics of doing so.
