INTC EARNINGS TRADE (07/24)
🚨 INTC EARNINGS TRADE (07/24) 🚨
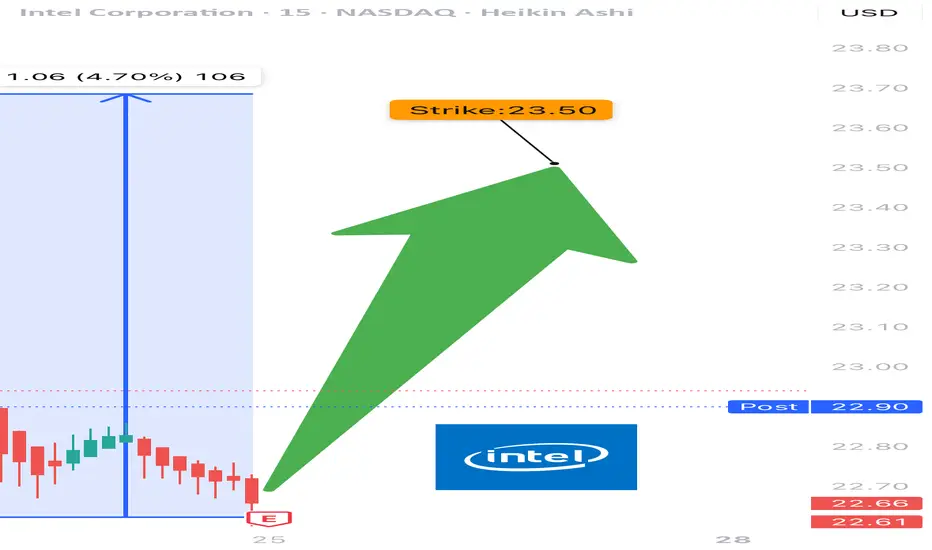
🎧 Earnings drop after close — here’s the high-conviction setup 📊
🧠 Key Highlights:
• 💥 Surprise Beat Rate: 88%, avg surprise = 419%
• 📉 Margins: Ugly (-36% net margin) but improving sentiment
• 📈 Volume Surge + $24 resistance test = pre-earnings drift 🚀
• 🔎 Mixed options flow → cautious bulls leaning in
• 🎯 Sector: SEMI = 🔀 rotating hard, competition vs AMD/NVDA rising
💥 TRADE SETUP
🟢 Buy INTC $23.50 Call exp 7/25
💰 Entry: $0.59
🎯 Target: $1.18
🛑 Stop: $0.29
📈 Confidence: 75%
⏰ Entry: Before Earnings (Close 07/24)
📆 Earnings: Today After Market (AMC)
📊 Expected Move: 5%
⚠️ Play the earnings drift → gap up = profit. Miss = cut fast. Risk = defined. Reward = explosive.
#INTC #EarningsPlay #OptionsTrading #IntelEarnings #UnusualOptionsActivity #TechStocks #Semiconductors #TradingView #EarningsSeason #DayTrading #CallOptions
Intcidea
Intel Share Price Hits 3-Month High Without Clear CatalystIntel (INTC) Share Price Hits 3-Month High Without Clear Catalyst
Intel Corporation (INTC) stocks rose by over 7% yesterday, making them one of the top performers in the S&P 500 index (US SPX 500 mini on FXOpen). As a result, the stock price reached its highest level in three months.
What’s notable is the apparent lack of clear drivers behind the rally. According to Barron’s, the increase in INTC shares could have been triggered by a rating upgrade from Wall Street analysts or a corporate announcement – yet no such developments have occurred. "Nothing new or fundamental," says Mizuho managing director and technology specialist Jordan Klein.
At the same time, from a technical analysis perspective, the INTC price chart is showing significant developments. Examining these price movements may provide clues as to what’s fuelling the recent rise.
Technical analysis of INTC stocks
For many months, the share price had been confined within a downward channel. However, the psychological level of $20 acted as a strong support – repeated attempts by bears to push the price lower ultimately failed.
Bearish patterns in INTC’s chart may have led to a supply squeeze, as holders were given repeated reasons to sell (particularly against the backdrop of Nvidia’s success). Yet the bullish reversals near the $20 mark suggest that institutional interest was accumulating the stock at what was perceived to be a deeply discounted level – a characteristic sign of the Accumulation Phase in Wyckoff methodology.
It is this lack of available supply that could explain the sudden price rise in the absence of obvious news catalysts.
Since early summer, INTC shares have been making higher highs and higher lows, breaking upwards through the descending channel and beginning to form the early stages of a new bullish trend (highlighted in blue). Should fundamental catalysts emerge in the near term, they may serve as the spark to accelerate this nascent rally.
This article represents the opinion of the Companies operating under the FXOpen brand only. It is not to be construed as an offer, solicitation, or recommendation with respect to products and services provided by the Companies operating under the FXOpen brand, nor is it to be considered financial advice.

Intel - The rally starts!Intel - NASDAQ:INTC - creates a major bottom:
(click chart above to see the in depth analysis👆🏻)
For approximately a full year, Intel has not been moving anywhere. Furthermore Intel now trades at the exact same level as it was a decade ago. However price is forming a solid bottom formation at a key support level. Thus we can expect a significant move higher.
Levels to watch: $25.0
Keep your long term vision!
Philip (BasicTrading)

Intel (INTC) Shares Drop Over 6% in a DayIntel (INTC) Shares Drop Over 6% in a Day
As shown on the Intel (INTC) chart, after Tuesday’s candle closed above $21, the price dropped sharply on Wednesday. INTC was the worst-performing stock of the day among the components of the S&P 500 index (US SPX 500 mini on FXOpen).
Why Did INTC Shares Fall?
The decline is linked to growing competitive pressure. According to media reports:
→ On one hand, AMD continues to rapidly expand its share of the server CPU market. A report by Mercury shows that the company already controls 40% of the segment and could match Intel as early as next year.
→ On the other hand, Nvidia is preparing to launch two accelerated processing units (APUs) for the consumer market, which will combine CPU and GPU capabilities in a single product.
Technical Analysis of the INTC Chart
In 2025, the price remains:
→ within a broad downward trend (marked in red);
→ supported by the $18.50–$20 zone.
Meanwhile, price fluctuations in May and June are forming a narrowing triangle (marked in black). Following the recent negative news, it is possible that INTC shares could fall towards the lower boundary of the triangle — or even retest the psychologically important $20 level.
This article represents the opinion of the Companies operating under the FXOpen brand only. It is not to be construed as an offer, solicitation, or recommendation with respect to products and services provided by the Companies operating under the FXOpen brand, nor is it to be considered financial advice.

WHAT'S THE FATE OF INTEL CORPORATION STOCK?From the perspective of technical analysis, INTC is approaching a key psychological level at $19. In addition, it's in a downtrend. If the key level should hold by pushing price higher, leading to a break out of the downtrend line and closing with a strong bullish candle above the down trend line and resistance level around $22, this will indicate a strong bullish signal. Likewise, this is supported by a bullish divergence signal from the awesome oscillator. Otherwise, a failure of the psychological level of $19 may lead to price dropping further.
Furthermore, we need to look beyond technical analysis. Fundamental analysis also has some insights for our decisions.
Fundamentals for INTC established a bearish bias. The summary is as follows:
Financial Health:
• Negative EPS (-$4.47): Intel is losing money.
• High Debt ($50B): This can limit growth and increase risk.
• Declining Revenue: Sales dropped from $80B (2021) to $51B (2024).
Valuation:
• Cheap P/S (1.66x), but no P/E (due to negative earnings).
• Dividend yield (2.56%) is at risk of being cut.
Sentiment:
Stock price fell from $56 to $19.55 (65% drop). Institutional investors may be wary.
Fundamentally, INTC is weak — best suited for speculative, long-term bets (if you believe in a turnaround).
Strategy for Traders:
1. Conservative Approach:
- Wait for:
- Break out of downtrend line and resistance around $22 and positive earnings/news.
- Rising volume to confirm momentum.
- Target: $27–$30
- Stop-loss: Below $17 (apply proper risk management).
2. Aggressive Approach:
- Buy near $18–$19 with tight stop-loss ($16).
- Target resistance level at $22.
3. Avoid If:
- You’re risk-averse or prefer stable companies.
- Intel’s debt/revenue trends worsen.
Note:
- Short-Term Trade: Only if breakout confirms ($22+). High risk, but possible 20% bounce.
- Long-Term Investment: Avoid unless Intel shows profit/debt improvement.
Always use stop-losses —Intel’s fundamentals make it volatile.
Disclaimer: This is not a financial advice. The outcome maybe different from the projection. Don't take the signal if you can't accept the risk.

WHAT'S THE FAITH OF INTEL CORPORATION STOCK? From the perspective of technical analysis, INTC is approaching a key psychological level at $19. In addition, it's in a downtrend. If the key level should hold by pushing price higher, leading to a break out of the downtrend line and closing with a strong bullish candle above the down trend line and resistance level around $22, this will indicate a strong bullish signal. Likewise, this is supported by a bullish divergence signal from the awesome oscillator. Otherwise, a failure of the psychological level of $19 may lead to price dropping further.
Furthermore, we need to look beyond technical analysis. Fundamental analysis also has some insights for our decisions.
Fundamentals for INTC established a bearish bias. The summary is as follows:
Financial Health :
• Negative EPS (-$4.47): Intel is losing money.
• High Debt ($50B): This can limit growth and increase risk.
• Declining Revenue: Sales dropped from $80B (2021) to $51B (2024).
Valuation:
• Cheap P/S (1.66x), but no P/E (due to negative earnings).
• Dividend yield (2.56%) is at risk of being cut.
Sentiment:
Stock price fell from $56 to $19.55 (65% drop). Institutional investors may be wary.
Fundamentally, INTC is weak — best suited for speculative, long-term bets (if you believe in a turnaround).
Strategy for Traders:
1. Conservative Approach:
- Wait for:
- Break out of downtrend line and resistance around $22 and positive earnings/news.
- Rising volume to confirm momentum.
- Target: $27–$30
- Stop-loss: Below $17 (apply proper risk management).
2. Aggressive Approach:
- Buy near $18–$19 with tight stop-loss ($16).
- Target resistance level at $22.
3. Avoid If:
- You’re risk-averse or prefer stable companies.
- Intel’s debt/revenue trends worsen.
Note:
- Short-Term Trade: Only if breakout confirms ($22+). High risk, but possible 20% bounce.
- Long-Term Investment: Avoid unless Intel shows profit/debt improvement.
Always use stop-losses —Intel’s fundamentals make it volatile.
Disclaimer: This is not a financial advice. The outcome maybe different from the projection. Don't take the signal if you can't accept the risk.

INTC Weekly Options Trade Plan 2025-05-26INTC Weekly Analysis Summary (2025-05-26)
Model Summaries
Grok/xAI Report
Technicals: INTC at $20.05, below 10/50 EMAs on M5 and well below 200 EMA; RSI(10) ~36 signals bearish momentum; MACD negative; price near lower Bollinger Band. Sentiment: VIX elevated at 22.29; mixed news but bearish outweighs bullish; options max pain at $21 may cap upside. Recommendation: Buy $20.00 weekly put at $0.41; profit target $0.62 (50% gain); stop-loss $0.20 (50% premium loss); hold to May 30 expiry. Confidence 65%.
Claude/Anthropic Report
Technicals: Strong short‐ and medium‐term bearish (price below all EMAs, RSI ~36–38, MACD negative, volume spike confirms selloff). Sentiment: Rising VIX, negative headlines, heavy put OI at $20 strike. Max pain $21 above spot. Recommendation: Buy $20.00 weekly put at $0.41; primary target $0.62 (50% gain), secondary $0.72; stop‐loss 25% premium ($0.31) or if INTC >$20.15; exit by Wed EOD. Confidence 72%.
Gemini/Google Report
Technicals: Bearish on M5 and daily (below 10/50/200 EMAs, RSI weak but not deeply oversold, bearish MACD). Sentiment: VIX rising; negative news flow; put demand greater than calls; max pain less relevant vs. momentum. Recommendation: Buy $19.50 weekly put at $0.22–$0.25 limit; profit target $0.44 (100% gain); stop‐loss $0.11 (50% premium) or if INTC >$20.40; size 1 contract for small account; exit EOD. Confidence 75%.
Llama/Meta Report
Technicals: Daily and M5 bearish (price below all EMAs, MACD negative); RSI ~38 suggests possible bounce but trend remains down; price near lower Bollinger Band. Sentiment: VIX up; mixed news but bearish tilt; max pain $21 unlikely this week. Recommendation: Buy $20.00 weekly put at $0.41; profit target $0.615; stop‐loss if INTC >$20.50; hold to expiry. Confidence 70%.
DeepSeek Report
Technicals: Bearish momentum (below all EMAs, negative MACD, daily RSI ~38); support at $20.02–$20.03 and lower band at $19.41. Sentiment: Elevated VIX; mixed news; heavy put OI at $20 strike; call interest at $21 as resistance. Recommendation: Buy $20.00 weekly put at $0.41 midpoint; profit target $0.62 (50%); stop‐loss if INTC >$20.10; close by Thursday EOD. Confidence 65%. Areas of Agreement and Disagreement
Agreement
All models view INTC as bearish into weekly expiry. Consensus on buying puts, with most favoring the $20.00 strike. Targeting a 50% gain on premium and risking ~25–50% premium loss. Entry timing at market open and holding into expiry or early in the week. Elevated VIX and heavy put open interest reinforce bearish bias.
Disagreement
Gemini prefers the $19.50 put for greater leverage vs. $20.00 put. Stop‐loss levels vary: from $20.10 up to $20.50 underlying or premium-based stops. Exit timing differs: some through expiry, others midweek to reduce theta decay. Profit‐target aggressiveness: 50% vs. 100% gains. Conclusion
Overall Market Direction Consensus: Bearish
Recommended Trade
Strategy: Buy single-leg naked put Option: INTC 2025-05-30 expiry, $20.00 strike put Premium: $0.41 per contract Entry Timing: At market open Profit Target: $0.62 (≈50% premium gain) Stop Loss: $0.20 (≈50% premium loss) Size: 1 contract Confidence Level: 70%
Key Risks and Considerations
Short-term oversold RSI may trigger a bounce around $20.00 support. Max pain at $21.00 could exert slight upward pressure if market stabilizes. Volatility drop (VIX normalization) could compress option premiums (vol crush). Weekly options have rapid theta decay; managing timing is critical. Liquidity and bid-ask spreads may widen at open—use limit orders.
TRADE_DETAILS (JSON Format)
{ "instrument": "INTC", "direction": "put", "strike": 20.0, "expiry": "2025-05-30", "confidence": 0.70, "profit_target": 0.62, "stop_loss": 0.20, "size": 1, "entry_price": 0.41, "entry_timing": "open", "signal_publish_time": "2025-05-26 09:30:00 UTC-04:00" } 📊 TRADE DETAILS 📊 🎯 Instrument: INTC 🔀 Direction: PUT (SHORT) 🎯 Strike: 20.00 💵 Entry Price: 0.41 🎯 Profit Target: 0.62 🛑 Stop Loss: 0.20 📅 Expiry: 2025-05-30 📏 Size: 1 📈 Confidence: 70% ⏰ Entry Timing: open 🕒 Signal Time: 2025-05-26 11:39:04 EDT
Disclaimer: This newsletter is not trading or investment advice but for general informational purposes only. This newsletter represents my personal opinions based on proprietary research which I am sharing publicly as my personal blog. Futures, stocks, and options trading of any kind involves a lot of risk. No guarantee of any profit whatsoever is made. In fact, you may lose everything you have. So be very careful. I guarantee no profit whatsoever, You assume the entire cost and risk of any trading or investing activities you choose to undertake. You are solely responsible for making your own investment decisions. Owners/authors of this newsletter, its representatives, its principals, its moderators, and its members, are NOT registered as securities broker-dealers or investment advisors either with the U.S. Securities and Exchange Commission, CFTC, or with any other securities/regulatory authority. Consult with a registered investment advisor, broker-dealer, and/or financial advisor. By reading and using this newsletter or any of my publications, you are agreeing to these terms. Any screenshots used here are courtesy of TradingView. I am just an end user with no affiliations with them. Information and quotes shared in this blog can be 100% wrong. Markets are risky and can go to 0 at any time. Furthermore, you will not share or copy any content in this blog as it is the authors' IP. By reading this blog, you accept these terms of conditions and acknowledge I am sharing this blog as my personal trading journal, nothing more.

Intel Breakdown Alert! Bearish Setup with High R:R Opportunity !📉 Intel Corporation (INTC) – Bearish Setup Analysis
Timeframe: 4H | Ticker: NASDAQ:INTC | Exchange: NASDAQ
🔍 Technical Breakdown
We are currently observing a potential bearish reversal on Intel Corp. following a clear breakdown from a rising parallel channel on the 4H chart.
🟦 Pattern Observed
Price was previously moving within a rising channel, forming higher highs and higher lows – a typical short-term bullish structure.
Recently, price broke down below the lower boundary of this channel, signaling a potential shift in momentum from bullish to bearish.
📌 Trade Setup
Entry Zone: Between $20.22 – $20.06
Price is currently trading in this zone, presenting a potential short entry opportunity following the channel breakdown.
Stop Loss: $21.77
Placed above the previous resistance zone and the broken channel. If the price reclaims this level, the bearish thesis is invalidated.
Final Target: $17.70
This level represents a key support zone from previous price action and aligns with potential measured move from the channel breakdown.
✅ Why This Setup?
Channel Breakdown
A break below a well-defined channel often marks a change in trend. This gives a high-probability setup for trend reversal traders.
Bearish Momentum Confirmation
After the breakdown, price failed to reclaim the channel, and is now trading below the prior support, flipping it into resistance.
Risk/Reward Ratio
This setup offers an excellent R:R ratio, with downside potential toward $17.70 and a relatively tight stop just above the failed structure.
Market Structure Alignment
Lower highs and lower lows now appear to be forming post-breakdown, further confirming a potential bearish move ahead.
📉 Bias: Short
📈 Invalidation: Break and close above $21.77
🎯 Target: $17.70
🧠 Disclaimer: This is not financial advice. Always do your own research and manage your risk accordingly. Trade safe!

Intel (INTC): Bullish Signs Emerging, Eyes on $75 ATHIntel (INTC) has started to show strong bullish signals, confirming a reversal after refusing to drop below $18. The stock has since climbed to $27, signaling renewed investor confidence and a potential breakout in the coming months.
Key Resistance Levels: The Path to $75
$30: The first critical resistance level that Intel must break to continue its bullish momentum.
$37: A key milestone that, if surpassed, would strengthen the uptrend.
$75 (All-Time High): The ultimate long-term target.
If Intel successfully breaks above $37, it could trigger a sustained rally toward its ATH of $75, potentially supported by industry advancements and stronger financial performance.
Risk Scenario: Consolidation and Potential Drop to $12
If Intel fails to break $30, it could enter a multi-year consolidation phase.
A prolonged range between $12 and $30 could play out if bullish momentum fades.
In a worst-case scenario, Intel could hunt the $12 level, creating a long-term accumulation zone before attempting another breakout.
Summary: Bullish Structure with Key Levels to Watch
Intel’s refusal to drop below $18 and its climb to $27 signal growing bullish momentum.
Break Above $30: Signals continuation to $37, then a long-term push toward $75.
Failure at $30: Could lead to a multi-year consolidation, ranging between $12 and $30.
The next few months will be crucial in determining whether Intel resumes a strong uptrend or enters a long accumulation phase before the next major breakout.

Intel ($INTC) at a Crossroads: Breakup Talks, Market PressuresIntel Corporation (NASDAQ: NASDAQ:INTC ) finds itself at a critical juncture as reports emerge about Broadcom and Taiwan Semiconductor Manufacturing Co. (TSMC) exploring potential deals that could split the storied chipmaker into two entities. This revelation comes amidst Intel’s ongoing struggles in maintaining its dominance in the semiconductor industry, intensified by leadership changes, manufacturing setbacks, and increasing market competition.
Broadcom & TSMC’s Interest in Intel
The Wall Street Journal recently reported that Intel rivals Broadcom and TSMC are each considering deals that would divide the company. Broadcom is reportedly analyzing Intel’s chip design and marketing business, with discussions about a potential bid, though any move would depend on securing a partner for Intel’s manufacturing division. Meanwhile, TSMC has expressed interest in taking control of Intel’s chip plants, potentially through an investor consortium.
The U.S. government is closely monitoring these developments, as Intel is viewed as a company of national security significance. Reports indicate that the Trump administration is unlikely to support a foreign entity operating Intel’s U.S. factories, adding an additional layer of complexity to any potential deal.
Intel was a major beneficiary of the Biden administration’s push to onshore semiconductor manufacturing, securing a $7.86 billion government subsidy. However, the company has struggled to execute its ambitious plans. Former CEO Pat Gelsinger set high expectations for Intel’s manufacturing and AI capabilities, but his failure to deliver led to lost contracts, a 60% drop in the company’s stock value in 2023, and layoffs affecting 15% of its workforce.
Technical Outlook
Intel’s stock (NASDAQ: NASDAQ:INTC ) closed last Friday’s session down 2.2%, but premarket trading on Monday shows signs of recovery with a 0.06% uptick. The technical indicators suggest that NASDAQ:INTC could be on the cusp of a bullish reversal, contingent on broader market sentiment.
The Relative Strength Index (RSI) for Intel stood at 68 on Friday. This reading positions the stock near the overbought threshold but also signals that momentum is building towards a potential breakout. Also, Intel is currently trading above key moving averages, reinforcing a bullish sentiment in the near term.
Should a pullback occur, immediate support is found at the 38.2% Fibonacci retracement level, which may serve as a demand zone for NASDAQ:INTC shares. In the event of extreme selling pressure, a drop to the one-month low of $18.50 could materialize, though such a scenario would require a significant bearish catalyst.
If bullish momentum takes hold, a breakout above resistance levels could push Intel’s stock higher, aligning with analyst expectations. The 12-month price forecast for NASDAQ:INTC stands at $25.69—an 8.86% increase from its current price.
Conclusion
Intel’s potential breakup remains speculative, but the fundamental challenges it faces underscore why such discussions are taking place. While concerns about cash flow, leadership changes, and market competition weigh on the stock, technical indicators suggest that NASDAQ:INTC may be approaching a bullish reversal.
With a critical trading week ahead, investors should monitor key support and resistance levels while staying informed about any further developments in the Broadcom and TSMC discussions. If Intel successfully capitalizes on government support and restructures its strategy, a resurgence in investor confidence could follow, pushing NASDAQ:INTC back into bullish territory.

INTC - Will they be Acquired? 30% UpsideNASDAQ:INTC - CHARTURDAY 📈
WOW! Intel has been on a tear as of late due to acquisition talks...
- Double Bottom in play here
- Volume Shelf with GAP to $30 🎯
DB Breakout = 🎯 $34.50
I personally don't like trading acquisition names.
Not financial advice

Intel - Back To A Bullish Market!Intel ( NASDAQ:INTC ) perfectly rejected a major previous support:
Click chart above to see the detailed analysis👆🏻
After being cut in half multiple times over the past couple of months, Intel finally managed to reverse at a strong previous support level. However market structure is still clearly not bullish and Intel has to break above the next resistance to start creating a new overall uptrend.
Levels to watch: $26, $20
Keep your long term vision,
Philip (BasicTrading)

Intel - Is this for real?NASDAQ:INTC created a top formation and is dropping hashly ever since - be careful!
Click image above to see detailed analysis
Catching falling knifes will go wrong 9 out of 10 times and you will cut yourself very badly. Just in a couple of months, Intel is down about -65% and is not slowing down at all. This honestly seems like the possibility of bankruptcy is not that far away and investors and trader should be extra careful. We have support coming soon, but the question is: will it stabilize price?
Levels to watch: $18
Keep your long term vision,
Philip - BasicTrading


Intel - Potential Trading SetupHello Traders, welcome to today's analysis of Intel.
--------
Explanation of my video analysis:
In 2017 we had a major triangle breakout on Intel which was followed by a +70% rally. Then in 2022 Intel broke major support towards the downside and reversed perfectly at a major previous structure. Since Intel is now back to a bullish market, I am just waiting for a retest of the level mentioned in the analysis and then I will be looking for long continuation setups.
--------
I will only take a trade if all the rules of my strategy are satisfied.
Let me know in the comment section below if you have any questions.
Keep your long term vision.

INTC IS A BIG LONG TERM BUY TRUST MEINTC is looking very good my friends. It is a good time to buy long and hold. Minimum position length I would say 2 months. Maximum length infinite. Do not be dumb. INTC is INTC we are living in computer world. NOW REMIND ME WHAT CPU STANDS FOR. CENTRAL PROCESSING UNIT. WITHOUT CPU THEN COMPUTER IS MORE LIKE PPU (POOPY POOP UNIT) ONLY 2 BIG CPU AMD AND INTC AMD IS BEING PPU BUT INTC BEING BCPU (BEAST CENTRAL PROCESSING UNIT) so be smart my friends. ride with me into Valhalla. WITNESS ME

Intel: Go for it! 💪 Since the low of wave x in orange, Intel has already shown strong upwards movement and should soon conquer the resistance at $37.11, heading for the compound consisting of the turquoise zone between $41.59 and $43.13 and the orange zone between $42.32 and $43.63. There, the share should complete wave 4 in turquoise and return below $37.11 afterward. However, there is a 34% chance that Intel could shift southwards earlier already and drop below the support at $26.86, triggering further descent below $24.55. In that case, we would consider wave alt.4 to be finished by now.

INTC - Price Targets & Stop Loss📈 What’s up investors! 📉
Welcome back to another one of
💡“Mike’s Ideas”.💡
I post as I find signals… these signals are based on the personal rules I have built and follow in order to make up what I call the “SST Strategy”. Follow for more ideas in the future!!
I have 4 levels marked and colour coded on the Chart.
These levels are:
⚪ White = Entry Point
🔴 Red = Stop Loss
🟢 Green = 1.2:1 Risk Reward Ratio
🟡 Yellow = 1.5:1 Risk Reward Ratio
🔵 Blue = 2:1 Risk Reward Ratio
👀 So what are we looking at today…!!!
🚨( INTC ) Intel Corporation🚨
Intel Corporation engages in the design, manufacture, and sale of computer products and technologies worldwide. The company operates through CCG, DCG, IOTG, Mobileye, NSG, PSG, and All Other segments. It offers platform products, such as central processing units and chipsets, and system-on-chip and multichip packages; and non-platform or adjacent products, including accelerators, boards and systems, connectivity products, graphics, and memory and storage products. The company also provides high-performance compute solutions for targeted verticals and embedded applications for retail, industrial, and healthcare markets; and solutions for assisted and autonomous driving comprising compute platforms, computer vision and machine learning-based sensing, mapping and localization, driving policy, and active sensors. In addition, it offers workload-optimized platforms and related products for cloud service providers, enterprise and government, and communications service providers. The company serves original equipment manufacturers, original design manufacturers, and cloud service providers. Intel Corporation has a strategic partnership with MILA to develop and apply advances in artificial intelligence methods for enhancing the search in the space of drugs. The company was incorporated in 1968 and is headquartered in Santa Clara, California.

INTC stonks under 4th Elliott's wave This is an update regarding last update for INTC stonks. In M1 we can easily see 4th Elliott's wave begins, so I recommend to wait till 5th wave for some buys

INTC in trouble!Intel Corporation
Short Term
We look to Sell at 35.22 (stop at 36.86)
Preferred trade is to sell into rallies. The medium term bias remains bearish. Price action has been negative with losses breaking below our previous support level and we expect a further drive lower to follow. There is scope for mild buying at the open but gains should be limited.
Our profit targets will be 31.92 and 30.18
Resistance: 35.00 / 40.20 / 43.80
Support: 33.73 / 32.50 / 29.00
Disclaimer – Saxo Bank Group. Please be reminded – you alone are responsible for your trading – both gains and losses. There is a very high degree of risk involved in trading. The technical analysis, like any and all indicators, strategies, columns, articles and other features accessible on/though this site (including those from Signal Centre) are for informational purposes only and should not be construed as investment advice by you. Such technical analysis are believed to be obtained from sources believed to be reliable, but not warrant their respective completeness or accuracy, or warrant any results from the use of the information. Your use of the technical analysis, as would also your use of any and all mentioned indicators, strategies, columns, articles and all other features, is entirely at your own risk and it is your sole responsibility to evaluate the accuracy, completeness and usefulness (including suitability) of the information. You should assess the risk of any trade with your financial adviser and make your own independent decision(s) regarding any tradable products which may be the subject matter of the technical analysis or any of the said indicators, strategies, columns, articles and all other features.
Please also be reminded that if despite the above, any of the said technical analysis (or any of the said indicators, strategies, columns, articles and other features accessible on/through this site) is found to be advisory or a recommendation; and not merely informational in nature, the same is in any event provided with the intention of being for general circulation and availability only. As such it is not intended to and does not form part of any offer or recommendation directed at you specifically, or have any regard to the investment objectives, financial situation or needs of yourself or any other specific person. Before committing to a trade or investment therefore, please seek advice from a financial or other professional adviser regarding the suitability of the product for you and (where available) read the relevant product offer/description documents, including the risk disclosures. If you do not wish to seek such financial advice, please still exercise your mind and consider carefully whether the product is suitable for you because you alone remain responsible for your trading – both gains and losses.

Intel bullish hammer? Intel Corporation
Short Term
We look to Buy at 35.87 (stop at 34.61)
Preferred trade is to buy on dips. Price action looks to be forming a bottom. Posted a Bullish Hammer Bottom on the Daily chart. Further upside is expected and we look to set longs in early trade.
Our profit targets will be 39.04 and 40.60
Resistance: 39.05 / 40.75 / 43.80
Support: 35.50 / 32.50 / 29.00
Disclaimer – Saxo Bank Group. Please be reminded – you alone are responsible for your trading – both gains and losses. There is a very high degree of risk involved in trading. The technical analysis, like any and all indicators, strategies, columns, articles and other features accessible on/though this site (including those from Signal Centre) are for informational purposes only and should not be construed as investment advice by you. Such technical analysis are believed to be obtained from sources believed to be reliable, but not warrant their respective completeness or accuracy, or warrant any results from the use of the information. Your use of the technical analysis, as would also your use of any and all mentioned indicators, strategies, columns, articles and all other features, is entirely at your own risk and it is your sole responsibility to evaluate the accuracy, completeness and usefulness (including suitability) of the information. You should assess the risk of any trade with your financial adviser and make your own independent decision(s) regarding any tradable products which may be the subject matter of the technical analysis or any of the said indicators, strategies, columns, articles and all other features.
Please also be reminded that if despite the above, any of the said technical analysis (or any of the said indicators, strategies, columns, articles and other features accessible on/through this site) is found to be advisory or a recommendation; and not merely informational in nature, the same is in any event provided with the intention of being for general circulation and availability only. As such it is not intended to and does not form part of any offer or recommendation directed at you specifically, or have any regard to the investment objectives, financial situation or needs of yourself or any other specific person. Before committing to a trade or investment therefore, please seek advice from a financial or other professional adviser regarding the suitability of the product for you and (where available) read the relevant product offer/description documents, including the risk disclosures. If you do not wish to seek such financial advice, please still exercise your mind and consider carefully whether the product is suitable for you because you alone remain responsible for your trading – both gains and losses.

INTC $INTC Initial ShortINTC $INTC Initial Short. TP and SL on chart. Move SL on TP. After TP2, trail with 0.5ATR step and 1.5ATR offset.

INTC Double BottomIf you haven`t bought the $44 strong support:
Then you should know that Nvidia and Intel might join forces to end Chip Shortage!
I expect INTC will go to $56.
Looking forward to read your opinion about it.
