INTC - What It will look like if it doesn't turn Bearish This green curve on INTC may create a temporary support for price allowing the bull run to continue
I expect a double bottom if this occurs and then a bull move up towards the orange dotted line.
If the green line breaks it looks more bearish than bullish.
Intel

Trade Like A Sniper - Episode 21 - INTC - (7th June 2024)This video is part of a video series where I backtest a specific asset using the TradingView Replay function, and perform a top-down analysis using ICT's Concepts in order to frame ONE high-probability setup. I choose a random point of time to replay, and begin to work my way down the timeframes. Trading like a sniper is not about entries with no drawdown. It is about careful planning, discipline, and taking your shot at the right time in the best of conditions.
A couple of things to note:
- I cannot see news events.
- I cannot change timeframes without affecting my bias due to higher-timeframe candles revealing its entire range.
- I cannot go to a very low timeframe due to the limit in amount of replayed candlesticks
In this session I will be analyzing Intel (INTC), starting from the 6-Month chart.

Intel - Reversing to the upside!Hello Traders and Investors, today I will take a look at Intel .
--------
Explanation of my video analysis:
On the chart of Intel there are actually two major horizontal structure levels which you have to keep an eye on. First of all there is quite strong support at the $26 level and just a couple of months ago Intel rejected this support towards the upside. Vice versa there is resistance at the $44 level, always pushing price lower. As we are speaking Intel is also retesting a minor support so there is the chance to capitalize on a short term bounce.
--------
Keep your long term vision,
Philip (BasicTrading)

$INTC Long Trade Taking long entry on $INTC. No leverage.
I want 4hr to get above 50MA and hold @ $31.97 to look good.
Risk/Reward = 1/7
Entry: $31.81
Target: $34
Stop loss: $31.48

Intel - Stop the bleeding!Hello Traders and Investors, today I will take a look at Intel .
--------
Explanation of my video analysis:
In the beginning of 2023 Intel stock retested a multi year long horizontal structure at the $26 level. Here Intel created bullish confirmation and took off, creating a crazy rally of +100% within a couple of months. Then we saw a false breakout towards the upside which was followed by an incredible sell off. At the moment Intel is retesting support so we might see a short term short covering rally.
--------
Keep your long term vision,
Philip (BasicTrading)

🍌🍌 SUPERMICRO — AI INFRASTRUCTURE STOCKS GO BANANA Supermicro is an American company, a major manufacturer of motherboards, cases, power supplies, cooling systems, SAS controllers, Ethernet and InfiniBand. The company specializes in the production of x86-server platforms and various components for servers, workstations and data storage systems. The headquarters is located in San Jose, USA. Founded in 1993.
Supermicro, Inc., a provider of end-to-end IT solutions for cloud computing, artificial intelligence/machine learning, storage, and 5G/Edge communications, continues to expand its data center portfolio with NVIDIA end-to-end rack cabinet solutions HGX H100 equipped with liquid cooling systems.
Supermicro's advanced liquid cooling technologies help reduce time-to-commissioning, improve performance levels, and reduce data center operating costs while dramatically reducing energy efficiency.
It is estimated that when using Supermicro liquid cooling systems (compared to air-cooled data centers), data centers save up to 40% in terms of power costs. In addition, direct cooling costs can be reduced by up to 86% compared to existing data centers.
"Supermicro continues to lead the industry by meeting the ever-growing needs for AI systems and modern data centers around the world," said Charles Liang, President and CEO of Supermicro.
AI-optimized racks powered by Supermicro's latest product lines, including server product lines from AMD, can be quickly created from standard engineering templates and easily customized to meet unique user requirements.
The ultra-modern GPU liquid cooling server includes dual processors from NASDAQ:INTC or NASDAQ:AMD and four or eight interconnected NVIDIA ( NASDAQ:NVDA ) HGX H100 Tensor Core GPUs.
The use of liquid cooling systems can reduce the energy consumption of data centers by up to 40%, which in turn leads to lower operating costs.
In addition, both systems significantly outperform previous generation NVIDIA HGX GPU-powered solutions, delivering up to 30x performance gains and improved efficiency of today's Transformers with faster connections between GPUs and networks and storage built with PCIe 5.0 standard.
The technical picture illustrates the possibility of continued explosive growth in Supermicro shares, which are up more than 160 percent since the beginning of the year.

Intel Stock: Quantum Leap in Technology, Potential Takeoff for IThesis: Intel's recent breakthrough in silicon spin qubits has the potential to revolutionize quantum computing. This advancement could lead to high-volume production of miniaturized quantum processors and interconnected processor networks, significantly boosting Intel's stock price.
Key Points:
* Intel achieved **99.9% gate fidelity** in silicon-based quantum processors, a significant milestone for scalable and fault-tolerant quantum computers.
* This breakthrough leverages Intel's expertise in CMOS manufacturing, enabling **mass production** of quantum processors on a single chip.
* Intel envisions a network of interconnected processors, creating a stable and powerful quantum computing platform.
* Democratization of quantum computing on silicon could benefit the entire industry and unlock new possibilities.
Investment Recommendation:
* **Long INTC** with entry at $32.80.
* Price targets range from $34.61 to $70, with potential for significant upside.
* Stop-loss recommendation at $24.63 for risk management.
Why This Matters to Traders:
* Intel's leadership in quantum computing positions them for major growth in a rapidly developing field.
* The potential applications of quantum computing are vast, impacting various industries and sectors.
* Early investment in Intel could provide substantial returns as quantum computing matures.

Intel - What is going on?Hello Traders and Investors, today I will take a look at Intel Corporation.
--------
Explanation of my video analysis:
In April of 2022 we saw a major break towards the downside on Intel stock which was then followed by more bearish continuation of roughly -65%. Then Intel retested a multi year long structure and created a pretty decent bullish reversal and a strong (short covering rally). At the moment Intel just rejected previous structure and is now in a massively bearish market soit is best to just wait for this volatility to calm down.
--------
Keep your long term vision,
Philip (BasicTrading)

Intel's Gaudi 3 AI Chip Unveiled: A Race Against NvidiaIntel ( NASDAQ:INTC ) has raised the stakes in the competitive arena of artificial intelligence (AI) chips by unveiling its latest innovation, the Gaudi 3. As chipmakers intensify their efforts to produce semiconductors capable of training and deploying complex AI models, Intel's Gaudi 3 emerges as a formidable contender, poised to challenge Nvidia's dominance in the AI chip market. With promises of superior performance and energy efficiency, Intel aims to carve out a significant share in this rapidly evolving landscape, signaling a new chapter in the battle for AI supremacy.
Gaudi 3: A Leap Forward in AI Chip Technology:
Intel's Gaudi 3 chip represents a significant advancement in AI chip technology, boasting impressive power efficiency and enhanced performance capabilities. With claims of being over twice as power-efficient and one-and-a-half times faster than Nvidia's H100 GPU, the Gaudi 3 sets a new benchmark for AI processing efficiency. Designed to cater to a range of AI applications, from deployment training, the Gaudi 3 showcases Intel's commitment to innovation and technological excellence.
Rivalry with Nvidia:
The unveiling of the Gaudi 3 signals Intel's intent to challenge Nvidia's dominant position in the AI chip market. With Nvidia currently holding an estimated 80% market share, Intel's entry poses a significant threat to Nvidia's supremacy. Intel's competitive pricing strategy, coupled with its distinctive features such as the integrated network on chip, positions the Gaudi 3 as a compelling alternative to Nvidia's offerings.
Expanding Market Opportunities:
As the demand for AI chips continues to surge, fueled by the growth of cloud computing and AI-driven applications, Intel sees significant expansion opportunities. In particular, the data center AI market is expected to witness robust growth as cloud providers and businesses invest in AI infrastructure. With the Gaudi 3 poised to address the evolving needs of AI builders and developers, Intel aims to capitalize on these market trends and capture a larger share of the AI chip market.
Collaborative Ecosystem and Open Software Approach:
In its pursuit of market leadership, Intel is adopting a collaborative approach, partnering with industry giants such as Google, Qualcomm, and Arm to develop open software solutions for AI. By fostering an open ecosystem and providing software flexibility, Intel aims to empower customers with the freedom to choose their preferred chip providers, challenging Nvidia's proprietary software suite.
Conclusion:
Intel's unveiling of the Gaudi 3 AI chip marks a significant milestone in the company's quest to challenge Nvidia's dominance in the AI chip market. With promises of superior performance, energy efficiency, and competitive pricing, the Gaudi 3 emerges as a potent contender in the race for AI supremacy. As Intel continues to innovate and expand its presence in the AI ecosystem, the competition between chipmakers intensifies, promising exciting developments and advancements in the field of artificial intelligence.
Note: Intel's Gaudi 3 chip is expected to be available to customers in the third quarter, heralding a new era of AI processing capabilities.

RiskMastery's Red Flag Stocks - INTEL EditionWelcome to RiskMastery's Red Flag Stocks - Stocks with bearish potential.
In this edition, we'll be looking at NASDAQ:INTC ...
I believe this code is at a point of potential volatility.
If price can hold below $38.71 ... Bearish potential may be unlocked.
My key downside targets include:
- $35.15 (Conservative)
- $30.25 (Medium)
- $26.21 (Aggressive)
If however price breaks above $42.94 ... Bullish potential may be unlocked.
(My key risk targets - C, M,& A - are as noted on the chart)
Enjoy, and I look forward to being of further service into the future.
If you'd like to connect, feel free to reach out and comment below.
Mr RM | Risk Mastery
Disclaimer:
This post is intended for educational purposes only - Publicly available RiskMastery information & content is not intended to be financial advice in any shape or form. Please do your own research and seek advice from a licensed professional before acting on any of the information contained within this post. This post is not a solicitation or recommendation to buy, sell or hold any positions in any financial instrument. All demonstrated trades are merely incidental to the educational training RiskMastery aims to provide. You are solely responsible for your own investment and trading decisions, of which should be made only according to your own opinion, knowledge and experience. You should not rely on any of the information contained on this site or contained in any RiskMastery material on any website or platform. You assume the sole risk of any trade or investment you elect to make. RiskMastery and affiliates shall not be liable to you for any monetary losses or any other damages incurred directly or indirectly, from your use, reliance or reference of RiskMastery materials, content and educational information. Thank you for your understanding and cooperation - We look forward to working with you into the future to navigate the fine line of trading and investment success.

INTC potential buy setupReasons for bullish bias:
- Price bounced from strong weekly support
- Price respected channel support
- Weekly and daily bullish candle closing
Entry Level (CMP): 43.28
Stop Loss Level: 39.56
Take Profit Level 1: 47
Take Profit Level 2: 50.72
Take Profit Level 3: Open

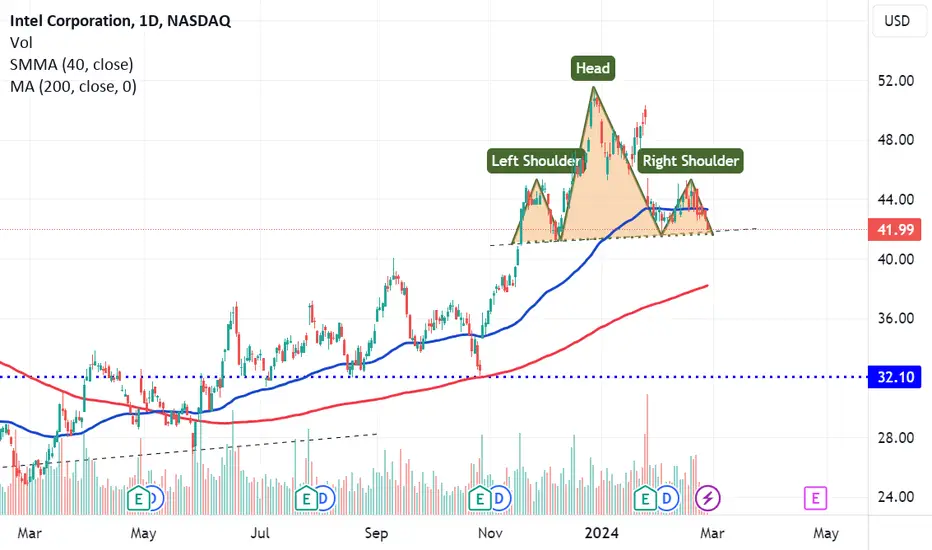
$INTC Ominous looking chart Head and shoulders formation
A break of the neckline could see a target all the way down to $32
Nothing goes in a straight line, so the expectation is that the neckline could be tested more than once before either breaking down, or even going up.
Intel Corporation UpWe hit support.
We had 2 good days up strong buying from support.
Great opportunity for a 1/1 trade.

S&P 500 prime for a correction, BUT are we done with the run?How long do we stay below 5400 - SP500? is the real question. Are we going to see a sideways range through the fall? Do we get a rip roaring 10-15% correction and "L" or even better "V" recovery? The path does not matter as much but here is my commentary anyway.
I think that we see a temporary high in early April as we power through the rest of Q1 earnings then take a breath.12% correction? -> 480 looks like a good support? over a couple months? May usually sucks, do we see a bottom in May with the "sell in May and go away" crowd? But I cant imagine much of a stay there with a gap down 5% bull run or a 3% turn around Tuesday. Not to mention the June cut expectations that will get early mover money flowing.
I think the news goes with the fed cuts rates minus some black swan. You can almost mark our cycles to the fed rate decisions over the past 3-4 years. I could see a build up into June with expectations of rate cuts.
Inflation remains in a downward trend. Manufacturing has been contracting. The big R word won't go away! Tax returns may stem a few more higher inflation readings that scare the market. Good correction fodder. But also good rate cut fodder.
My Elliott wave charting (my own work) tells me that we could be near the top of wave 3 with a wave 5 to go. (Mind you I believe this is part of large wave 3. LETS GO 2025. Years of the bull. ROARING 20s.)
Billions of dollars of stimulus sloshing around. Intel microchip plant in IN. Ford Blue Oval in TN Toyota in NC.
Look at United Rentals..
Looking at their revenue a 40% increase since pre stimulus. 300 % increase in market cap in the same time frame. Maybe you want to say "but Zaphod... inflation". Even if you say the price has doubled for market value rentals, that is still 150% increase in expectations. Growth is expected with a 20 PE.
That is a massive amount of building. Building infrastructure to support technology advances, our massive vehicle trash pile, the AI revolution, war machines, airplanes etc... Billions of dollars, then billions more dumped into these projects.
Small caps and medium cap: Russell 2k, Even split SP500: The catch up trade could certainly drive us higher into 2025. All the billions that people just cashed out of Apple and Tesla(watch out below!), just looking for a new home. Let the rate cuts come and watch the second half of this year explode. 5800?
Final note for today: exponential growth is going to continue until the collapse of society. 2% inflation charted is still exponential. Stay in the market, be a bull, you win more. You will hate the wild rides down unless you are patient and GREEDY when the fear is real.
I am obviously making all this up to fan my biases so do your own speculating. Comment the thoughts below.

Intel: Bullish Gartley with Bullish Divergence Targeting $64.19Leading to the most recent earnings report, Intel had reached a 61.8% retrace from High to Low and was showing signs of reversing, so I decided to take profit on Intel. Now, upon spotting a potential trend continuation Bullish Gartley I now think it's possible for INTC to recover from here and perhaps go all the way for the 0.886 at $64.90, so I will be buying back in at these lower prices.
For context on the previous bullish setup, check the chart below:

Intel - Potential Trading SetupHello Traders, welcome to today's analysis of Intel.
--------
Explanation of my video analysis:
In 2017 we had a major triangle breakout on Intel which was followed by a +70% rally. Then in 2022 Intel broke major support towards the downside and reversed perfectly at a major previous structure. Since Intel is now back to a bullish market, I am just waiting for a retest of the level mentioned in the analysis and then I will be looking for long continuation setups.
--------
I will only take a trade if all the rules of my strategy are satisfied.
Let me know in the comment section below if you have any questions.
Keep your long term vision.

The Momentum Indicator moved below the 0 level on January 26, 20INTC in downward trend: price dove below 50-day moving average on January 26, 2024
INTC moved below its 50-day moving average on January 26, 2024 date and that indicates a change from an upward trend to a downward trend. In 33 of 43 similar past instances, the stock price decreased further within the following month. The odds of a continued downward trend are 77%.
Technical Analysis (Indicators)
Bearish Trend Analysis
The 10-day RSI Indicator for INTC moved out of overbought territory on January 02, 2024. This could be a bearish sign for the stock. Traders may want to consider selling the stock or buying put options. Tickeron's A.I.dvisor looked at 28 similar instances where the indicator moved out of overbought territory. In 20 of the 28 cases, the stock moved lower in the following days. This puts the odds of a move lower at 71%.
You may want to consider selling the stock, shorting the stock, or exploring put options on INTC as a result. In 52 of 87 cases where the Momentum Indicator fell below 0, the stock fell further within the subsequent month. The odds of a continued downward trend are 60%.
The Moving Average Convergence Divergence Histogram (MACD) for INTC turned negative on January 03, 2024. This could be a sign that the stock is set to turn lower in the coming weeks. Traders may want to sell the stock or buy put options. Tickeron's A.I.dvisor looked at 45 similar instances when the indicator turned negative. In 31 of the 45 cases the stock turned lower in the days that followed. This puts the odds of success at 69%.
Following a 3-day decline, the stock is projected to fall further. Considering past instances where INTC declined for three days, the price rose further in 50 of 62 cases within the following month. The odds of a continued downward trend are 60%.
The Aroon Indicator for INTC entered a downward trend on January 30, 2024. This could indicate a strong downward move is ahead for the stock. Traders may want to consider selling the stock or buying put options.
Bullish Trend Analysis
The Stochastic Oscillator is in the oversold zone. Keep an eye out for a move up in the foreseeable future.
Following a +1.35% 3-day Advance, the price is estimated to grow further. Considering data from situations where INTC advanced for three days, in 212 of 319 cases, the price rose further within the following month. The odds of a continued upward trend are 66%.
INTC may jump back above the lower band and head toward the middle band. Traders may consider buying the stock or exploring call options.
Fundamental Analysis (Ratings)
The Tickeron PE Growth Rating for this company is 16 (best 1 - 100 worst), pointing to outstanding earnings growth. The PE Growth rating is based on a comparative analysis of stock PE ratio increase over the last 12 months compared against S&P 500 index constituents.
The Tickeron Valuation Rating of 21 (best 1 - 100 worst) indicates that the company is slightly undervalued in the industry. This rating compares market capitalization estimated by our proprietary formula with the current market capitalization. This rating is based on the following metrics, as compared to industry averages: P/B Ratio (1.811) is normal, around the industry mean (8.080). P/E Ratio (16.010) is within average values for comparable stocks, (59.211). Projected Growth (PEG Ratio) (1.161) is also within normal values, averaging (2.358). Dividend Yield (0.017) settles around the average of (0.022) among similar stocks. P/S Ratio (3.446) is also within normal values, averaging (73.071).
The Tickeron Price Growth Rating for this company is 45 (best 1 - 100 worst), indicating steady price growth. INTC’s price grows at a higher rate over the last 12 months as compared to S&P 500 index constituents.
The Tickeron Seasonality Score of 50 (best 1 - 100 worst) indicates that the company is fair valued in the industry. The Tickeron Seasonality score describes the variance of predictable price changes around the same period every calendar year. These changes can be tied to a specific month, quarter, holiday or vacation period, as well as a meteorological or growing season.
The Tickeron SMR rating for this company is 90 (best 1 - 100 worst), indicating weak sales and an unprofitable business model. SMR (Sales, Margin, Return on Equity) rating is based on comparative analysis of weighted Sales, Income Margin and Return on Equity values compared against S&P 500 index constituents. The weighted SMR value is a proprietary formula developed by Tickeron and represents an overall profitability measure for a stock.
The Tickeron Profit vs. Risk Rating rating for this company is 93 (best 1 - 100 worst), indicating that the returns do not compensate for the risks. INTC’s unstable profits reported over time resulted in significant Drawdowns within these last five years. A stable profit reduces stock drawdown and volatility. The average Profit vs. Risk Rating rating for the industry is 59, placing this stock worse than average.
The last earnings report on January 25 showed earnings per share of 54 cents, beating the estimate of 44 cents. With 47.34M shares outstanding, the current market capitalization sits at 184.37B.
A dividend of $0.12 per share will be paid with a record date of March 01, 2024, and an ex-dividend date of February 06, 2024. The last dividend of $0.12 was paid on December 01. The ex-dividend date is usually set several business days before the record date. If a stock is purchased on its ex-dividend date or after, the next dividend payment will not be received. Instead, the dividends are repossessed by to the seller. If the stocks are purchased before the ex-dividend date, the buyer will receive the dividends.
Notable companies
The most notable companies in this group are NVIDIA Corp (NASDAQ:NVDA), Broadcom (NASDAQ:AVGO), Taiwan Semiconductor Manufacturing Company Ltd (NASDAQ:TSM), Advanced Micro Devices (NASDAQ:AMD), Intel Corp (NASDAQ:INTC), QUALCOMM (NASDAQ:QCOM), Texas Instruments (NASDAQ:TXN), Applied Materials (NASDAQ:AMAT), Lam Research Corp (NASDAQ:LRCX), Analog Devices (NASDAQ:ADI).
Industry description
The semiconductor industry manufacturers all chip-related products, including research and development. These chips are used in innumerable electronic devices, including computers, cell phones, smartphones, and GPSs. Intel Corporation, NVIDIA Corp., and Broadcomm are some of the prominent players in this industry. Semiconductor companies usually tend to do well during periods of healthy economic growth, thereby inducing further research and development in the industry – which in turn augurs well for productivity and growth in the economy. In the near future, demand for semiconductor products (and possibly innovation within the segment) should only expand further, with the proliferation of 5G, autonomous vehicles, IoT, and various AI-driven electronics set to herald a new, advanced chapter in the technology-driven world as we know it. With burgeoning prospects comes great competition. In 2015, SIA estimated that U.S. semiconductor industry ranks as the second most competitive U.S. industry out of 2882 U.S. industries designated manufacturers by the U.S. Census Bureau.
Market Cap
The average market capitalization across the Semiconductors Industry is 31.22B. The market cap for tickers in the group ranges from 13.43K to 1.12T. NVDA holds the highest valuation in this group at 1.12T. The lowest valued company is CYBL at 13.43K.
High and low price notable news
The average weekly price growth across all stocks in the Semiconductors Industry was -2%. For the same Industry, the average monthly price growth was -1%, and the average quarterly price growth was 1%. ASMXF experienced the highest price growth at 19%, while QUIK experienced the biggest fall at -18%.
Volume
The average weekly volume growth across all stocks in the Semiconductors Industry was 41%. For the same stocks of the Industry, the average monthly volume growth was 78% and the average quarterly volume growth was 38%
Fundamental Analysis Ratings
The average fundamental analysis ratings, where 1 is best and 100 is worst, are as follows
Valuation Rating: 57
P/E Growth Rating: 46
Price Growth Rating: 50
SMR Rating: 65
Profit Risk Rating: 58
Seasonality Score: 27 (-100 ... +100)
PYTH:INTC

INTCIntel Corporation.
The same reasoning as for NVDA. political risks provoke thoughts of component shortages.
tp1 57
tp2 62

INTC / 1H / TECHNICAL ANALYSIS NASDAQ:INTC My target is 50.69 with a support level at 45.70 and a resistance level at 51.32. Please don't forget to follow and like. Thank you

INTC Intel Corporation Options Ahead of EarningsIf you haven`t bought the Double Bottom Pattern of INTC:
Then analyzing the options chain and the chart patterns of INTC Intel Corporation prior to the earnings report this week,
I would consider purchasing the 48usd strike price at the money Calls with
an expiration date of 2024-1-26,
for a premium of approximately $1.86.
If these options prove to be profitable prior to the earnings release, I would sell at least half of them.

Intel - Clear StructureHello Traders, welcome to today's analysis of Intel.
--------
Explanation of my video analysis:
In 2022 Intel broke a massive previous support level at the $45 area towards the downside. This break was followed by a drop of roughly -50%. With a perfect retest of a very long term structure level, this recent pump on Intel was quite anticipated. If Intel pulls back to the previous support level mentioned in the analysis, I am looking for potential long setups.
--------
I will only take a trade if all the rules of my strategy are satisfied.
Let me know in the comment section below if you have any questions.
Keep your long term vision.

$INTC Intel Bearish To bullish ReversalNASDAQ:INTC (Intel) is undergoing a bearish-to-bullish reversal, marked by an oversold Stochastic RSI. It is currently positioned above the 50-day moving average. Our dynamic support level will serve as a stop-out point in case of a weekly close below it.

INTC Holy Grail SetupINTC has pulled back nicely to the 20 EMA on the daily chart (looks even cleaner on the 65min). Candles are narrowing and looks like it wants to break out of this wedge. Active trade at $46.85. Target $51-$55
