GBPUSD at make or break level ahead of a split BOEThe BOE faces a pivotal moment as it prepares to announce its latest interest rate decision.
With MPC members split between hawkish concerns about stubborn inflation and dovish worries over a weakening job market, expectations are swirling about the path forward.
Will the BOE signal a pause after this cut, or will inflation surprises force a more cautious, hawkish stance going into the end of the year?
Traders are watching for clues in the updated forecasts, as even a minor shift could spark major volatility in GBP/USD.
If the BOE sounds hawkish—maybe they raise their inflation forecasts, or the vote split shows strong resistance to further cuts, or they signal a pause in easing—then GBPUSD might have found a bottom for now.
On the flip side, if the BOE puts more emphasis on economic risks, reduces its GDP outlook, or if the vote split shows a strong push for even bigger cuts, then the pound could come under pressure.
On the charts, Cable is clinging to 1.3375, with a potential developing head and shoulders pattern threatening a deeper move lower if the neckline breaks.
Will the upcoming BOE decision be the make-or-break catalyst for the pound?
This content is not directed to residents of the EU or UK. Any opinions, news, research, analyses, prices or other information contained on this website is provided as general market commentary and does not constitute investment advice. ThinkMarkets will not accept liability for any loss or damage including, without limitation, to any loss of profit which may arise directly or indirectly from use of or reliance on such information.
Interestrates

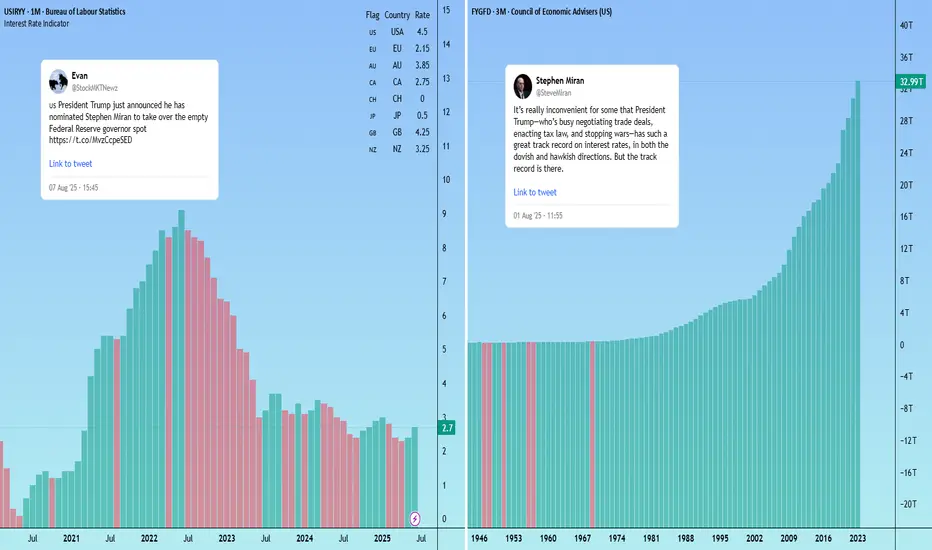
Trump’s Fed pick signals potential softer dollar US President Trump has named CEA Chair Stephen Miran as the temporary replacement for Fed Board member Adriana Kugler, serving until at least January 31, 2026.
As expected, Miran is closely aligned with Trump’s policy views, including support for tariffs and scepticism over the Federal Reserve’s independence.
Notably, Miran is a critic of the U.S. dollar’s current strength and is the author of the “Mar-A-Lago Accord” — a proposal to deliberately weaken the dollar to address the U.S. current account deficit.
The White House is also searching for a new Fed chair. If markets believe the next chair will prioritise Trump’s agenda over an independent monetary policy (a safe assumption at this stage) investors may demand higher yields on U.S. debt to hedge inflation risk. That could add volatility to US pairs.
$GBINTR -BoE Cuts Rates as Expected (August/2025)ECONOMICS:GBINTR
August/2025
source : Bank of England
- The Bank of England voted by a 5–4 majority to cut the key Bank Rate by 25bps to 4% in August, in line with expectations.
This marks the fifth rate cut since August of last year and brings borrowing costs to their lowest level since March 2023.
However, the decision followed an initial three-way split, the first time that two rounds of voting were required to reach a conclusive decision on interest rates.

FOMC rate decision 30-07-2025FOMC announced no change to interest rate, but the new tariffs is the major player for the upcoming quarter, we shall see its effect on the economy and corporates earnings soon, then the fed can make better judgment whether to lower interest rate or not.
Disclaimer: This content is NOT a financial advise, it is for educational purpose only.

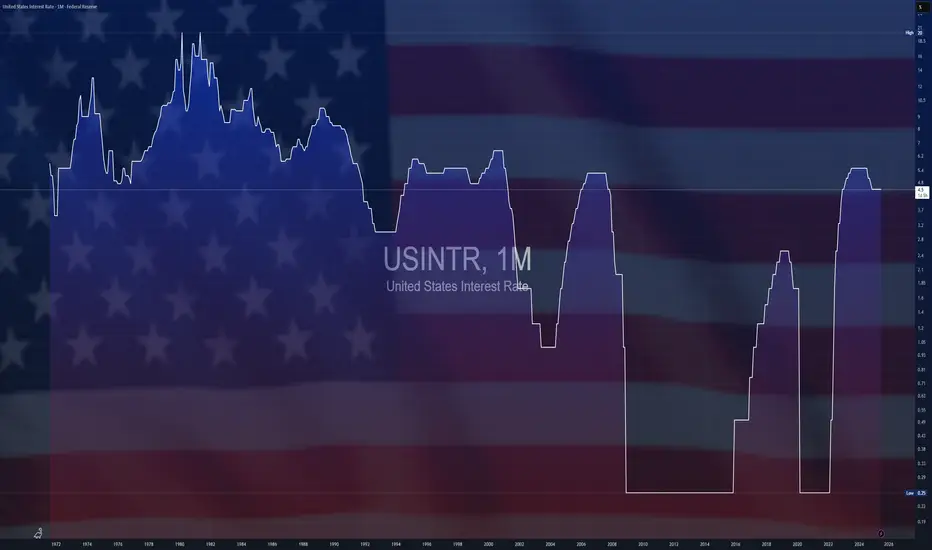
$USINTR -Feds Leaves Rates Steady (July/2025)ECONOMICS:USINTR
July/2025
source: Federal Reserve
- The Federal Reserve held rates steady at 4.25%–4.50% for a fifth straight meeting, defying President Trump’s demands for cuts even after positive GDP growth .
Still, two governors dissented in favor of a cut—the first such dual dissent since 1993.
Policymakers observed that, fluctuations in net exports continue to influence the data, and recent indicators point to a moderation in economic activity during the first half of the year.
The unemployment rate remains low, while Inflation somewhat elevated.
Data Release - Interest Rate DecisionJul 30 2025: Interest Rate Decision (4.5%)
Rates remain unchanged as expected.
OANDA:XAUUSD remains bearish with the help of GDP data.
TVC:DXY remains bullish with the help of GDP data. No major changes in either pairs.
Volatility is increased.
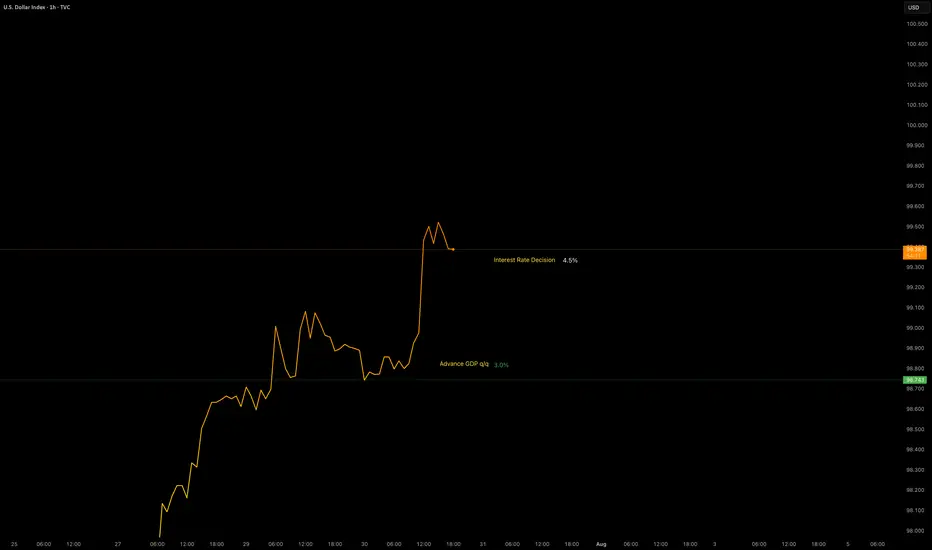
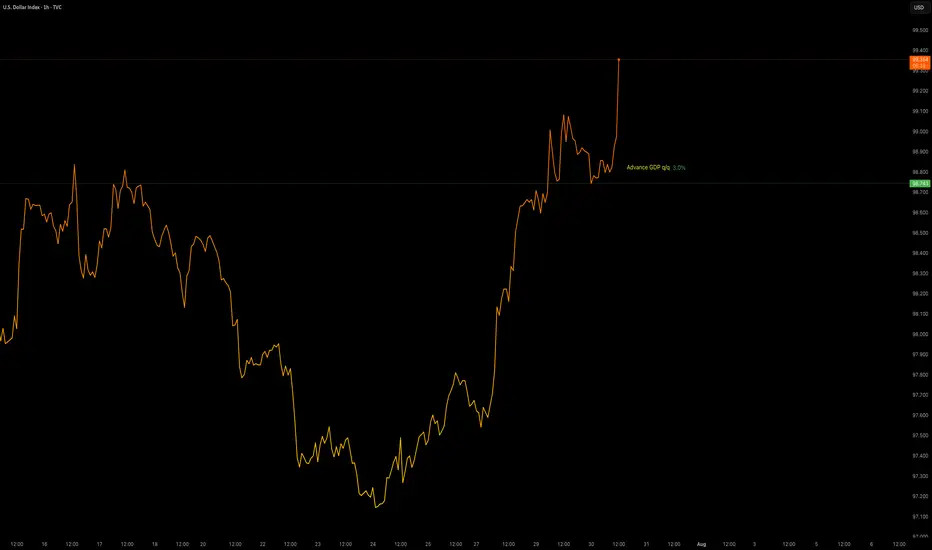
Data Release - Advance GDP q/q (3.0%)Jul 30 2025: ADVANCE GDP q/q (3.0%)
OANDA:XAUUSD sees some downside pressure with positive GDP data.
TVC:DXY gaining strength.
Volatility is increased. This data will be used with Interest Rate Decision later in the day to provide a XAUUSD insight.
$BTC Daily OutlookDaily Chart
Today’s close printed a small bearish doji; visually bearish but still another inside-day that keeps BTC boxed between the High-Volume Node / v-Level cluster at $116 860-$123 300.
Holding $116 860 remains critical; lose it on a daily close and price can easily slide to the weekly breakout shelf near $111 960. We are now 16 days inside this balance. Per Auction-Market-Theory rule #5, the longer price churns at the edge, the more resting liquidity is absorbed, eventually a decisive push will follow. If buyers defend $116 860 again, the path opens toward range high $123 300 and the prior ATH; if they fail, expect a fast flush to the weekly V-Level.
Footprint Read
Value Area High and Low span the full candle, with the POC parked mid-range, classic two-sided trade. Delta finished negative and the heaviest prints sit at session lows: sellers hit the bid hard, yet could not follow through. That absorption leaves shorts vulnerable to a squeeze if new selling momentum doesn’t appear quickly.
Fundamental Pulse – Week Ahead
ETF Flows: Spot-Bitcoin ETFs booked three consecutive inflow days to close last week (+$180 M net). Sustained demand under the range supports the bullish case.
Macro Data: U.S. FOMC & Federal Fund Rates prints for this week; expect more volatility starting from tomorrow.
Game Plan
Primary bias stays long while daily candles close above $116 860; upside trigger is a clean for now or shorts squeeze toward $123 300.
If $116 860 breaks with volume, prepare for a quick liquidity hunt into the weekly shelf at $111 960, where we reassess for swing longs.
Intraday: I’ll monitor the Intraday Chart on tomorrow's High impact events and look for best opportunities across the board. Alt window: a fresh downtick in BTC Dominance could spark rotation; watch high-Open Interest majors if BTC ranges.

EURUSD ahead of the FEDEURUSD remains below the 1,1600 level following the trade agreement between the US and the European Union.
Today, all eyes are on the FED’s decision regarding interest rates.
Watch for a reaction around the support zone, as it may present an opportunity for the trend to continue.
However, it's advisable to reduce risk and hold off on new entries until after the news is released.

Countdown to Powell’s rate decision: What to watch WednesdayFederal Reserve Chair Jerome Powell is under mounting pressure from President Donald Trump to begin cutting interest rates.
Markets and analysts overwhelmingly expect the Fed to hold rates steady this Wednesday.
But what if the political heat is becoming too much to bear, and Powell and the Fed board advocate for a cut this week? Some Fed governors, Chris Waller and Michelle Bowman , have already signaled support for an early cut.
FX pairs to watch
USD/JPY:
This pair remains highly sensitive to yield differentials and broader risk sentiment. However, any hawkish resistance or emphasis on data dependency may keep the pair supported, especially if risk appetite holds.
EUR/USD:
The euro has shown relative strength in recent sessions, but the pair has been hit by the announcement of the trade deal struck between the EU and US. If the Fed clearly signals it's not ready to ease, the USD could regain even ground.
AUD/CAD’s Big Move: Don’t Sleep on This Breakout Setup!Hey traders, Skeptic from Skeptic Lab here! 🔥 While everyone’s freaking out over interest rate news and Non-Farm Employments , AUD/CAD ’s stealing the show on the daily time frame.
📉Post-tariff crash, it’s rebounding strong. A daily resistance break could kick off a major uptrend. Use RSI overbought/oversold ( linked in my TradingView article ) to confirm momentum.
👀Beware of fakeouts this week—volatility’s high! Trade smart, keep risk tight, and don’t FOMO. Share your thoughts in the comments, boost if it helps <3 🩵

Important week for EURUSDOn Friday, EURUSD reached a support level and bounced off it.
This week, all eyes are on the Fed's interest rate decision on Wednesday and the U.S. jobs data on Friday.
The trend remains bullish for now, and the upcoming news will likely determine the next move.
Today and tomorrow, the market may stay in a range as traders wait for the key events.
Don't rush into new trades and avoid using large position sizes!

Markets face a PACKED schedule this weekThe tariff truce between the U.S. and several major trading partners is set to expire on August 1 . A deal with Japan has already been reached, but talks with the EU, Canada, and Mexico remain active.
In monetary policy, the Federal Reserve is widely expected to hold rates steady at 4.5% during its midweek meeting .
Across the border, the Bank of Canada is also expected to leave its interest rate unchanged at 2.75% . After cutting rates twice earlier this year, the BoC is seen as entering a wait-and-see phase.
In Asia, the Bank of Japan will announce its decision on Wednesday . While the BoJ isn’t expected to hike this month, recent U.S.–Japan trade progress has opened the door for policy tightening later this year.
Finally, the week concludes with the U.S. Non-Farm Payrolls report on Friday. Economists expect job gains of around 110,000 in July, down from 147,000 in June.
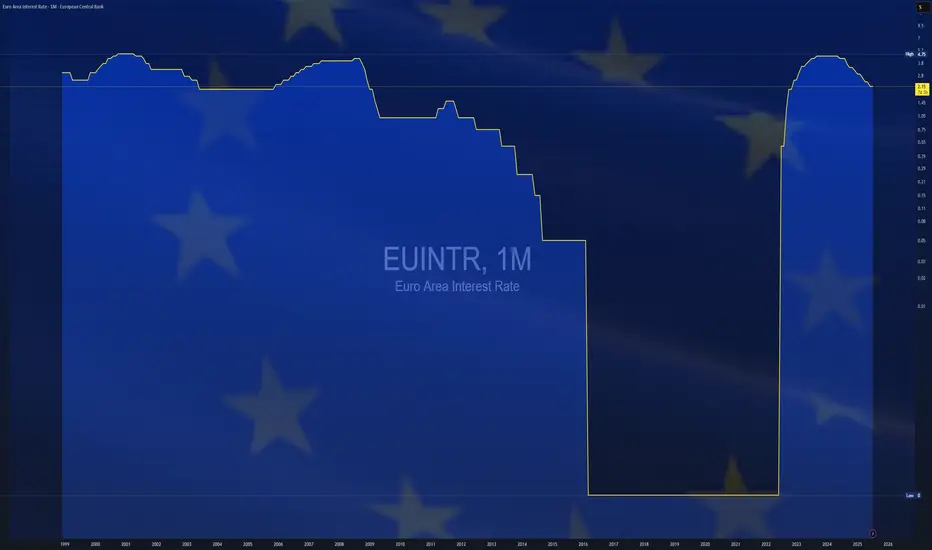
$EUINTR - Europe Interest Rates (July/2025)ECONOMICS:EUINTR
July/2025
source: European Central Bank
- The ECB kept interest rates unchanged in July, effectively marking the end of its current easing cycle after eight cuts over the past year that brought borrowing costs to their lowest levels since November 2022.
The main refinancing rate remains at 2.15%, while the deposit facility rate holds at 2.0%. Policymakers struck a wait-and-see stance, as they evaluate the impact of lingering trade uncertainty and the potential fallout from proposed US tariffs on economic growth and inflation.
Inflation hit the ECB’s 2% target in June, adding to the case for a pause in policy adjustments. Speaking at the ECB press conference, President Lagarde said the central bank is “in a good place” but acknowledged the difficulty in assessing how tariffs will affect price outlooks, given the mix of both inflationary and disinflationary pressures.
On the recent euro appreciation, Lagarde reiterated that the ECB does not target exchange rates directly but considers them when forecasting inflation.
Dollar Index Holds Below 98 as Markets Await Trade Deal ProgressThe dollar index remained below 98 today, extending its two-day decline as investors watched trade negotiations ahead of the August 1 deadline. Treasury Secretary Scott Bessent said deal quality is the priority, suggesting Trump could grant extensions to countries showing real progress.
Markets are also focused on Fed Chair Powell’s speech for signals on interest rates. Despite Trump’s push for a cut, traders are not expecting action this month.
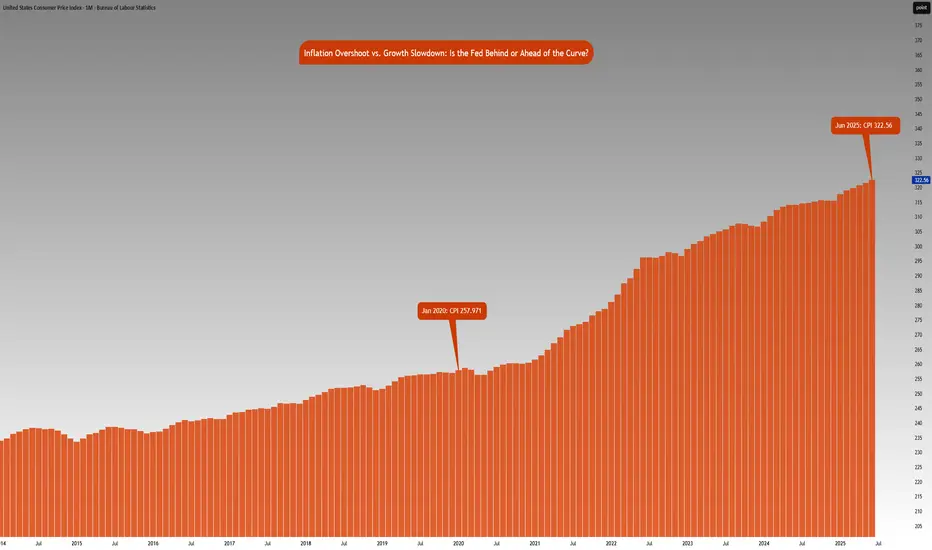
Inflation vs. Growth : Is the Fed Behind or Ahead of the Curve?CME_MINI:NQ1! CME_MINI:ES1! CME_MINI:MNQ1! CME_MINI:MES1! CBOT:ZN1!
Fed Policy recap:
There is an interesting and unusual theme to keep an eye on this week. The Fed is in a ‘blackout period’ until the FOMC meeting- this is a customary quiet period ahead of an FOMC policy meeting. Fed Chair Powell is scheduled to give a public talk on Tuesday. Although his address will be focused on the capital framework of the large banks, this appearance will be closely watched for any subtle signals on the FOMC policy stance.
Especially given that last week, Federal Reserve Governor Chris Waller made a speech, “The Case for Cutting Now” with a purpose as he stated to explain why the FOMC should reduce rate by 25 bps at the July 30th, 2025 meeting.
His stated reasons were:
1. Tariffs create one-off price level increases with transitory inflation effects, not sustained inflation momentum.
2. He argued that much of economic data points towards interest rates should be lowered to FOMC’s participants' median neutral rate, i.e, 3%.
3. His third stated reason notes that while the state of the labor market looks resilient on the surface, accounting for expected data revisions, private-sector payroll growth has peaked, with more data suggesting increased downside risks.
His speech further explains:
• Growth has decelerated sharply: Real GDP rose only ~1% annualized in 1H25, a significant slowdown from 2.8% in 2H24, and well below long-run potential.
• Consumer spending is weakening, with real PCE growth falling to ~1%, and June retail sales showing soft underlying momentum.
• Broader labor market indicators, including the Beige Book and JOLTS data, show declining labor demand and hiring caution, suggesting increasing downside risks to employment.
• Inflation is slightly above target (PCE ~2.5%) but driven primarily by temporary, one-off tariff effects. Core inflation ex-tariffs is likely near 2%, and expectations remain anchored.
• Current fed funds range (4.25%–4.50%) is well above neutral (3%), implying excessive restraint.
• With inflation risks subdued and macro conditions deteriorating, a preemptive rate cut now provides optionality and avoids falling behind the curve if the slowdown deepens. Further cuts may be warranted if trends persist.
• The tax bill contains pro-growth provisions, but its economic impact is expected to be minimal in 2025.
Source: Federal Reserve Speech, The Case for Cutting Now Governor Waller
Inflation Analysis:
Let’s compare this with what we have previously mentioned regarding inflation. CPI index stood at 257.971 points in January 2020. Projecting this at a 2% Fed target, June 2025 inflation should be around 287.655 points. However, June 2025 inflation is currently at 322.56 index points, 12.2% higher above 2% the inflation trend. Effectively, this means annualized inflation since January 2020 is roughly 4.15%.
The Fed is in a real dilemma whether cutting rates given the inflation trend in the last 5 years and risks to inflation outlook justify cutting rates.
Key Questions to ask
Markets are forward looking. Investors and participants want to know:
• How will the rates impact the cost of debt service? Currently the third largest government expenditure, over $1.03 trillion.
• Will the tariff rate offset the tax revenue losses by extending tax cuts?
• Is the fiscal path sustainable?
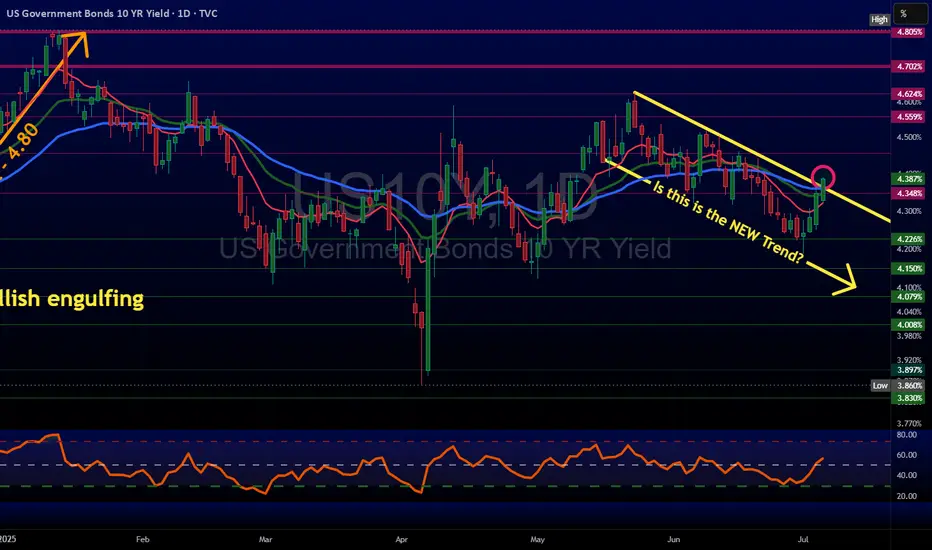
• What happens to the long end of the yield-curve?
• Will the Fed monetize the debt issuance imbalance?
• Is this simply Governor Waller positioning himself for the next appointment of Fed Chair when Fed Chair Powell’s term expires in May 2026?
It seems there is a huge conflict between longer term implications vs quick short term fixes that align with US administration objectives.
The Week ahead:
It is a relatively light economic calendar in the US. Flash PMI readings and housing data on the docket. The primary focus as it has been for most weeks since President Trump took office, will be on the developments in trade policy and any further comments on Fed and Chair Powell. The threat of renewed tariffs starting August 1st, is also key to monitor and whether these protectionist measures will force US’s trading partners to make further concessions to negotiate trade deals.
The earnings season is off to a good start with major US banks reporting higher EPS and revenue than expectations. This week investors will be looking at Q2 earnings reports from Alphabet, Meta, Microsoft from the Mag 7 and Tesla.
What Happens the Day Jerome Powell Is Fired or Quits?A sudden exit by Fed Chair Jerome Powell would create both a political and monetary shock.
While the Chair is technically protected from arbitrary removal. Recent reports confirm that President Trump and his allies are scrutinising the Fed’s $2.5 billion renovation project—potentially laying the groundwork for a “for cause” dismissal.
A surprise departure would undermine confidence in the Fed’s independence. The U.S. dollar could fall sharply across major pairs.
USD/JPY could fall toward ¥145, with safe-haven demand favouring the yen. However, the reaction may be less severe than in pairs like Swiss franc which we have noted in the past is the potentially preferred safe haven. A panic selloff could extend to 142.20—a prior consolidation floor.
GBP/USD could surge as traders anticipate a more dovish Fed stance under the new Trump-stooge Fed Chair. From a technical perspective, GBP/USD is maybe already oversold and potentially poised for a potential rebound anyway—Powell’s resignation or firing could potentially exacerbate this. The first level to watch being a return to 1.3700, assuming the likely expectation of Fed rate cuts rise.

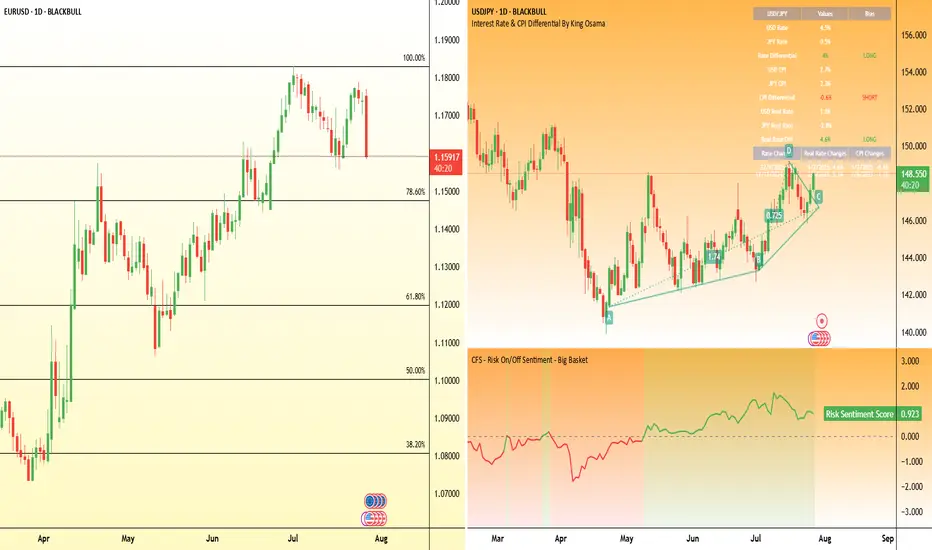
USD/JPY: A High-Clarity Setup in a Coiling MarketFor weeks, the market has been choppy and difficult, grinding accounts down with indecisive price action. Many traders are getting stomped by the noise. This post is designed to cut through that chaos with a single, high-clarity trade idea based on a powerful fundamental story and a clean technical picture.
The focus is on the USD/JPY, where a major catalyst (US CPI) is about to meet a tightly coiling chart pattern.
The Fundamental Why 📰
Our entire thesis is now supported by both qualitative and quantitative analysis. The core driver is the profound monetary policy divergence between the U.S. and Japan, which manifests as a powerful Interest Rate Differential.
The Core Driver: The Bank of Japan maintains its ultra-easy policy while the Fed is in a "hawkish hold," creating a significant interest rate gap of over 400 basis points that fuels the carry trade.
Quantitative Validation: Our new analysis confirms this is the primary driver. We found a strong positive correlation of 0.54 between the USD/JPY exchange rate and this Interest Rate Differential. This provides a robust, data-backed reason for our long bias.
This creates a fundamental chasm between the two currencies, representing a compelling long-term tailwind for USD/JPY.
The Technical Picture 📊
The 4-hour chart perfectly visualizes the market's current state.
The Coiled Spring: Price is consolidating in a tight symmetrical triangle. This represents a balance between buyers and sellers and a build-up of energy. A breakout is imminent.
The Demand Zone: Our entry is not random. We are targeting a dip into the key demand zone between 144.50 - 144.80. This area is significant because it aligns with the 50-day moving average, a level that offers a more favorable risk/reward ratio.
The Underlying Conflict: It's important to note the long-term bearish "Death Cross" on the daily chart (50 MA below 200 MA). Our thesis is that the immense fundamental pressure—now validated by our quantitative study—will be strong enough to overwhelm this lagging technical signal.
The Plan & Setup 🎯
This is a conditional setup, and our analysis confirms the proposed levels are well-reasoned. We are waiting for the market to confirm our thesis before entering.
The Setup: 📉 Long (Buy) USD/JPY. We are looking for price to dip into our demand zone and then break out of the triangle to the upside.
Entry Zone: 👉 144.50 - 144.80. Watch for a 4H candle to show support in this area.
Stop Loss: ⛔️ 144.00. A break below this level would signal that the immediate bullish structure has failed and invalidates the trade thesis.
Take Profit: 🎯 149.50. This target is strategically set just below the major 150.00 psychological handle, a level where institutional orders are likely clustered.
This setup provides a clear, logical plan to engage with the market's next big move. It's all signal, no noise. Trade smart, and manage your risk.

10Yr Yield looking to break downtrendOh, oh. What do we have here?
The 10Yr Yield is making a push and is currently breaking the downtrend. TVC:TNX
The 2Yr Yield has been making higher lows.
Not looking good for lower rates at the moment.
Direxion Regional Banks Bull 3X Shares | DPST | Long at $84.89In anticipation of interest rates going lower, a large number of regional bank insiders are buying a significant number of shares of their own stock. Such lowering will likely increase regional bank revenue and move ETFs like AMEX:DPST higher.
Thus, at $84.89, AMEX:DPST is in a personal buy zone.
Targets:
$106.00
$120.00

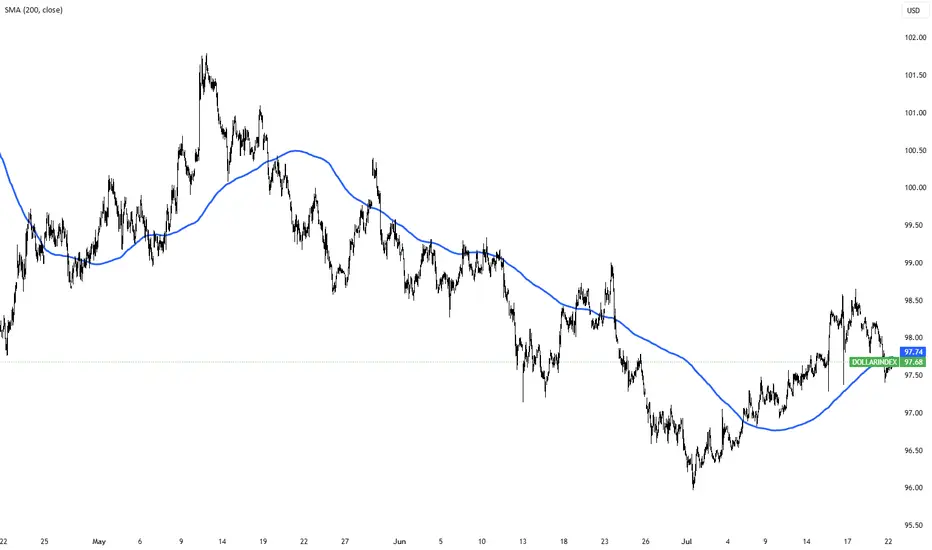
DXY Quite IndecisivePrice on TVC:DXY after having broken below the Swing Low on June 12th @ 97.602 has created a lot of Indecision!
Starting with a 5 Day Long Consolidation period as a Rectangle Pattern
Then after the Bearish Breakout on June 30th due to the Federal Reserve mentioning possibly leaning towards Interest Rate Cuts, we see the TVC:DXY form a Expanding Range
Now at the Swing Low and above all the Consolidation or Indecision, we see a Volume Imbalance in the 97.5 - 97.6 area.
Fundamentally, USD has been mostly beating expectations with:
- Manufacturing and Services PMI's showing Expansion
- Job Openings higher then expected
- Unemployment Claims Low
- Unemployment Rate dropping ( 4.1% )
- Factory Orders Rising
Non-Farm Employment however hurt USD with -33K instead of the 99K forecasted
With all the Tariff uncertainties and how they will affect Inflation continues to worry markets with only a few deals having been ironed out, like the 20% Tariff on Vietnam ( down from 46% ) before the July 9th Deadline.
www.tradingview.com
Now with good Employment News out with numbers showing Strong Job Reports, this eases labor fears and could help remove some of the expectations of the amount of Interest Rate cuts this year.
www.tradingview.com
www.tradingview.com

S&P 500 Outlook. Best Quarter Since 2023… But What Next?The S&P 500 just logged its best quarterly performance since Q4 2023 , surging on optimism around global trade negotiations and growing expectations that the Fed may begin cutting rates as early as September. US futures are green this morning, thanks to developments like Canada backing off digital taxes, ongoing dialogues with China ahead of the July 9 deadline, and risk-on sentiment is pushing yields and the dollar lower.
But as traders, we need to ask:
Are we witnessing a genuine economic inflection point? Or is this just a liquidity-driven rally that’s pricing in a best-case scenario?
Technical View
Support Zone: 6,150 was just broken through. And 6000, the round number level, coinciding with the 20-day EMA and previous swing level.
Resistance Levels: 6,235 is the next critical ceiling, a clean breakout could see price reach the extension level of 6,415.
Momentum Indicators: RSI remains elevated and is creeping toward the overbought. While momentum is strong, watch out for the possible development of a divergence.
Possible Scenarios
The 'Soft Landing’ Is Now the Base Case
Markets are trading as if the Fed has successfully engineered a soft landing. But that’s now fully priced in, and historically, the most dangerous trades are the ones everyone agrees on. If trade talks stall, inflation re-accelerates, or earnings disappoint, the reversal could be brutal and fast.
Risk-on Sentiment Without Volume Is a Yellow Flag
Despite the price strength, volume has been tapering off. The S&P’s recent leg up occurred on lighter-than-average participation, suggesting institutions may be watching, not chasing. That’s often the case in low-volatility summers, but it also implies that any negative catalyst could cause outsized downside moves.
Macro-Fundamentals May Not Justify Valuation Expansion
Yes, inflation is slowing, and the Fed might cut. But if they do, it’s likely because growth is weakening, not because the economy is roaring. So the very condition that triggers rate cuts could also cap earnings growth!
Projection
Bullish Scenario: A confirmed breakout above 6,280 could carry us toward 6,400–6,500 by mid-Q3, especially if the trade deals progress, July inflation comes in soft, and the Fed signals accommodation.
Bearish Risk: If price fails to hold above 6,120, especially if trade optimism fades, or inflation growth spikes or Fed rhetoric shifts hawkish again, this could then open a quick pullback toward 6,000 or lower, which also aligns with the 50-day SMA.
Key Events to Watch
July 9 Trade Talks Deadline: Any sign of stalling could bring volatility back fast.
June CPI Print (July 10): Crucial for confirming the Fed's next move.
Earnings Season Kickoff (mid-July): Tech-heavy expectations may not be easy to beat after such a strong run.
Conclusion
A record-setting quarter is impressive but not necessarily predictive. This quarter’s rally has been built more on relief and expectations than hard data. When expectations (not earnings) are doing the heavy lifting, any misstep from central banks or geopolitics could unravel gains rapidly.
A rate cut might be delayed, or inflation re-accelerates, or trade talks stall; any of these could leave equities hanging. Remember: the higher the climb without real earnings growth, the harder the fall when sentiment shifts. It's not just about the chart. It is about the narrative behind the price.
What’s your bias for Q3?
Are you buying this breakout or fading the optimism? Drop your thoughts below.

Fed speak - Not broken, not cutting “Don’t fix what isn’t broken” seems to be the Fed’s current stance. Two Fed officials made that clear over the last 24 hours.
Vice Chair for Supervision Michael Barr warned that tariffs could fuel inflation by lifting short-term expectations, triggering second-round effects, and making inflation more persistent.
New York Fed President John Williams echoed that view, noting that tariff-driven inflation is “likely to get stronger in the months ahead.” He also called policy “well positioned” and said the Fed needs more data before making any move.
EUR/USD has formed a rising wedge pattern on the daily chart—typically a bearish structure that warns of a potential reversal. Price action has narrowed, building two clear tops. The downside target from the wedge could potentially be 1.1066 initially, and possibly down to 1.0732 if bearish momentum accelerates.
