GOLD| DECRYPTERS | XAUUSD | SHORTWelcome to Team Decrypters
We think GOLD can go more down side base on BPS AND DXY
High Chances of it Because of 15th march interest Rate 50 BPS , A bounce from support little bit and than Drop to ASHES
Interestrates

However you slice it, real estate doesn’t look good.While it might not be the subprime/GFC “SELL” kind of situation, the real estate sector is undoubtedly facing headwinds.
With the most recent Fed’s preferred inflation measure, the Personal Consumption Expenditure (PCE) printing higher than consensus, maybe it’s about time we take the Fed’s hawkish commentary more seriously. To review, let us look at interest rate expectations from a month ago vs today. Market expectations are now pricing in three 25bps hikes instead of one, and more importantly no more rate cuts in the second half of 2023. This rise in rates expectation has notably resulted in sideways action for equities, while the dollar strengthens. What a difference a month makes!
Mostly importantly, it’s not hard to see how higher rates will translate into higher mortgage rates. This is bad news for home buyers as borrowing becomes more and more unaffordable. In fact, higher mortgage rates have continued to weigh on the minds of Fed officials as underscored by the following statements in the latest Fed minutes, including “Participants agreed that activity in the housing market had continued to weaken, largely reflecting the increase in mortgage rates over the past year.” and “Participants agreed that cumulative policy firming to date had reduced demand in the most interest-rate-sensitive sectors of the economy, particularly housing.”
Existing home sales are now at a 12-year low, surpassing the 2020 lows. Only 2 other periods post-GFC, saw a lower print, and it’s worth noting that mortgage rates during those periods were at the same level or lower.
Home prices have also started to turn over, ending a 12-year run higher. Lower prices could indicate tepid demand in the housing market, which we will watch closely over the next few prints.
And forward-looking indicators all seem to point towards contraction. With US Building permits and NAHB Housing Market Index slightly off the covid low, while the MBA Purchase Index close to the 7-year low.
It does seem like however, we slice it, real estate looks pretty ugly now. One way to express the bearish view on real estate could be to use the CME E-Mini Real Estate Select Sector Futures which tracks the S&P Real Estate Select Sector Index. Looking at the sector futures alongside the 30-year Mortgage rates shows us the effect of the rising rates on the real estate sector.
On the technical front, we see the sector future breaking the short-term support established since October 2022, while the longer-term trend seems to point downwards.
Given our view that rates have further to go, negative home prices and sentiment measures across the board, and a technical break lower, we see the potential for the sector future to trade lower. We set our stops at 196, a previous resistance level, and the take-profit level at 163, with each 0.05 increment in the index equal to 12.5 USD.
The charts above were generated using CME’s Real-Time data available on TradingView. Inspirante Trading Solutions is subscribed to both TradingView Premium and CME Real-time Market Data which allows us to identify trading set-ups in real-time and express our market opinions. If you have futures in your trading portfolio, you can check out on CME Group data plans available that suit your trading needs www.tradingview.com
Disclaimer:
The contents in this Idea are intended for information purpose only and do not constitute investment recommendation or advice. Nor are they used to promote any specific products or services. They serve as an integral part of a case study to demonstrate fundamental concepts in risk management under given market scenarios. A full version of the disclaimer is available in our profile description.
Reference:
www.cmegroup.com
www.federalreserve.gov

DXY Outlook 27th Feb 2023On Friday, the US Core PCE price index was released at 0.6% (Forecast: 0.4%). As the Core PCE price index is a key inflation indicator for the Federal Reserve, a stronger-than-expected change signals that we could see further interest rate increases from the FOMC.
This is also why following the news release, the DXY climbed steadily from the 104.65 price level up toward the 105.30 price area.
Currently consolidating above the 105 price level, look for the price to retrace briefly (possibly toward the 104.80 level (supported by the horizontal level and the upward trendline) before resuming to trade higher again, toward the next key resistance level of 105.80.

SPY Prediction for 2023Inflation is looking stickier than the FED hoped, further hiking is likely required. At this point I'm comparing to the last two financial downturns.
I'm not expecting a market bottom until rates have been cut greatly. Maybe between September 2023 and March 2024. In previous downturns bottoms did not occur until fed funds rate had already been cut greatly. Targeting a monthly RSI of 30 to begin buying in large.

Rates Obsession - a pro interest rates set-up on TradingView Interest rate pricing has a huge effect across many financial markets at present – the correlation between short-term rates, rates volatility and the USD is certainly evident.
However, with such a big window for increased volatility in interest rates pricing, as traders try and price the prospect of a 25bp or 50bp hike at the 22 March FOMC, as well as peak fed funds pricing, could increased pricing result in a big move in the USD and NAS100?
In the video, we look at how we can look at the fed funds curve and understand ‘what is priced in’ – we look at how to measure the degree of cuts priced in for a specific period of time, and how to look at implied volatility in bond markets – and, why it is important for FX and index traders?
Interest rates and short-term US Treasury bonds are the first derivative and so many markets take their direction from these inputs - hopefully, this gives some understanding of how you can use TradingView more effectively to assess these inputs.

EURUSD bagged and taggedAs mentioned before, so long as DXY has not reach the finishing line, which is the higher time frame upside objective,
Risk Off will still be in play.
Same narrative, different pair.
What happens when DXY finally gets to the upside objective? We sit sideline and study what it wants to do next.
There are only 3 possible direction of the market, Bullish / Bearish / Consolidation.
Usually, in my opinion, after a prolonged rally / decline, price will tend to consolidate for a bit.
After consolidation comes expansion. The question is, expansion to the upside or downside?
Now, this short-term bullishness of USD as I previously stated, could be Bear Market Rally for USD.
Mr Powell will likely hike rates again in the next Federal Fund Rate announcement.
In theory, higher interest rate means bullish for currency.
But look at US domestic debt condition. Will that spook investors?
Housing and Banking looks about to get crushed.
US Credit Card debt climbs nearly US$1 Trillion
*source: Insider Intelligent*
Household debt hits record US$16.9 Trillion
*source: CNN Business*
Housing Market Downturn Wipes $2.3 Trillion In Value As Experts Predict Prices Could Still Tumble Another 10%
*source: Forbes*
US Home-Purchase Applications Drop to 28-Year Low
*source: Bloomberg*

AW 10Y Bond Yields - The Large Pullback Ahead Means Recession...In this video I talk about the bigger picture going back to 1150AD and how I have always anticipated this move up in rates.
See down below all videos that are related to this idea.
We are in a correction phase of Wave 2 in Bond Yields.
This type of expansion means that they are preparing themselves for a recession even though they don't mention it.
They know.
The FED must always keep the public distracted with the inflation narrative.
The truth is that they have to keep the party going therefore they will use manipulated data to justify their actions.
This is all done through compartmentalization which is used by governments and the military industrial complex.
This is also done to the public to make sure you are happy even though you are losing everything.
Sound familiar? The truth is they have been slowly preparing you for the future.
Don't think that it's coming because it's been here the whole time.
#BoilingFrog.
Remember to use Disciplined Money Management Principles to ensure longevity as a trader.
If you don't know the long term pattern shouldn't you be doing your research instead of just following the crowd?
Just remember: I am not a financial adviser; I suggest using this only as a guide. Always do your own research.
***AriasWave is not the same as Elliott Wave so your counts may differ to mine if you happen to use it.***

Prudential (PRU.l) bearish scenario:The technical figure Channel Up can be found in the daily chart in the UK company Prudential plc (PRU.l). Prudential plc is a British multinational insurance company. It was founded in London in May 1848 to provide loans to professional and working people. The Channel UP broke through the support line on 22/02/2023. If the price holds below this level, you can have a possible bearish price movement with a forecast for the next 25 days towards 1 173.20 GBX. According to experts, your stop-loss order should be placed at 1 336.00 GBX if you decide to enter this position.
Prudential's stock increased significantly by 41% over the past three months. But the company's key financial indicators appear to be differing across the board and that makes us question whether or not the company's current share price momentum can be maintained.
While the company does have a high rate of reinvestment, the low ROE means that all that reinvestment is not reaping any benefit to its investors, and moreover, its having a negative impact on the earnings growth.
Prudential's earnings have declined over five years, contributing to shareholders 21% loss.
Risk Disclosure: Trading Foreign Exchange (Forex) and Contracts of Difference (CFD's) carries a high level of risk. By registering and signing up, any client affirms their understanding of their own personal accountability for all transactions performed within their account and recognizes the risks associated with trading on such markets and on such sites. Furthermore, one understands that the company carries zero influence over transactions, markets, and trading signals, therefore, cannot be held liable nor guarantee any profits or losses.

Upside pressure for UK yields remains apparentRemember upside pressure for UK 10Y yield implies downside pressure still for UK gilts......
Disclaimer:
The information posted on Trading View is for informative purposes and is not intended to constitute advice in any form, including but not limited to investment, accounting, tax, legal or regulatory advice. The information therefore has no regard to the specific investment objectives, financial situation or particular needs of any specific recipient. Opinions expressed are our current opinions as of the date appearing on Trading View only. All illustrations, forecasts or hypothetical data are for illustrative purposes only. The Society of Technical Analysts Ltd does not make representation that the information provided is appropriate for use in all jurisdictions or by all Investors or other potential Investors. Parties are therefore responsible for compliance with applicable local laws and regulations. The Society of Technical Analysts will not be held liable for any loss or damage resulting directly or indirectly from the use of any information on this site.

german bund interest rates descending triangle descending triangle broke; 134,50 support likely will be broken soon, just sell call options on 137 and get premiums easy peasy, friday 24 Feb winds up the standard contract so do like #blackrock

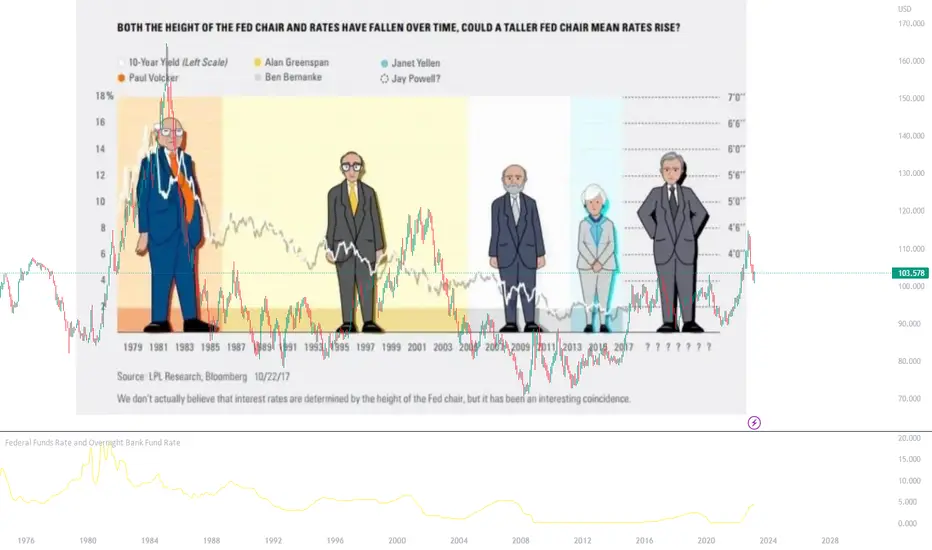
On the lighter side of thingsThe questions in recent times...
- Is the federal reserve going to slow down on future rate increases?
- Could we see a cut in rates in 2023?
- With terminal rates still undecided, could it be revised higher?
Perhaps the height of the Central Banker of the US Federal Reserve could be a leading indicator of interest rate decisions! (I'm not being serious, but it was interesting to see the correlations)
I started trading FX when Chair Bernanke (5ft 8in) was in the prime position and oversaw a steady decline in interest rates (ignoring the fact that the Global Financial Crisis caused significant turmoil in the markets)
The current Chair, Jerome Powell stands at 5ft 10in, an increase from Chair Yellen at 5ft 3in. A change in the Central Banker height trend has led to US interest rates climbing higher from 0% to the current of 4.75%!!
Chair Greenspan (5ft 8in), was THE first central banker I've read about and probably what got me interested in the financial markets, ushered in a strong US economy in the 90s. Greenspan oversaw rate hikes as he too battled with "high" inflation in 1997.
So, perhaps instead of overthinking about employment, CPI, GDP, QE, and YCC, all we have to do is pay attention to the change in the height of the Federal Reserve Chairperson.
What do you think?
10Y Yield Looks Bullish - Higher RatesI don't know how high this thing goes, but right now it looks like it is heading higher.

AUDUSD Retest, Possible Bearish trend.AUDUSD a possible down trend due to possible Federal Reserve increase interest rates.

Reduce inflation rate from 6.5% to 3% this years, says WilliamsFOMC's Williams speech did not do much, as he was echoing what Jerome Powell already said 2 days ago. Rate hikes to resume, but at slower pace. Williams mentioned that inflation rate in the US should cool off to 3% this year, now at 6.5%. That's 50% lower.
Question is, how much more rate hike is required to push inflation down by 50%? Will that be somehow somewhat slowdown the US economy as a whole? A whole lot more tightening will need to take place, as I see it. Lending has already begun to tighten and credit is more difficult to obtain due to stricter requirements by banks.
Hmm... how will this play out?
By Sifu Steve @ XeroAcademy
#usdollar #usd #dxy #interestrates #useconomy #federalreserve #FOMC #inflation

Negative Real RateReal rate is different from interest rate. Real rate is the difference between interest rate with the inflation. We have been running on negative real rate for a decade plus. This is an accommodative measure by the Fed to make sure the market is still running hot. S&P500 has been running well during this period of time where the interest rate is kept below the inflation. However there are several occasion where the negative real rate is running deep in 1970s and 2020s, which prompt the Fed to raise the rate. However so far we have not seen real rate hikes goes into positive territory yet. When the real rate is in positive territory S&P500 index will also running well as the economy is running well without Fed's life line support. However I'd expect that the market will be flat and volatile during transition between negative to positive real rate, because the market trying to figure out whether the economy would be running well or not when the life support is removed slowly.

GOLD BULLISH SCENARIOGOLD is described as a safe haven against war, inflation, and banking collapse as we can see on the daily chart. The 2 fat red candles are basically 3 interest rate decisions in two consecutive days which were all hikes. Uptrend support shows signs of resuming the previously steady uptrend. The dovish comments from Powel can be interpreted as neutral, in our case here is support for that trend.
Risk Disclosure: Trading Foreign Exchange (Forex) and Contracts of Difference (CFD's) carries a high level of risk. By registering and signing up, any client affirms their understanding of their own personal accountability for all transactions performed within their account and recognizes the risks associated with trading on such markets and on such sites. Furthermore, one understands that the company carries zero influence over transactions, markets, and trading signals, therefore, cannot be held liable nor guarantee any profits or losses.

DXY GAME ON!! SPIKE COMING FOR THE DOLLAR?Last week's surprising jobs report sticky inflation, and persistent and frothy financial conditions may force the Federal Reserve members into a more hawkish position, forcing them to keep the heat on interest rates and the money supply.
Many market participants were looking for a pause in rate hikes as soon as next month and possibly a pivot to lowering rates shortly after. This new data is going against what the Fed was trying to accomplish in this rate hike cycle, which is
to keep inflation within mandated guidelines, and to tame loose financial conditions, dashing the hopes for a pivot in policy anytime soon and pushing that pivot out for far longer than some were expecting. This will put upward pressure on bond yields and a dollar so heavily shorted causing the pivot crowd to close out some of their short positions as the Fed puts the screws to the money supply and inflation. This classic cup and handle setup illustrates the effect the Fed Policy may have on the dollar.

FFR Inversion with 2 Year USTMany believe the Fed kept the Federal Funds Rate (FFR, in orange) too low for too long. But the recent path of hiking has caused the FFR to now get above the 2 year UST yield (in blue) -- a situation that rarely happens, and rarely is a "good" sign for markets. Stay alert.

The Pure Short Interest Rate Play: /GEThe long interest rate play may have been one of the most productive plays of, oh, the last five years or so (maybe more) with shorts in (pick your poison) SHY (1-3 year maturity paper), IEF (7-10), TLT (20+), EMB (emerging market), HYG (junk) being the rage, particularly with the Fed giving the market a fairly good idea of the when. Unfortunately, the point at which the Fed starts considering easing is -- at least at this point -- more fuzzy both in terms of timing and the terminal rate at which we end similarly covered in fur.
That being said, it's good to be prepared and to look at the who's, what's, when's, and where's of where you might take the purest form of a bet that rates ease from that point forward and that (at least in my little noggin) is with /GE.
Pictured here is /GE, where you can see how fabulous the short was from basically ZIRP to where we are today, with the box wrapped around a potential terminal rate of between 5.25% and 5.75%. My basic notion here is to long /GE in some fashion in this area or ultimately where the terminal rate ends up, particularly when the Fed gives us some sense of the "when" of a potential cut. Chairman Powell has indicated a lack of likelihood for a 2023 cut with the CME Fed Watch Tool reflecting that to some minor extent,* but -- as we've seen repeatedly -- the landscape (inflation, unemployment, yada yada) can change, so the terminal rate may end up slightly (or not so slightly) different from current expectations of 500-550 bps and the timing of any eventual cuts slightly (or not so slightly) different from the markets thoughts on the matter.
* -- Currently, the Tool indicates that the market is leaning (but somewhat equivocally) toward a small potential cut in June, but is looking more toward the end of the year toward potential cuts at the moment (i.e., at the November and December meetings) which are similarly equivocal.

GBPJPY Key Support Zone GBPJPY Has retested off the key support zone again to create the end of a triple bottom that we previously saw break out bearish but with last weeks positive news for GBP and the downward trend of the JPY add confluence to the pivot point and we could see prices rise, that being said amidst the gloomy outlook on the undecided interest rates in the UK it would be wise to see how we react after market open going into next week and if we continue bearish to retest the support or break through.

US inflation - US treasury Rate compared with the seventiesHi All
This fraction of seventies is already for 1 year identical.
US inflation rate minus US treasury rate

EURUSD before ECBAfter FED, today is ECB’s turn to announce the interest rate decision.
This will certainly cause fluctuations during the news and press conference.
The level of 1,1000 has been crossed and we’re heading towards 1,1077 and 1,1248.
It is important not to cross 1,0887.

XAUUSD Potential Bearish Trade.The chart for XAUUSD could be a bearish trade given that the Federal Reserve increase interest rates to 25bp, this Federal decision could affect the XAUUSD trade favor to USD side, but according in the Federal report by Jerome Powell, Chairman of Federal Reserve, "that is for Congress to raise the debt ceiling so that the United States government can pay all of its obligations when due," Powell said. "Any deviations from that path would be highly risky. And no one should assume that the Fed can protect the economy from the consequences of failing to act in a timely manner." Powell said.
Trader should assets the trading situation before placing a trade.
If trend is bearish, the potential price point could be the three Fibonacci Retracement.
A possible bearish trend at three Fibonacci Retracement level.
1.(1827.11 at 0.382 Fibonacci Retracement level)
2. (1786.92 at 0.5 Fibonacci Retracement level)
3. (1746.74 at 0.618 Fibonacci Retracement level)
Forex Disclaimer.
This Published idea is intended to be used and must be used for information purposes only and not for investment advice. It is important to do your own analysis in forex trading before making any investment based on your own personal circumstances. Regardless of anything to the contrary, nothing available on or through this information should be understood as a recommendation that you should not consult with financial professional to your particular information.
Forex trading may sustain a total loss greater than the amount you deposited to your account if the forex trading move against to the trader. The said forex is the responsible for all the risk and financial resources and trading system that has been used by the trader.
