Softlandish? Gold,DXY,BALANCE SHEET,INFLATION,INTEREST RATES Yeah at this stage we're very very very 2013-2015 like here .
One thing that could be massive is total inflation is for the first time negtive - month still has to close.
Beter someting than nothing.
Keep in mind we've started the bottoming process per the 2013 cycle - which gives us 200ish days until arround March to complete this. - Softlandish?
Interestrates

What Jackson Hole Means for the Stocks and the EconomyStocks swiftly sold off as the markets digested comments from the Jackson Hole retreat. This is a gathering of central bankers from around the world, and while no 'official' policy decisions are made, the markets pay great attention to comments made by key members. In particular, Jerome Powell came off sufficiently more Hawkish than anticipated , and the markets reacted as such. The dollar soared past highs along with bond yields and stocks tanked. Powell even said that Americans should expect 'pain' which was a particular somber note and drove the selloff further. At this point a 75bps or even a 100bps rate hike are not off the table for September. Also, particular mention was given to how rate hikes may impact the labor market, with some sources suggesting it could cost up to 4 million jobs . The S&P 500 tumbled to the base of the 4K handle at our very last level at 4009, a level we have been identifying for weeks. If this level breaks, we will return to the 3K's again, with 3978 and 3963 the next levels of support.

EURUSD & GBPUSD: Rate hikes are urgently neededThe publication of the August PMIs for the United Kingdom and the Eurozone affirms an ongoing economic slowdown in Europe. The UK Manufacturing PMI fell to 46 from 52.1 in July, indicating the first contraction in factory activity since May 2020 and well below expectations of 51.1.
In Germany, we saw a particularly weak Services PMI at 48.2 down from 49.7 and below expectations of 49.
Worsening economic and trade fundamentals, deep-negative real interest rates, looming recessions, and additional inflationary risks are all contributing to the steady decline of the euro ( EUR/USD ) and the pound ( GBP/USD ).
The European gas crisis has further accelerated currency movements in recent weeks, with Dutch TTF prices and UK gas prices ( NBP ) trading 8 and 6 times higher than US natural gas prices, respectively.
This creates a substantial competitive disadvantage for European and British companies and exerts downward pressure on the euro-dollar and pound-dollar exchange rates.
Trade flows won't reverse soon because Europe desperately needs to import more LNG from abroad to make up for Russian shortfalls. Instead, significantly speculative financial flows could be curbed through higher interest rates.
Real interest rates in the Eurozone ( EUINTR - EUIRYY ) and the United Kingdom ( GBINTR - GBIRYY ) are currently at record lows of -8.4% and 8.85%, respectively.
For a currency hoping to stave off a precipitous devaluation, this is not an encouraging calling card.
With inflation in the UK and the Eurozone predicted to run well double digits in the coming months, the only way to stop the continued depreciation of the euro and the pound is for central banks to announce aggressive interest rate hikes (or even an emergency hike ahead of scheduled meetings in September) regardless of the adverse economic effects.
The ECB and the BoE have a long way to go in their hiking journey. The risk of not doing so now would have far-reaching long-term consequences.
Idea written by Piero Cingari, forex and commodity analyst at Capital.com

Gold Tumbles Through Major Support LevelsGold has plummeted, smashing through significant levels of support. We have broken through the 50% Fibonacci level at 1750, and are testing lower levels in the 1700's. Currently, we are in the 1740's and should see support from 1742 or 1747. The Kovach OBV has steadily declined, confirming the bear trend. If things continue in this manner then we should have support from 1729, teh .236 Fibonacci level. If we can muster the strength for a relief rally, the 50% Fibonacci level at 1780 is our next target.

SPX Bull trap?It is time to pause, I will look into and analyze history'because as they say "history does not repeat itself but it rhymes" I would like to present the comparison of the SPX with the fall suffered in 2007.
If we take as a reference the fall of the Great Recession of 2007, it was a fall of 57% during 518 days that means 17 continuous months of fall, the situation was terrible.
Extrapolating it to 2022, taking into account that the fall lasted that long and the fall was -57%, it replicates so far the trend and movements of 2007.
Are we facing a BULL TRAP or should we rather BUY THE DIP?
Today 20/08/2022 Best regards, good investment.

Gold Slides SteadilyGold is on a steady bear trend, after rejecting the 1800's. We have smashed through multiple support levels in the upper 1700's, in particular from 1780, the 50% Fibonacci level. Currently, we are hovering in the 1760's, just a few ticks above 1758, the 0.382 Fibonacci level. This will provide support if gold slips further. The Kovach OBV is on a steady decline, but we are due for a relief rally, even if it is just a technical move. If so, 1780 is a reasonable target.

How to manage Capital in an Economic DownturnThe Great Recession is not the first time that the economy has experienced downturn or recession. The last one occurred during the early 1980s, and it caused unemployment to spike and home prices to drop. However, that doesn’t mean that a similar situation cannot happen again. The effects of a recession have lasting implications for consumers and businesses. When consumers have less money to spend on goods and services, businesses must make adjustments in order to remain profitable. In fact, recessions can lead to innovation in industries like technology where creative minds come up with cheaper solutions for everyday problems. Here’s a look at how consumers are affected by recessions, what they’re doing about it, as well as how you can manage your money in these challenging times.
What Happens When the Economy Recovers?
When the economy recovers from a recession, there are typically two ways that consumers spend their money. One way is that consumers continue to spend on the same products and services that they bought before the recession. The other spending trend that occurs during a recovery is that consumers change the products and services that they spend money on. The reason for this change in spending habits is that consumers have changed their priorities during the recession. When a recession has caused consumers to have less disposable income, they tend to make their money go further. When consumers have less disposable income, they can no longer afford to spend money on certain products and services.
The Impact of a Recession on Consumers
A recession can have a lasting impact on consumers. Consumers who experience a recession tend to have less confidence in their ability to manage their money. This can cause lasting damage to their credit scores as they seek out lower interest loans or take out a repayment plan. A recession can also impact a consumer’s career and ability to earn a living wage. When a recession occurs, businesses have to make changes to remain profitable. This might include laying off employees or reducing the hours that part-time workers are scheduled for. A recession can impact consumers’ ability to buy a home as well. Mortgage rates tend to be higher during a recession as investors seek out higher returns because of the increased risk of default.
Consumer Responses During a Recession
When a recession occurs, consumers are likely to make changes to their spending habits in order to save money. The first thing that consumers are likely to do is reduce discretionary spending. Discretionary spending is the money that is spent on entertainment activities, eating out at restaurants, shopping for luxury items, and on travel. Another common response of consumers during a recession is to change how they get their services. When a recession occurs, consumers are likely to change how they get their banking, insurance , and healthcare services as well as how they pay their bills.
How Consumers Can Manage Their Money in a Recession
The best way for consumers to manage their money during a recession is to make a budget. A budget for spending should include all of the money that goes out of your bank account each month as well as how much money comes into your account. When making a budget, it is important to consider your expenses and income to see if there is any room in your budget to make changes. This can include looking at your monthly expenses and trying to reduce the amount that you spend on certain items. When you are making a budget, it is important to keep in mind that you will have to change it as time goes on. As your income changes, you may have more or less money available to spend each month. Likewise, you may also have more or less expenses to pay each month.
Investing in the Stock Market: The stock market is one of the riskiest investments you can make. It’s also one of the most profitable when things go right. The stock market has its ups and downs, but it always rebounds in the long run. Even during a recession, savvy investors know how to make money in the stock market by investing in stocks and other types of securities. Investing in the stock market may seem intimidating at first, but it’s not as complicated as you think! In this Educational article, we’ll show you how to invest in the stock market if you have less than $5,000 to invest. With these tips and tricks to invest in a recession, you’ll be on your way to becoming a successful investor with an impressive portfolio sooner than you think!
How to invest in the stock market with $5,000
Before you dive head first into the stock market, it’s important to know how much you have to invest. While the stock market can be rewarding, it’s also one of the riskiest investments you can make. Investing in the stock market is all about risk and reward — the more risk you take, the bigger your reward can be. Investing in the stock market requires at least $5,000 in order to diversify your portfolio. Diversification is key to long-term success in the stock market. Rather than putting all of your eggs in one basket, diversification allows you to spread your funds across many different investments.
Diversification is key
When you’re investing in the stock market, it’s important to diversify your portfolio. Diversification allows you to spread your funds across many different investments for two reasons: risk reduction and opportunity enhancement. Risk reduction is accomplished by not putting all of your funds into one investment. Instead, you’re spreading the funds across different types of investments. Opportunity enhancement allows you to take advantage of different types of growth opportunities.
Understand why you’re investing
Before you invest in the stock market, it’s important to understand why you’re investing in the first place. If you’re investing for growth, you’re looking for stocks that are currently undervalued to increase in value over time. If you’re investing for income, you’re looking for stocks that pay dividends.
Take advantage of no-fee investments
When you invest in the stock market, you pay fees for the management of your portfolio. Mutual funds and exchange-traded funds (ETFs) are mutual funds that are pre-packaged and purchased as a single unit. Mutual funds are professionally managed funds that are offered by financial institutions, whereas ETFs are professionally managed funds that are traded on a stock exchange. If you’re investing a small amount of money in the stock market, you’re better off choosing mutual funds or ETFs that have no or low management fees. Mutual funds and ETFs with no or low management fees are often referred to as no-load funds.
Shorting ETFs can be profitable (This strategy is best suitable for Professional Traders)
Shorting ETFs can be profitable if you’re investing a large amount of money in the stock market. Shorting ETFs allows you to profit from a declining market. Shorting ETFs is a very risky investment strategy and is not recommended for beginners. If you’re interested in shorting ETFs, be sure to talk to a financial advisor before making any investments.
Additional Note: When the global economy is on the verge of recession, investors are scared and their first thought is to run towards things that are safe. In recent years, markets have grown to distrust risky investments such as stocks and other volatile assets. When the global economy is about to go into recession, commodities like gold and oil usually become hot properties for investors wanting to preserve their capital. There are a number of asset classes that thrive during a recession: real estate, bonds, and value stocks—or anything with a low correlation to the stock market. However, at the same time there are also some that suffer: high-beta stocks; growth stocks; growth real estate; luxury goods; emerging market equities; and anything else with a high correlation to the stock market. In our next article we will analyze Gold and Silver as an hedge against inflation and their performance in an economic downturn.
Conclusion
The recession that took place in the early 2000s is a great example of how a recession can change the way consumers spend their money. During this recession, consumers were likely to spend more money on food and clothing since those were necessities that consumers could not do without. When the next recession occurs, consumers may change their spending habits once again. However, it is important to remember that a recession is a natural part of the business cycle. It is likely that consumers will continue to spend their money in the future even in the face of a recession. Investing in the stock market is a smart way to diversify your investment portfolio. It’s also a great way to earn passive income through dividends. The best way to invest in the stock market if you have less than $5,000 to invest is through mutual funds or ETFs with no or low management fees. Shorting ETFs can also be a great way to make money in a recession if you have a large amount of funds to invest.
Even though the technical definition of a recession has been changed/modified it is important to know that unemployment rate determines the condition of a recession.

How Will Retail Sales Effect Stocks Today?Stocks have pushed higher, spiking up to our level at 4327. However, we have retraced back to the high 4200 handle. The rally appears to be growing weaker. We have some risk off news including Tencent, the Chinese tech firm reporting negative revenue for the first time in history. We also have retail sales at 8:30AM EST, which another data point the Fed will be looking at. A softer reading will weaken the Fed's case to aggressively hike rates, though the headline is only expected at 0.1% . If we do retrace, then 4272 is a reasonable level to expect support, with 4188 a likely floor. If we break out, then 4350 is the next target.

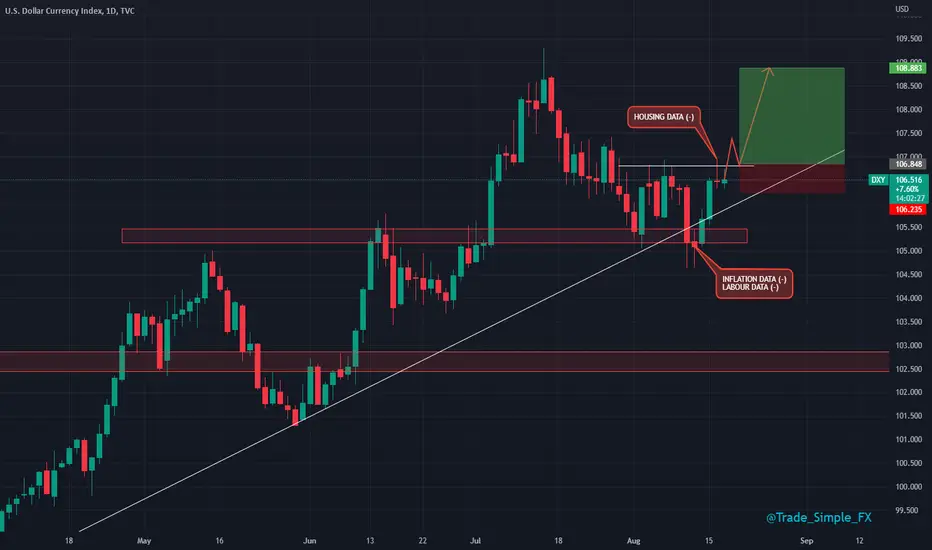
DXY D1 - Long SignalDXY D1
Still quietly confident that the dollar is going to take off upside, it's just a matter of time, the data points released haven't exactly been complimentary, but that being said.
The economic data points have been shaken off and we still expecting a dollar break of 107.00 we can then load up on our USD longs, commodities are still setup bearish, as per the above (and below to follow).
Stocks Open Near HighsStocks opened near highs as investors digest last week's data. We have retail sales and housing data this week, which may contribute to a clearer picture of the Fed's plan for their September meeting. Currently, the estimate seems to be a 50bps rate hike, followed by a potential softening in policy stance. The S&P 500 hit our target of 4272, and seems to be tapering slightly. The Kovach OBV is strong, but has started to level off. If we see resistance here, watch for support in the lower 4200's or 4188. If we are able to break out again, then 4306 is the next target.

Gold Rejects the $1800'sGold has rejected higher levels, and retraced to support. Recall that we are in a previous value area between 1795 and 1815, which coincides roughly with the 0.618 Fibonacci level at around 1800. We should see support from the lower bound at 1795, and potentially pivot and test 1815 again. This level should provide formidable resistance, confirmed recently by multiple red triangles on the KRI. If we fail to muster the strength to pivot from current levels, then we should see support around 1780, the 50% Fibonacci retracement level.

GOLD BILL RUNOANDA:XAUUSD
The MONTHLY chart shows the ratio between the spot gold price
and the US inflation rate.
While overall, the ratio is quite stable or consolidated for a period
of more than 15 years.
Hpwever. y three episodes are noted where the ratio rose parabolically
including 2009, 2015 and the Covid 2022 time period
.
For the present, the RSI Swing Indicator has printed a Buy Signal.
and
the MACD shows an early K/D crossover under the histogram.
Does this suggest an impending hard Bullrun for XAUUSD?
Please comment and offer your opinion. OANDA:XAUUSD

Why Corporate Bonds are not a good option for Retail InvestorsCorporate bonds or tradeable debt instruments issued by corporations are a type of fixed income security. Given the recent media attention and the rising demand for fixed income investments among retail investors, it may come as a surprise that they are not suitable for all investors. Corporate bonds have different risks associated with them than other fixed income investments like savings accounts, money market funds, and even municipal bonds. If you are considering investing in corporate bonds or are already holding some in your portfolio, here is why you should avoid them as a retail investor
What is a Corporate Bond?
A corporate bond is a debt instrument issued by a corporation to raise money. Corporate bonds typically have a set maturity date after which the outstanding principal will be repaid. There are many kinds of corporate bonds, including investment grade and high yield, government and non-government, and they can be issued in local or foreign currencies. Corporate bonds are often traded on the secondary market, which means they are liquid and can be bought and sold easily. Investors earn a return on corporate bonds by receiving interest payments and by the increase in the bond’s value as it matures. The interest rate on a corporate bond is based on factors like the company’s credit rating, the length of time the bond is outstanding, and the bond yield in the market at that time. Corporate bonds are typically less liquid than stocks, and may have shorter holding periods, especially if you purchase them on the secondary market.
Risks of investing in Corporate Bonds
Corporate bonds are considered a form of debt financing, and as such, there are risks associated with holding them. The main ones are default, liquidity, and interest rate risk. - Default risk - Investing in corporate bonds entails the risk that the issuing company will default on the payment of interest or the repayment of principal. However, since corporate bonds are issued by companies in different industries, there is a low probability that they will all default at the same time. - Liquidity risk - The risk that you will not be able to sell the investment in a timely fashion at a price that is attractive to you. - Interest rate risk - The risk that if you hold the investment until maturity, you will earn a lower rate of return because interest rates will have risen in the meantime.
Why you should avoid Corporate Bonds as a Retail Investor
While corporate bonds may be suitable for institutional investors, they are not a good option for the average retail investor. For one, you will have to educate yourself on the various types of corporate bonds, their risks and returns, and what kind of companies you should be investing in. Even if you are successful at taking this on, you are likely to end up with a very concentrated portfolio, which brings us to the next problem. The other issue is that retail investors typically hold a small number of bonds and these bonds are often concentrated in a few issuers. This is not a good strategy because if a company defaults, you could lose a large portion of your capital. This is clearly a bad strategy.
So, How about Investment grade debt ETFs?
LQD, In a rising interest-rate scenario. The bonds' tenure is clearly working against them, especially since unemployment continues to fall at an astonishing rate. This is not the time to invest in this ETF if the Fed raises interest rates to combat inflation.
In order to completely comprehend this analysis we must know how important the duration is, while investing in bonds.
Duration is an important topic. It is the bond's effective maturity, which means it is oriented to something lesser than the time of the bond's final payment since part of the bond's value, generally from coupons, happens earlier in the bond's existence. If a bond has a longer effective maturity at a fixed interest rate, it indicates that investors are tied to an interest rate that was once market for a longer period of time, and if rates increase as they are currently, you will be bound to an uneconomical rate for a longer period of time. Simply put, longer term bonds lose value more severely when interest rates increase.
How maturity of a these bonds (Duration) is affecting LQD
Unemployment has gone down despite the increased rates, which has surprised many analysts. The Phillips Curve is back in force, where low unemployment yields high inflation if inflation is kept down, and contrary to common perception, Consumer spending has declined, but unemployment is so low that it might rise again unless the Federal Reserve, which is committed to lowering inflation, continues its anti-inflation campaign. The Federal Reserve has raised rates as well as given gloomy recession predictions, and more banks are following its lead, including the Bank of England. LQD, which has dropped 14% this year, have long-duration bonds, majority of fixed-rate, which is concering for this ETF.
Credit Spread
Global Cooperate Bonds in general
Corporate bonds continuing their strong performance in July, producing $80 million (+76% year on year). July was the most profitable month of the year for CBs . Their revenues in 2022 have exceeded from 2021 ($512 million). Average balances increased by 9.8% year on year, average costs increased by 59% year on year, and usage have increased by 27% year on year. Spreads on non-investment grade and high yield bonds continue to widen as corporate prospects deteriorate owing to weakening consumer demand and stricter financial conditions. In-turns , asset values fall, yields rises, and borrower demand increases. However, CG Debt funds have seen the highest monthly outflows in May and June (-$73.7 billion)
In July, High Yield Bonds enjoyed the relieve rally.
Interest rates vs Corporate Bonds comparison
Alternatives to Corporate Bonds for retail investors
For retail investors, the most advisable option is to go with government bonds. Government bonds have historically offered a lower risk profile compared to corporate bonds. The best way to go about investing in government bonds is to go for a diversified bond fund. Using a bond fund reduces the risk associated with investing in bonds further as the fund manager may hold a large number of different bonds. If you are looking at a short-term investment horizon (less than 10 years), then you could also opt for short-term government bonds. If you have a long-term horizon, then you could consider a long-term government bond fund. Savings accounts, money market funds, and short-term government bonds are very liquid forms of low risk investment options.
Conclusion
It is important to understand that the corporate bond market is not risk-free. When interest rates are rising, corporate bonds are generally falling in price as they are competing against government bonds with lower interest rates. In times of economic uncertainty or when interest rates are rising, the risk of default is generally higher for companies issuing corporate bonds. Thus, it is advisable to invest in corporate bonds only when the economy is growing steadily. For retail investors, the best options are to go with government bonds or short-term government bonds. These are low risk, liquid investments and will help you achieve your financial goals.

Softer Fed Outlook Fuels Stock RallyStocks have rallied, breaking through to higher levels. The markets seem to interpret recent economic data in a manner that suggests that the Fed is going to cool down their hawkish stance. Right now, a 50bps rate hike is expected for September (potentially the last one), whereas 75bps was not off the table before Wednesday's CPI. This was further supported by Producer Prices. Markets are considering this a green light to rally again. We have broken past 4245, but have fallen just short of our target of 4272. Resistance is confirmed by red triangles on the KRI. The Kovach OBV has picked up with the rally, but it does appear that momentum is stalling. We are due for a bit of a retracement, with 4188 a reasonable area to expect support. If the rally can continue then 4272 is the next target with 4293 and 4306 in line after that.

Bonds Break SupportBonds have edged lower, breaking through support at 119'23. We have fallen to suport at 119'01, currently hugging this level, but finding good support confirmed by two green triangles on the KRI. The Kovach OBV has slipped a little, confirming the selloff, but has since appeared to level off. If we are able to pivot here, then 119'23 and 120'14 are the next targets to the upside. Watch for the vacuum zone below to 118'04.

Stocks Range Ahead of CPIStocks have established highs, then immediately rejected them, and are continuing the sideways correction. We mentioned that 4178 and 4188 will be very hard to break, as they correspond to relative highs from a previous range held in June. We are seeing support from 4122, but we are on the precipice of a vacuum zone below to 4068. There is another vacuum zone below that to 4009. The Kovach OBV has leveled off so if nothing signficant happens, then we should maintain the current range. All eyes are on CPI today, which will provide a reading on the massive inflation we have been seeing as of late. This will give us more insight as to the Fed's plan to raise rates, potentially by 50bps at the September FOMC. Don't expect much action in stocks until at least 8:30AM EST, when the data is released.

Bulls can´t fly. Or do they ?In response to the Corona Crash, the Trump administration immediately lowered interest rates to the lowest level.
The economic consequences of this are still having an impact. In addition, to combat historically inflationary conditions, interest rates are being raised faster than ever before.
This is very interesting to look at analogically. When the market crashed and the government switched to the zero interest rate policy, we had strong upward growth with new historical highs in the market.
So ask: What happens in a falling market, which has been fed by fresh money in recent years, in which interest rates are now being raised?

Expectations for September's FOMCWhat do the markets care about this week? We have another CPI print on Wednesday, which is highly anticipated. We are in a period of nasty stagflation and the Fed is caught in a difficult position. They want to raise rates further, but the issue is that our cause of inflation seems to be on the supply chain side. Interest rates will do little to combat this. The NFP numbers Friday were pretty strong, so their case is strengthened to raise by at least 50bps in September, at the next FOMC. It will be almost a certainty if CPI comes in hot.
Note that GDP came in contractionary for two quarters in a row, which is the definition most use for a recession. This stands somewhat at odds with the strong NFP numbers, which could be a seasonal fluke. If the data continues to indicate that we are in a recession, the Fed will eventually be forced to lower rates again. The markets seem to be weighing this reality before rallying with conviction.

What Today's Employment Data Means for Stocks and the FedNon Farm Payrolls introduced some volatility in stocks. The numbers came in hot, with a headline beat and unemployment at 3.5% . The S&P 500 had already edged higher, reaching our target of 4178, and establishing value between 4144 and 4178. The NFP data release introduced some volatility, with a small selloff extending past 4122 into the vacuum zone down to 4068. It appears the figures were priced in already, and stocks may be correcting because of that. Also, the strong numbers give the Fed more justification to hike rates in September. If stocks fall further watch for support at 4068, but be mindful of the vacuum zone below to 4009.

Gold RetracesGold edged higher, breaking out of the 0.618 Fibonacci level at about $1800. However, we encountered resistance at the next technical level above, at $1815. Immediately, we saw the price action round off and retrace back to safety in the $1790's. We anticipate gold to establish value between $1780 and $1800 (two significant Fibonacci levels), unless more momentum can come through and help solidify the $1800's. The Kovach OBV is wavering, which suggests we do not quite have enough momentum yet to sustain a breakout.

Employment Data Hammers BondsBonds crept up but are facing resistance. After ZN tested highs at 121'28, and retraced, it started to establish value between 119'23 and 121'00. The latter has provided prohibitive resistance, as we have discussed this week, and we have seen a rejection, continuing the sideways correction. We saw a wick down to 119'23, where we found support, at first, but we subsequently broke through to the vacuum zone below. This follows Non Farm Payrolls coming in at a surprise beat, with unemployment at 3.5%. Expect support at 119'01.

GBPUSD H4 - Short SignalGBPUSD H4
Now this is effectively what we are looking for on a lower timeframe front. Our higher timeframe has seen a daily confirmation, H4 timeframe would be great to see a structure break and retest to confirm a break of this H4 bull trend.
Therefore, like mentioned before, leaving the D1 bear trend to take precendence

GOLD channel bottom fishing..Added bear trap tiles for reversal potential....the tiles are the outs for the bulls so the bears well might go but with9+% inflation numbers Interest rates will climb to even higher ratchets down equities harder. Even the dollar started to weaken. PPI, jobless claims, retail sales, and import prices... the bears will need some luck.
