BANK NIFTY INTRADAY LEVELS FOR 03 JUNE 2024BUY ABOVE - 49050
SL - 48860
TARGETS - 48550,48340,48200
SELL BELOW - 48680
SL - 48860
TARGETS - 48550,48340,48200
NO TRADE ZONE - 48680 to 49050
Previous Day High - 49050
Previous Day Low - 48550
Based on price action major support & resistance's are here, the red lines acts as resistances, the green lines acts as supports. If the price breaks the support/resistance, it will move to the next support/resistance line. White lines indicates previous day high & low, high acts as a resistance & low acts as a support for next day.
Trendlines are also significant to price action. If the price is above/below the trendlines, can expect an UP/DOWN with aggressive move.
Please NOTE: this levels are for intraday trading only.
Disclaimer - All information on this page is for educational purposes only,
we are not SEBI Registered, Please consult a SEBI registered financial advisor for your financial matters before investing And taking any decision. We are not responsible for any profit/loss you made.
Request your support and engagement by liking and commenting & follow to provide encouragement
HAPPY TRADING 👍
Intraday

Day Trading Nifty- Trigger to sell 22566 31st May ’24Below mentioned points are discussed in my post analysis video(Fast forward to 0:15 for Hindi Audio)
-No Trades in the morning
-Very Good Volumes before 10 in nifty!
-Trigger to sell 22566;
-How will i trade when market opens tom

Analysis of XAUUSD intraday, ranging market today👋Hello Traders,
Our 🖥️ AI system detected that there is an H4 timeframe is in ranging market right now and move between the supply zone and demand zone today before news.
For more ideas, you are welcome to visit our profile in tradingview.
Have a good day!
Please give this post a like if you like this kind of simple idea, your feedback will bring our signal to next better level, thanks for support!

BANK NIFTY INTRADAY LEVELS FOR 31 MAY 2024BUY ABOVE - 48860
SL - 48680
TARGETS - 49050,49290,49480
SELL BELOW - 48550
SL - 48680
TARGETS - 48340,48200,48000
N O TRADE ZONE - 48550 to 48860
Previous Day High - 49050
Previous Day Low - 48340
Based on price action major support & resistance's are here, the red lines acts as resistances, the green lines acts as supports. If the price breaks the support/resistance, it will move to the next support/resistance line. White lines indicates previous day high & low, high acts as a resistance & low acts as a support for next day.
Trendlines are also significant to price action. If the price is above/below the trendlines, can expect an UP/DOWN with aggressive move.
Please NOTE: this levels are for intraday trading only.
Disclaimer - All information on this page is for educational purposes only,
we are not SEBI Registered, Please consult a SEBI registered financial advisor for your financial matters before investing And taking any decision. We are not responsible for any profit/loss you made.
Request your support and engagement by liking and commenting & follow to provide encouragement
HAPPY TRADING 👍

NIFTY INTRADAY LEVELS FOR 31 MAY 2024BUY ABOVE - 22500
SL - 22420
TARGETS - 22550,22600,22650
SELL BELOW - 22420
SL - 22500
TARGETS - 22350,22300,22230
NO TRADE ZONE - 22500 to 22550
Previous Day High - 22700
Previous Day Low - 22420
Based on price action major support & resistance's are here, the red lines acts as resistances, the green lines acts as supports. If the price breaks the support/resistance, it will move to the next support/resistance line. White lines indicates previous day high & low, high acts as a resistance & low acts as a support for next day.
Trendlines are also significant to price action. If the price is above/below the trendlines, can expect an UP/DOWN with aggressive move.
Please NOTE: this levels are for intraday trading only.
Disclaimer - All information on this page is for educational purposes only,
we are not SEBI Registered, Please consult a SEBI registered financial advisor for your financial matters before investing And taking any decision. We are not responsible for any profit/loss you made.
Request your support and engagement by liking and commenting & follow to provide encouragement
HAPPY TRADING 👍

Day Trading Nifty- Sold Twice below 22540; 30th May ’24Below mentioned points are discussed in my post analysis video(Fast forward to 0:42 for Hindi Audio)
-No Trades in the morning
-No Volumes in nifty before 10
-Sold Twice below 22540;
-How will i trade when market opens tom

NIFTY 320+ Points Gain - SHORT PositionLoving the momentum in the market these days.
Only if you know how to catch the big moves.
I believe bigger moves are coming from Monday onwards.
Within NIFTY and BankNifty, I feel BankNifty trades will make the bigger money.
Are you prepared? Whats your strategy for the recent volatility? Share your thoughts.

BANK NIFTY INTRADAY LEVELS FOR 30 MAY 2024BUY ABOVE - 48660
SL - 48540
TARGETS - 48860,49050,49290
SELL BELOW - 48400
SL - 48660
TARGETS - 48250,48110,47990
NO TRADE ZONE - 48400 to 48660
Previous Day High - 49050
Previous Day Low - 48400
Based on price action major support & resistance's are here, the red lines acts as resistances, the green lines acts as supports. If the price breaks the support/resistance, it will move to the next support/resistance line. White lines indicates previous day high & low, high acts as a resistance & low acts as a support for next day.
Trendlines are also significant to price action. If the price is above/below the trendlines, can expect an UP/DOWN with aggressive move.
Please NOTE: this levels are for intraday trading only.
Disclaimer - All information on this page is for educational purposes only,
we are not SEBI Registered, Please consult a SEBI registered financial advisor for your financial matters before investing And taking any decision. We are not responsible for any profit/loss you made.
Request your support and engagement by liking and commenting & follow to provide encouragement
HAPPY TRADING 👍

NIFTY INTRADAY LEVELS FOR 30 MAY 2024BUY ABOVE - 22760
SL - 22700
TARGETS - 22800,22850,22900
SELL BELOW - 22700
SL - 22760
TARGETS - 22640,22590,22550
NO TRADE ZONE - 22700 to 22760
Previous Day High - 22850
Previous Day Low - 22700
Based on price action major support & resistance's are here, the red lines acts as resistances, the green lines acts as supports. If the price breaks the support/resistance, it will move to the next support/resistance line. White lines indicates previous day high & low, high acts as a resistance & low acts as a support for next day.
Trendlines are also significant to price action. If the price is above/below the trendlines, can expect an UP/DOWN with aggressive move.
Please NOTE: this levels are for intraday trading only.
Disclaimer - All information on this page is for educational purposes only,
we are not SEBI Registered, Please consult a SEBI registered financial advisor for your financial matters before investing And taking any decision. We are not responsible for any profit/loss you made.
Request your support and engagement by liking and commenting & follow to provide encouragement
HAPPY TRADING 👍

EURUSD: ZONES and CHANNELS Hello traders:
This is intraday analysis for EURUSD:
The mid-term channel is bullish and we are around a good place to see pressure of buyers.
On the other hand, the bullish short-term channel is broken but we are far enough from it.
I'm searching for longing the pair around the current zone 1.0845. my first tp could be around 1.08550 and the final TP is 1.08650.
the 1.08650 zone is perfect for short trading if it coincide with the middle mid-term channel.

Day Trading Nifty- Sold Nifty Below 22740;Sl Hit! 29th May ’24Below mentioned points are discussed in my post analysis video(Fast forward to 0:42 for Hindi Audio)
-No Trades in the morning
-No Volumes in the morning in nifty
-Sold Nifty Below 22740;Sl Hit!
-How will i trade when market opens tom

BPCL- Strong breakout!!-Intraday Analysis for 27th May 2024
Check out swing analysis for overall view pinned below.
Now price reacted at 0.5 Fibonacci level & strong keylevel in upward range trend. If buyers not allowed to create one more higher low then strong movement expected with big breakout.
Price is following the upward channel
Buy Above:657
T1:666
T2: 674
Swing traders can hold for more time
Direct Gapup entry should be avoided
Get confirmation from any of the leading indicators before entering trade
Kindy comment below in case of any clarification required on this particular idea.
Please follow for more ideas

BANK NIFTY INTRADAY LEVELS FOR 29 MAY 2024BUY ABOVE - 49290
SL - 49050
TARGETS - 49480,49670,49850
SELL BELOW - 49050
SL - 49290
TARGETS - 48800,48620,48460
NO TRADE ZONE - 49050 to 49290
Previous Day High - 49480
Previous Day Low - 49050
Based on price action major support & resistance's are here, the red lines acts as resistances, the green lines acts as supports. If the price breaks the support/resistance, it will move to the next support/resistance line. White lines indicates previous day high & low, high acts as a resistance & low acts as a support for next day.
Trendlines are also significant to price action. If the price is above/below the trendlines, can expect an UP/DOWN with aggressive move.
Please NOTE: this levels are for intraday trading only.
Disclaimer - All information on this page is for educational purposes only,
we are not SEBI Registered, Please consult a SEBI registered financial advisor for your financial matters before investing And taking any decision. We are not responsible for any profit/loss you made.
Request your support and engagement by liking and commenting & follow to provide encouragement
HAPPY TRADING 👍

NIFTY INTRADAY LEVELS FOR 29 MAY 2024BUY ABOVE - 22950
SL - 22900
TARGETS - 23000,23100,23180
SELL BELOW - 22850
SL - 22900
TARGETS - 22780,22710,22640
NO TRADE ZONE - 22850 to 22950
Previous Day High - 23000
Previous Day Low - 22850
Based on price action major support & resistance's are here, the red lines acts as resistances, the green lines acts as supports. If the price breaks the support/resistance, it will move to the next support/resistance line. White lines indicates previous day high & low, high acts as a resistance & low acts as a support for next day.
Trendlines are also significant to price action. If the price is above/below the trendlines, can expect an UP/DOWN with aggressive move.
Please NOTE: this levels are for intraday trading only.
Disclaimer - All information on this page is for educational purposes only,
we are not SEBI Registered, Please consult a SEBI registered financial advisor for your financial matters before investing And taking any decision. We are not responsible for any profit/loss you made.
Request your support and engagement by liking and commenting & follow to provide encouragement
HAPPY TRADING 👍

ICT Long setup SOLUSDT👋Hello Traders,
Our 🖥️ AI system detected that there is an ICT Long setup in SOLUSDT for scalping.
Please refer to the details Stop loss, FVG(Buy Zone),open for take profit.
For more ideas, you are welcome to visit our profile in tradingview.
Have a good day!
Please give this post a like if you like this kind of simple idea, your feedback will bring our signal to next better level, thanks for support!

Day Trading Nifty- Sell Trigger below 22915 28th May ’24Below mentioned points are discussed in my post analysis video(Fast forward to 0:45 for Hindi Audio)
-No Trades in the morning
-Poor Volumes in nifty before 10
-Sell Trigger below 22915
-How will i trade when market opens tom

EURUSD: Intraday Analysis
Features of the Chart:
Short-Term Bullish Channel: Relatively sharp incline.
Mid-Term Channel: Almost range-bound.
Trend Line: Key support/resistance.
Trading Plan:
Confirmation to Buy: Wait for the break of the trend line and a move above 1.0856.
Entry Point: Enter long around 1.085, which is the cluster of:
Broken trend line
Midpoint of the long-term channel
Midpoint of the short-term channel
Note: This analysis is valid for intraday trading and may be influenced by upcoming economic news or significant market events. Adjust positions accordingly based on new information.

BANK NIFTY INTRADAY LEVELS FOR 28 MAY 2024BUY ABOVE - 49480
SL - 49290
TARGETS - 49670,49850,50000
SELL BELOW - 49290
SL - 49480
TARGETS - 49050,48800,48620
NO TRADE ZONE - 49050 to 49670
Previous Day High - 49670
Previous Day Low - 49050
Based on price action major support & resistance's are here, the red lines acts as resistances, the green lines acts as supports. If the price breaks the support/resistance, it will move to the next support/resistance line. White lines indicates previous day high & low, high acts as a resistance & low acts as a support for next day.
Trendlines are also significant to price action. If the price is above/below the trendlines, can expect an UP/DOWN with aggressive move.
Please NOTE: this levels are for intraday trading only.
Disclaimer - All information on this page is for educational purposes only,
we are not SEBI Registered, Please consult a SEBI registered financial advisor for your financial matters before investing And taking any decision. We are not responsible for any profit/loss you made.
Request your support and engagement by liking and commenting & follow to provide encouragement
HAPPY TRADING 👍

NIFTY INTRADAY LEVELS FOR 28 MAY 2024BUY ABOVE - 22960
SL - 22910
TARGETS - 23020,23100,23180
SELL BELOW - 22910
SL - 22960
TARGETS - 22850,22780,22780
NO TRADE ZONE - 22910 to 22960
Previous Day High - 23100
Previous Day Low - 22910
Based on price action major support & resistance's are here, the red lines acts as resistances, the green lines acts as supports. If the price breaks the support/resistance, it will move to the next support/resistance line. White lines indicates previous day high & low, high acts as a resistance & low acts as a support for next day.
Trendlines are also significant to price action. If the price is above/below the trendlines, can expect an UP/DOWN with aggressive move.
Please NOTE: this levels are for intraday trading only.
Disclaimer - All information on this page is for educational purposes only,
we are not SEBI Registered, Please consult a SEBI registered financial advisor for your financial matters before investing And taking any decision. We are not responsible for any profit/loss you made.
Request your support and engagement by liking and commenting & follow to provide encouragement
HAPPY TRADING 👍

DayTrading Nifty-Sold Below 23050,Bought Above Day high 27th MayBelow mentioned points are discussed in my post analysis video(Fast forward to 0:41 for Hindi Audio)
-No Trades in the morning
-Poor Volumes in nifty before 10
-Sold Below 23050,Bought Above Day high!
-How will i trade when market opens tom

BANK NIFTY INTRADAY LEVELS FOR 28 MAY 2024BUY ABOVE - 49010
SL - 48800
TARGETS - 49250,49480,49610
SELL BELOW - 48800
SL - 49010
TARGETS - 48620,48460,48250
NO TRADE ZONE - 48800 to 49010
Previous Day High - 49010
Previous Day Low - 48620
Based on price action major support & resistance's are here, the red lines acts as resistances, the green lines acts as supports. If the price breaks the support/resistance, it will move to the next support/resistance line. White lines indicates previous day high & low, high acts as a resistance & low acts as a support for next day.
Trendlines are also significant to price action. If the price is above/below the trendlines, can expect an UP/DOWN with aggressive move.
Please NOTE: this levels are for intraday trading only.
Disclaimer - All information on this page is for educational purposes only,
we are not SEBI Registered, Please consult a SEBI registered financial advisor for your financial matters before investing And taking any decision. We are not responsible for any profit/loss you made.
Request your support and engagement by liking and commenting & follow to provide encouragement
HAPPY TRADING 👍

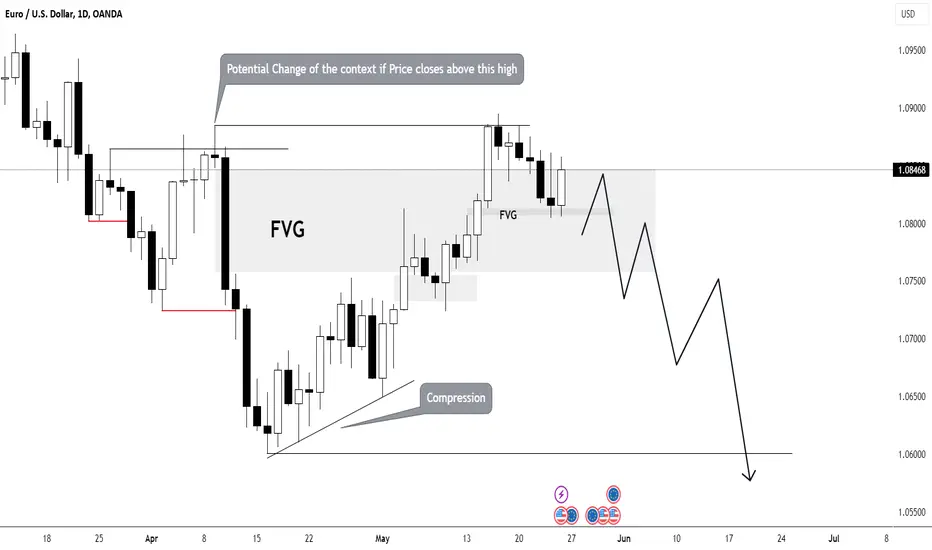
EURUSD 1Dthe daily timeframe is in a short context. Currently, we are in a corrective movement with the aim of overlapping the FVG. The lack of activity below the fractal compression (marked on the chart) inspires confidence. The target is 1.06. The scenario will be invalidated if the price closes above 1.088.
Day Trading Nifty- Scalp at 23000 24th May '23Below mentioned points are discussed in my post analysis video(Fast forward to 0:24 for Hindi Audio)
-No Trades in the morning
-Poor Volumes and Structures before 10 in Nifty
-Scalped Nifty Future at 23000;
-How will i trade when market opens tom
