Cipla-Intraday 06.05.2024- Bulls, Are you ready?NSE:CIPLA
Day TF
Healthy Hammer candle formed in day
15 Min TF
Price is under consolidation which is very good sign for further movement
Price has rejected from support level.
Price has reacted well with 200 EMA & 50 EMA today.
Good Recovery after 10 AM
Buy:
Risky trader: Buy at 1428. Target 1%
Direct Gap-up entry should be avoided
Get confirmation from any of the leading indicators before entering trade
Kindy comment below in case of any clarification required on this particular idea.
Please follow for more ideas
“Confidence is not ‘I will profit on this trade.’ Confidence is ‘I will be fine if I don’t profit from this trade.” - Yvan Byeajee
Intraday

Day Trader-Buy Nifty Near Lows if 22440 breaks-7th May ’24Below mentioned points are discussed in my post analysis video(Fast forward to 0:30 for Hindi Audio)
-No Trades in the morning
-No Volumes in nifty before 10
-Buy Nifty Near Lows if 22440 breaks;
-How will i trade when market opens tom

XAU/USD 07 May 2024 Intraday AnalysisH4 Analysis:
Analysis/bias remains the same as yesterday's analysis dated 06 May 2024.
-> Swing: Bearish.
-> Internal: Bearish.
Price has now printed a bearish BOS and iBOS as price needed a pullback from all HTF's
Following the shift in structure we now expect price to pullback. First indication, but not confirmation, of pullback initiation would be for price to print a bearish CHoCH which is denoted with a blue dashed line.
Price is currently reacting at H4 demand level.
Price remains in pullback phase and is now is discount of internal structure where it is expected the strong low to hold.
As per intraday expectation dated 06 April, price was to print bullish CHoCH, reach 50% of internal EQ before targeting weak internal low. Price did print bullish CHOCH and reach 50% EQ and targeted weak internal low, however, price was unable to close below.
Intraday expectation : From a structural perspective price to target weak internal low.
H4 Chart:
M15 Analysis:
-> Swing: Bullish.
-> Internal: Bullish.
Price has printed a printed a bullish iBOS
Bearish CHoCH has been printed which indicates, but not confirms, that we are in pullback phase.
Intraday expectation: Price to react at 50% or M15 POI before targeting weak internal high.
However, due to the bearish structure of H4 it would not be unrealistic for price to target swing low.
M15 Chart:

EURUSD 7 May 2024 W19 - Intraday Analysis - EU Retail SalesThis is my Intraday analysis on EURUSD for 7 May 2024 W19 based on Smart Money Concept (SMC) which includes the following:
Market Sentiment
4H Chart Analysis
15m Chart Analysis
Market Sentiment
Today's sentiment for EUR/USD pair is shaped by pivotal occurrences from the previous week. The release of weaker-than-anticipated Non-Farm Payroll (NFP) data prompted a decline in the US dollar, lending some buoyancy to the EUR/USD pair. Additionally, the Federal Open Market Committee (FOMC) statement and remarks from Federal Reserve Chair Jerome Powell wielded considerable influence. The FOMC opted to maintain the policy interest rate and continue tapering securities holdings. Powell reiterated the Fed's unwavering commitment to achieving their 2% inflation target. Consequently, there's a prevailing bearish sentiment towards the US dollar, keeping the EUR/USD pair comfortably above the 1.0750 threshold. However, the market remains vigilant ahead of this week's data releases.
4H Chart Analysis
1.
Swing Bearish
Internal Bullish
Reached Swing EQ
INT Structure Pullback Phase
2.
Swing continuing bearish following the HTF Bearish Trend. Expectations is set for the Swing to stay bearish to fulfill the HTF targets.
3.
INT Structure turned Bullish signaling a complex pullback phase with deep pullback that reached the Swing EQ and tapped into the Daily Supply.
Currently with INT Structure is Bullish we don't have a solid confirmation that the Swing PB is over and we will continue Bearish. Instead, INT structure could continue Bullish.
More Price development required from LTF in order to play the INT Structure PB or the INT structure Bullish continuation.
15m Chart Analysis
1.
Swing Bullish
Internal Bullish
Long : Phase A2
Short : Phase D
2.
Nothing changed since yesterday, price still ranging!
Swing failed to continue Bearish and with NFP we created a Bullish BOS which reached the Daily Supply Zone.
After a BOS we expect a Pullback. INT structure is Bullish which means we still in Bullish continuation.
With the 4H created a Bullish iBOS and requesting a Pullback, i prefer to look for Shorts after a Bearish iBOS.
Longs will be ideal for me when we reach the 4H demand zone within the 15m Swing.
3.
15m/4H Demand zones for possible longs one reached.

BANK NIFTY INTRADAY LEVELS FOR 07/05/2024BUY ABOVE - 48970
SL - 48800
TARGETS - 49130,49300,49480
SELL BELOW - 48800
SL - 48970
TARGETS - 48660,48500,48400
NO TRADE ZONE - 48800 to 48970
Previous Day High - 49300
Previous Day Low - 48800
Based on price action major support & resistance's are here, the red lines acts as resistances, the green lines acts as supports. If the price breaks the support/resistance, it will move to the next support/resistance line. White lines indicates previous day high & low, high acts as a resistance & low acts as a support for next day.
Trendlines are also significant to price action. If the price is above/below the trendlines, can expect an UP/DOWN with aggressive move.
Please NOTE: this levels are for intraday trading only.
Disclaimer - All information on this page is for educational purposes only,
we are not SEBI Registered, Please consult a SEBI registered financial advisor for your financial matters before investing And taking any decision. We are not responsible for any profit/loss you made.
Request your support and engagement by liking and commenting & follow to provide encouragement
HAPPY TRADING 👍

NIFTY INTRADAY LEVELS FOR 07/05/2024BUY ABOVE - 22470
SL - 22420
TARGETS - 22510,22550,22600
SELL BELIW - 22420
SL - 22470
TARGETS - 22360,22270,22210
NO TRADE ZONE - 22420 to 22470
Previous Day High - 22600
Previous Day Low - 22420
Based on price action major support & resistance's are here, the red lines acts as resistances, the green lines acts as supports. If the price breaks the support/resistance, it will move to the next support/resistance line. White lines indicates previous day high & low, high acts as a resistance & low acts as a support for next day.
Trendlines are also significant to price action. If the price is above/below the trendlines, can expect an UP/DOWN with aggressive move.
Please NOTE: this levels are for intraday trading only.
Disclaimer - All information on this page is for educational purposes only,
we are not SEBI Registered, Please consult a SEBI registered financial advisor for your financial matters before investing And taking any decision. We are not responsible for any profit/loss you made.
Request your support and engagement by liking and commenting & follow to provide encouragement
HAPPY TRADING 👍

BPCL- Intraday & Swing Analysis(Market at crucial level!! )
Day TF:
Overview: After the big up trend from November 2023, price has reached new all time high couple of times and under consolidation from two months. Again the price has bounced from support but this time with W Chart pattern & more importantly Fibonacci at 0.382 Level. Inside candle price break in weekly time frame
If stock found some consolidation during W Pattern. We can expect new all time high in couple of weeks.
15 Min TF:
• Over all, Stock us in upward range by creating Higher Highs and Higher lows
• After rejecting the price from 200 EMA, price has shifted gears and given a healthy breakout and reached new all time high.
• Later part, due to profit booking, it was under retracement. During observation, we can find the gradual decrease in volume indicating bullish hold.
• Further, price has rejected at previous resistance level by converting to support and also it was rejected by FVG & 50 EMA.
Entry:
Buy (Risk Entry): Above 632
Safe Entry: Above 636
Safe exit for intraday:639
Swing/positional traders can hold long for bigger profits ahead.
Get confirmation from any of the leading indicators before entering trade
Kindy comment below in case of any clarification required on this particular idea.
Please follow for more ideas
Quote of the Day: “The trend is your friend until the end when it bends.” - Ed Seykota
NSE:BPCL

XAU/USD 06 May 2024 Intraday AnalysisH4 Analysis:
Analysis/bias remains the same as yesterday's analysis dated 12 May 2024.
-> Swing: Bearish.
-> Internal: Bearish.
Price has now printed a bearish BOS and iBOS as price needed a pullback from all HTF's
Following the shift in structure we now expect price to pullback. First indication, but not confirmation, of pullback initiation would be for price to print a bearish CHoCH which is denoted with a blue dashed line.
Price is currently reacting at H4 demand level.
Price remains in pullback phase and is now is discount of internal structure where it is expected the strong low to hold.
As per intraday expectation dated 06 April, price was to print bullish CHoCH, reach 50% of internal EQ before targeting weak internal low. Price did print bullish CHOCH and reach 50% EQ and targeted weak internal low, however, price was unable to close below.
Intraday expectation : From a structural perspective price to target weak internal low.
H4 Chart:
M15 Analysis:
-> Swing: Bullish.
-> Internal: Bearish.
Price has printed a printed a bearish iBOS as mentioned in yesterday's analysis dated 02 April 2024.
Price has pulled back and printed a bullish CHoCH which indicates initiation of pullback.
Price has twice reacted at premium of EQ, however, the move is not being sustained to target weak internal low with price consolidating in a sideways range.
Intraday expectation dated 3 May 2024 was for price to target weak internal low which price did, however, weak swing and internal low remained intact and price was unable to close below.
Intraday expectation: Due to the internal bearish structure of the market price is to once again target weak internal low.
M15 Chart:

EURUSD 6 May 2024 W19 - Intraday Analysis - EU PMIThis is my Intraday analysis on EURUSD for 6 May 2024 W19 based on Smart Money Concept (SMC) which includes the following:
Market Sentiment
4H Chart Analysis
15m Chart Analysis
Market Sentiment
Nothing changed from Friday, the EUR/USD surged to reach a new high for the week, surpassing recent congestion levels. This uptick followed a significant shortfall in the US Nonfarm Payrolls (NFP) data regarding labor and wages. The disappointing figures revived expectations across the market for a quicker pace of Federal Reserve (Fed) rate reductions.
4H Chart Analysis
1.
Swing Bearish
Internal Bullish
Reached Swing EQ
INT Structure Pullback Phase
2.
Swing continuing bearish following the HTF Bearish Trend. Expectations is set for the Swing to stay bearish to fulfill the HTF targets.
3.
INT Structure turned Bullish signaling a complex pullback phase with deep pullback that reached the Swing EQ and tapped into the Daily Supply.
Currently with INT Structure is Bullish we don't have a solid confirmation that the Swing PB is over and we will continue Bearish. Instead, INT structure could continue Bullish.
More Price development required from LTF in order to play the INT Structure PB or the INT structure Bullish continuation.
15m Chart Analysis
1.
Swing Bullish
Internal Bullish
Long : Phase A2
Short : Phase D
2.
Swing failed to continue Bearish and with NFP we created a Bullish BOS which reached the Daily Supply Zone.
After a BOS we expect a Pullback. INT structure is Bullish which means we still in Bullish continuation.
With the 4H created a Bullish iBOS and requesting a Pullback, i prefer to look for Shorts after a Bearish iBOS.
Longs will be ideal for me when we reach the 4H demand zone within the 15m Swing.
3.
15m/4H Demand zones for possible longs one reached.

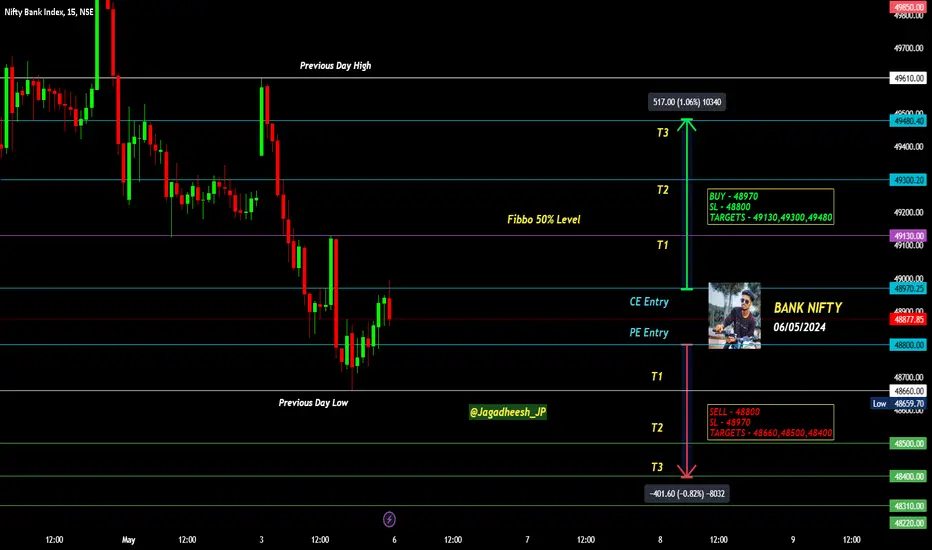
BANK NIFTY INTRADAY LEVELS FOR 06/05/2024BUY ABOVE - 48970
SL - 48800
TARGETS - 49130,49300,49480
SELL BELOW - 48800
SL - 48970
TARGETS - 48660,48500,48400
NO TRADE ZONE - 48800 to 48970
Previous Day High - 49610
Previous Day Low - 48660
Based on price action major support & resistance's are here, the red lines acts as resistances, the green lines acts as supports. If the price breaks the support/resistance, it will move to the next support/resistance line. White lines indicates previous day high & low, high acts as a resistance & low acts as a support for next day.
Trendlines are also significant to price action. If the price is above/below the trendlines, can expect an UP/DOWN with aggressive move.
Please NOTE: this levels are for intraday trading only.
Disclaimer - All information on this page is for educational purposes only,
we are not SEBI Registered, Please consult a SEBI registered financial advisor for your financial matters before investing And taking any decision. We are not responsible for any profit/loss you made.
Request your support and engagement by liking and commenting & follow to provide encouragement
HAPPY TRADING 👍
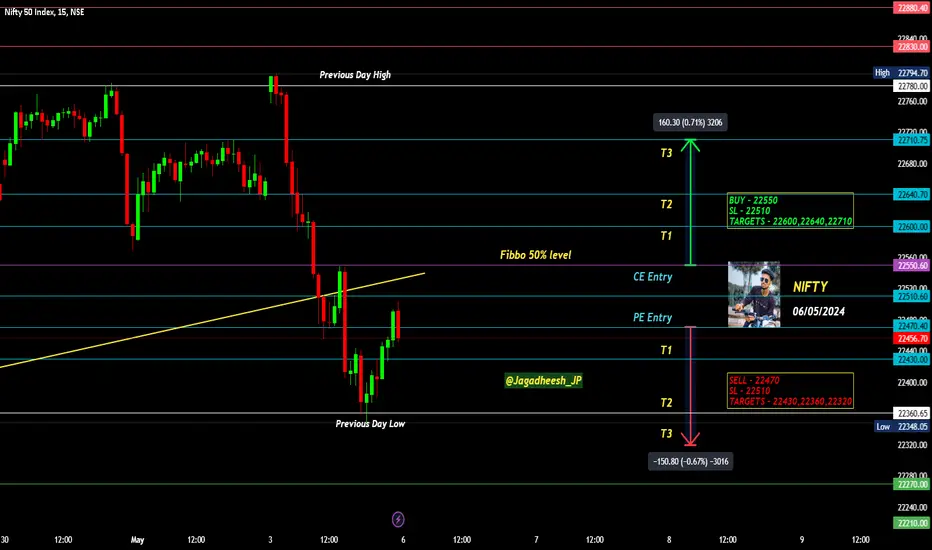
NIFTY INTRADAY LEVELS FOR 06/05/2024BUY ABOVE - 22550
SL - 22510
TARGETS - 22600,22640,22710
SELL BELOW - 22470
SL - 22510
TARGETS - 22430,22360,22320
NO TRADE ZONE - 22470 to 22550
Previous Day High - 22780
Previous Day Low - 22360
Based on price action major support & resistance's are here, the red lines acts as resistances, the green lines acts as supports. If the price breaks the support/resistance, it will move to the next support/resistance line. White lines indicates previous day high & low, high acts as a resistance & low acts as a support for next day.
Trendlines are also significant to price action. If the price is above/below the trendlines, can expect an UP/DOWN with aggressive move.
Please NOTE: this levels are for intraday trading only.
Disclaimer - All information on this page is for educational purposes only,
we are not SEBI Registered, Please consult a SEBI registered financial advisor for your financial matters before investing And taking any decision. We are not responsible for any profit/loss you made.
Request your support and engagement by liking and commenting & follow to provide encouragement
HAPPY TRADING 👍
Sold Nifty Future with Yesterday's Sl as Trigger-3rd May ’24Below mentioned points are discussed in my post analysis video(Fast forward to 0:56 for Hindi Audio)
-No Trades in the morning
-No Good Volumes in Nifty before 10
-Sold Nifty Future with Yesterday's Sl as Trigger
-How will i trade when market opens tom

Tata Consumer Product-Intraday for 02.05.2024
1. Price is at strong support level at Day TF
15 Min TF
1. After a big fall, Price is consolidation in sideways at strong support and resistance level.
2. M Pattern has formed and expected to big breakdown if support level breaks.
3. 200 & 50 EMA has reacted at resistance indicating bearish.
4. Chances of forming bearish flag pattern
Risky Buy: Above 1100(Target 8 points)
Strong Sell: Below 1181(Target 20 Points)
Get confirmation from any of the leading indicators before entering trade
Kindy comment below in case of any clarification required. Please follow for more ideas

BANK NIFTY INTRADAY LEVELS FOR 03/05/2024BUY ABOVE - 49480
SL - 49340
TARGETS - 49670,49850,50000
SELL BELOW - 49180
SL - 49340
TARGETS - 49020,48800,48630
NO TRADE ZONE - 49180 to 49480
Previous Day High - 49480
Previous Day Low - 49180
Based on price action major support & resistance's are here, the red lines acts as resistances, the green lines acts as supports. If the price breaks the support/resistance, it will move to the next support/resistance line. White lines indicates previous day high & low, high acts as a resistance & low acts as a support for next day.
Trendlines are also significant to price action. If the price is above/below the trendlines, can expect an UP/DOWN with aggressive move.
Please NOTE: this levels are for intraday trading only.
Disclaimer - All information on this page is for educational purposes only,
we are not SEBI Registered, Please consult a SEBI registered financial advisor for your financial matters before investing And taking any decision. We are not responsible for any profit/loss you made.
Request your support and engagement by liking and commenting & follow to provide encouragement
HAPPY TRADING 👍

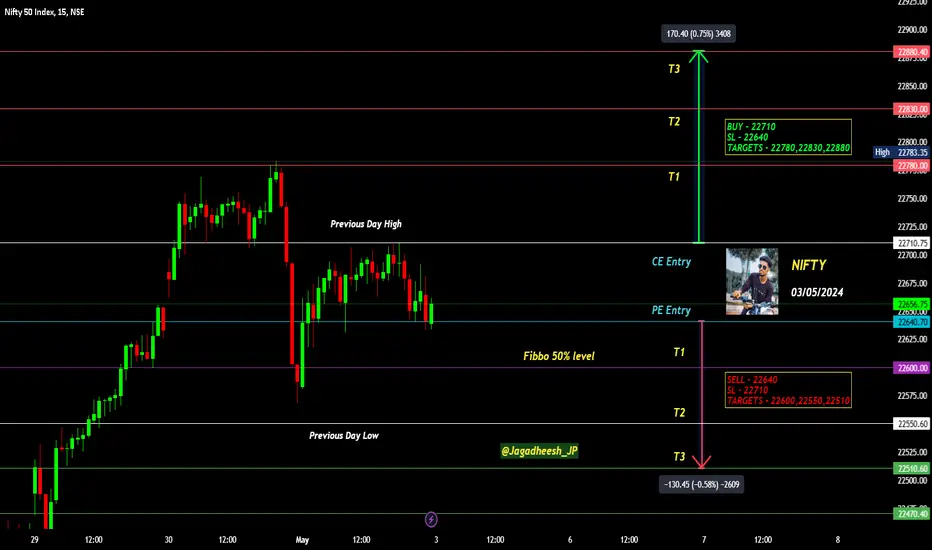
NIFTY INTRADAY LEVELS FOR 03/05/2024BUY ABOVE - 22710
SL - 22640
TARGETS - 22780,22830,22880
SELL BELOW - 22640
SL - 22710
TARGETS - 22600,22550,22510
NO TRADE ZONE - 22640 to 22710
Previous Day High - 22710
Previous Day Low - 22550
Based on price action major support & resistance's are here, the red lines acts as resistances, the green lines acts as supports. If the price breaks the support/resistance, it will move to the next support/resistance line. White lines indicates previous day high & low, high acts as a resistance & low acts as a support for next day.
Trendlines are also significant to price action. If the price is above/below the trendlines, can expect an UP/DOWN with aggressive move.
Please NOTE: this levels are for intraday trading only.
Disclaimer - All information on this page is for educational purposes only,
we are not SEBI Registered, Please consult a SEBI registered financial advisor for your financial matters before investing And taking any decision. We are not responsible for any profit/loss you made.
Request your support and engagement by liking and commenting & follow to provide encouragement
HAPPY TRADING 👍
XAU/USD 02 May 2024 Intraday AnalysisH4 Analysis:
-> Swing: Bearish.
-> Internal: Bearish.
Price has now printed a bearish BOS and iBOS as price needed a pullback from all HTF's
Following the shift in structure we now expect price to pullback. First indication, but not confirmation, of pullback initiation would be for price to print a bearish CHoCH which is denoted with a blue dashed line.
Price is reacting at H4 demand level.
Price remains in pullback phase and is now is discount of internal structure where it is expected the strong low to hold.
As per yesterday's intraday expectation, price was to print bullish CHoCH, reach 50% of internal EQ before targeting weak internal low. Price did print bullish CHOCH and reach 50% EQ.
Intraday expectation : Price to target weak internal low.
H4 Chart:
M15 Analysis:
-> Swing: Bullish.
-> Internal: Bullish.
Price has printed a bullish iBOS.
Price pulled back into 50% EQ but failed to close above weak internal high.
Price has now pulled back into the extreme of the internal low where we are currently seeing a bullish reaction and it is expected for the internal low to hold.
Intraday expectation: Price to target weak internal high.
However, H4 is bearish, therefore, it would not be unrealistic for price to target swing low priced at 2281.680.
M15 Chart :

ICT Short setup / Ranging SOLUSDT👋Hello Traders,
Our 🖥️ AI system detected that there is an ICT Short setup in SOLUSDT for scalping,
Please refer to the details Stop loss, Supply Zone(Sell Zone), TP 1 and TP2 for take profit.
For more ideas, you are welcome to visit our profile in tradingview.
If the price had hit the TP2 when you see this idea, please wait for next idea.
Have a good day!
Please give this post a like if you like this kind of simple idea, your feedback will bring our signal to next better level, thanks for support!

EURUSD 2 May 2024 W18 - Intraday Analysis - EU CPI / US Jobless This is my Intraday analysis on EURUSD for 2 May 2024 W18 based on Smart Money Concept (SMC) which includes the following:
Market Sentiment
4H Chart Analysis
15m Chart Analysis
Market Sentiment
Market sentiment is mixed following the Federal Reserve meeting and Powell's speech. The US dollar initially strengthened after the Fed, but then weakened as investors focused on the central bank's dovish comments. This could be positive for EURUSD, which climbed after the Fed meeting. However, caution is still warranted as Non-Farm Payroll data, a key US jobs report, is due on Friday, which could impact the dollar and EURUSD again.
The following news today will have some volatility before NFP tomorrow:
German Mfg PMI Final
Eurozone Mfg PMI Final
US Trade Balance
US Initial Jobless Claims
4H Chart Analysis
1.
Swing Bearish
Internal Bearish
2.
Swing continuing bearish following the HTF Bearish Trend. Expectations is set for the Swing to stay bearish to fulfill the HTF targets.
3.
As the INT Structure turned Bearish, it signals that the Swig PB maybe over and we are currently Pro Swing.
After the Bearish iBOS we are expecting a PB which already reached the Refined 4H FLIP Zone.
Currently the Liquidity above the 4H Supply which makes it not a HP Zone for Shorts unless we have clear Bearish Structure formation on the 15m.
I Prefer the Sweep of Liq above the 4H Supply (CHoCH) before Shorts.
Also be mindful that the Strong INT High could be run in the situation of a complex Deeper Pullback Phase for the 4H Swing.
With FOMC Yesterday and NFP tomorrow, this is the behavior of price due to Investors positioning.
Note: Daily is ranging and 4H too 🤷♂️
15m Chart Analysis
1.
Swing Bearish
Internal Bearish
Shorts Phase B (HP)
Longs Phase C (LP)
2.
With the volatility of yesterday news, price reached the Bearish Swing Extreme.
No clear direction as we are back again to the same range we are in since Apr 23.
Shorts make sense, but no potential POI / Clear INT Structure to follow.
Also with the 4H Liquidity above the 15m Swing High, there is a HP that the 15m Swing will get run.
3.
After the Bearish BOS we expected a Pullback, which was initiated after the Bullish iBOS.

BANK NIFTY INTRADAY LEVELS FOR 02/05/2024BUY ABOVE - 49480
SL - 49250
TARGETS - 49670,49850,50000
SELL BELOW - 49250
SL - 49480
TARGETS - 49020,48800,48630
NO TRADE ZONE - 49250 to 49480
Previous Day High - 50000
Previous Day Low - 49250
Based on price action major support & resistance's are here, the red lines acts as resistances, the green lines acts as supports. If the price breaks the support/resistance, it will move to the next support/resistance line. White lines indicates previous day high & low, high acts as a resistance & low acts as a support for next day.
Trendlines are also significant to price action. If the price is above/below the trendlines, can expect an UP/DOWN with aggressive move.
Please NOTE: this levels are for intraday trading only.
Disclaimer - All information on this page is for educational purposes only,
we are not SEBI Registered, Please consult a SEBI registered financial advisor for your financial matters before investing And taking any decision. We are not responsible for any profit/loss you made.
Request your support and engagement by liking and commenting & follow to provide encouragement
HAPPY TRADING 👍

NIFTY INTRADAY LEVELS FOR 02/05/2024BUY ABOVE - 22600
SL - 22550
TARGETS - 22660,22710,22780
SELL BELOW - 22550
SL - 22600
TARGETS - 22510,22470,22430
NO TRADE ZONE - 22550 to 22600
Previous Day High - 22780
Previous Day Low - 22550
Based on price action major support & resistance's are here, the red lines acts as resistances, the green lines acts as supports. If the price breaks the support/resistance, it will move to the next support/resistance line. White lines indicates previous day high & low, high acts as a resistance & low acts as a support for next day.
Trendlines are also significant to price action. If the price is above/below the trendlines, can expect an UP/DOWN with aggressive move.
Please NOTE: this levels are for intraday trading only.
Disclaimer - All information on this page is for educational purposes only,
we are not SEBI Registered, Please consult a SEBI registered financial advisor for your financial matters before investing And taking any decision. We are not responsible for any profit/loss you made.
Request your support and engagement by liking and commenting & follow to provide encouragement
HAPPY TRADING 👍

EURUSD 1 May 2024 W18 - Intraday Analysis - US FOMC/Powell Day!This is my Intraday analysis on EURUSD for 1 May 2024 W18 based on Smart Money Concept (SMC) which includes the following:
Market Sentiment
4H Chart Analysis
15m Chart Analysis
Market Sentiment
A day the markets awaits loaded with high impact news events. Starting with US ADP, Manufacturing PMI, JOLTS Job Openings and ending with Rate Decision and Powell speech.
Today's FOMC Statement and Federal Reserve Chair Jerome Powell's speech are eagerly anticipated by the market, as both have the potential to significantly influence the EUR/USD pair. The Dollar Index has advanced as investor focus shifts to these pivotal events. Should the FOMC statement or Powell's comments lean towards a more hawkish stance, indicating a preference for higher interest rates, it could bolster the US dollar and exert downward pressure on the EUR/USD pair. Conversely, if the statement or remarks lean towards a more dovish stance, suggesting a inclination towards lower interest rates, it could weaken the US dollar and generate some upward movement for the EUR/USD pair.
4H Chart Analysis
1.
Swing Bearish
Internal Bearish
2.
Swing continuing bearish following the HTF Bearish Trend. Expectations is set for the Swing to stay bearish to fulfill the HTF targets.
3.
No clear Demand zone available to initiate the INT Structure Pullback.
Price could continue bearish without Pullback as we are in the Swing Continuation Phase.
Expectation is set to continue bearish targeting the Weak Swing Low.
4.
With the recent INT Structure turning Bearish confirming the Swing Pullback Phase may had ended, the Swing Bearish Continuation Phase started targeting the Weak Swing Low.
Current 4H Supply (FLIP Zone) could provide an opportunity for Shorts after the Bearish iBOS inline with the Bearish Swing and Continuation Phase.
Also be mindful that today is loaded with high impact news which will have a high volatility.
15m Chart Analysis
1.
Swing Bearish
OF Bearish
2.
Swing continuing Bearish with Bearish BOS.
After a BOS we expect a pullback.
There is no HTF Zone that can be potential for the Swing Pullback Phase.
Will wait for INT Structure to turn Bullish to look for Longs. Otherwise i prefer Shorts from the 4H Supply as it aligns with the HTF Bearish Phase and targets.
3.
No Clear Demand to initiate the Swing Pullback.
Waiting for INT Structure formation.

$SPY trend rejection/EMA cross/MACD rejectionNot looking great as we head into #FED and NASDAQ:AAPL earnings to close out this week. The weekly 21 EMA is 494ish. If 500 breaks then that would be next level of support to watch.

Same Trade in Nifty Future As Yesterday-30th April ’24Below mentioned points are discussed in my post analysis video(Fast forward to 0:40 for Hindi Audio)
-No Trades in the morning
-Poor Volumes before 10
-Same Trade in Nifty Future As Yesterday;Green Close
-How will i trade when market opens tom
