Day Trader Trading Nifty Futures & Options-22nd Mar ’24 Below mentioned points are discussed in my post analysis video(Fast forward to 0:42 for Hindi Audio)
-No Trades in the morning
-Sell Volumes in nifty before 10
-Buy Nifty Future After 12 was the Volume Trade
-How will i trade when market opens tom
Intraday

EURUSD 21 Mar 2024 W12 - Intraday Analysis - EU PMI/US PMIThis is my Intraday analysis on EURUSD for 21 Mar 2024 W12 based on Smart Money Concept (SMC) which includes the following Time Frames:
4H
15m
4H Chart Analysis
1.
Swing Bearish
INT Bullish
Swing Pullback Phase
2.
After a BOS and iBOS we expect a Pullback.
As expected after the Bullish CHoCH and mitigation of 4H/Daily Demand zones, we initiated the INT Structure Pullback.
Price reached the 4H/Daily Supply and from there we could start the bearish continuation.
Price failed to continue the bearish move and as expected it changed bullish and created iBOS confirming Swing Low and Bearish Swing Pullback Phase started.
3.
4H Swing pullback phase still active with Internal Structure continuing bullish with a new iBOS.
After iBOS we expect a pullback. Price had reached the INT Structure Demand zone and created a Bullish CHoCH which indicates that the INT Pullback maybe over and we are currently targeting the Weak INT High. after which price failed to target the Weak INT High.
Current price indicate that we will have a deep 4H INT Pullback to maybe the 4H/Daily Demand zones before any continuation.
4.
As expected, Price reached the Daily demand zone as refereed to the deep INT Structure Pullback.
We have now the 2 scenarios; if price will continue up targeting the Weak INT High we will respect the Strong Low.
If price breaking the Strong INT Low, then the Daily view in play and we will target the 4H/Daily Weak Swing Low.
15m Chart Analysis
1.
Swing Bullish
Swing Pullback Phase / Discount
2.
With FOMC news, price created a bullish BOS.
After the BOS we expect a pullback and currently price reached the Swing EQ and Discount zone.
3.
Last HP POI on 15m/4H for price to continue the bullish Swing.
Longs makes sense from these POIs but with currently reversal of yesterday news, there is a HP that price will take out the Strong Swing Low to continue the 4H/Daily bearish structures.

XAU/USD 21 March 2024 Intraday AnalysisH4 Analysis:
-> Swing: Bullish.
-> Internal: Bullish.
Gold continues it's bullish run following the Fed's dovish outlook on interest rates.
Price has printed an iBOS where we are currently trading within a fractal high and internal low.
Relative to recent price action of the swing range, I have readjusted bullish BOS to bullish iBOS.
Intraday expectation would be for price to show signs of pullback initiation, which have yet to occur, or, price could react at 50% EQ before continuing bullish to create new highs.
Another potential scenario would be for price to continue bullish from current price, create a new high which would bring the CHoCH closer to very most recent price action allowing Gold to pullback without the need to pullback so deep as current CHoCH location which is denoted in blue dotted line slightly above the internal low, is a significant distance away from current price.
H4 Chart:
M15 Analysis:
-> Swing: Bullish.
-> Internal: Bullish.
Price has printed a bullish iBOS followed by bullish BOS following the Fed's dovish outlook on interest rates yesterday.
Price is currently trading within a fractal high and low.
Intraday expectation would be for price to indicate initiation of pullback by printing a bearish CHoCH which is denoted with blue dotted lines.
Alternatively, and much like H4, price could continue bullish to create new highs in order to bring CHOCH closer to the very most recent price action. This would Gold to initiate first structural signs of pullback without the need to significantly pull back.
M15 Chart:

Day Trader Trading Nifty Futures & Options-21st Mar ’24Below mentioned points are discussed in my post analysis video(Fast forward to 0:34 for Hindi Audio)
-No Trades in the morning
-No Volumes in nifty
-Bought Nifty Future around 22120 With Sl as Vwap.
-How will i trade when market opens tom

Broadening wedge pattern breakout in OBEROIRLTYOBEROI RELTY LTD
Key highlights: 💡⚡
✅On 1 Hour Time Frame Stock Showing Breakout of Broadening Wedge Pattern.
✅Strong Bullish Candlestick Form on this timeframe.
✅It can give movement up to the Breakout target of 1489+.
✅Can Go Long in this Stock by placing a stop loss below 1371-.

EURUSD 20 Mar 2024 W12 - Intraday Analysis - FOMC / Powell Day!This is my Intraday analysis on EURUSD for 20 Mar 2024 W12 based on Smart Money Concept (SMC) which includes the following Time Frames:
4H
15m
4H Chart Analysis
1.
Swing Bearish
INT Bullish
Swing Pullback Phase
2.
After a BOS and iBOS we expect a Pullback.
As expected after the Bullish CHoCH and mitigation of 4H/Daily Demand zones, we initiated the INT Structure Pullback.
Price reached the 4H/Daily Supply and from there we could start the bearish continuation.
Price failed to continue the bearish move and as expected it changed bullish and created iBOS confirming Swing Low and Bearish Swing Pullback Phase started.
3.
4H Swing pullback phase still active with Internal Structure continuing bullish with a new iBOS.
After iBOS we expect a pullback. Price had reached the INT Structure Demand zone and created a Bullish CHoCH which indicates that the INT Pullback maybe over and we are currently targeting the Weak INT High. after which price failed to target the Weak INT High.
Current price indicate that we will have a deep 4H INT Pullback to maybe the 4H/Daily Demand zones before any continuation.
4.
As expected, Price reached the Daily demand zone as refereed to the deep INT Structure Pullback.
We have now the 2 scenarios; if price will continue up targeting the Weak INT High we will respect the Strong Low.
If price breaking the Strong INT Low, then the Daily view in play and we will target the 4H/Daily Weak Swing Low.
15m Chart Analysis
1.
Swing Bearish
Swing Continuation
2.
Price reached the 4H Supply and initiated the Bearish Swing Continuation Phase after the Bearish CHoCH.
3.
After the Swing BOS, the pullback phase initiated after the Bullish CHoCH.

XAU/USD 20 March 2024 Intraday AnalysisH4 Analysis:
Bias/Analysis remains the same as yesterday's Analysis dated 19/03/2024
-> Swing: Bullish.
-> Internal: Bearish.
Price had printed a swing BOS and subsequently a bullish iBOS.
Swing range confirmed.
Price has now printed a bearish iBOS to confirm swing pullback has initiated.
Scenario 2 played out from previous analysis whereby it was mentioned price could target internal low as all HTF's are requiring a pullback.
Yesterday's Intraday expectation was for price to continue bullish, react at either 50% EQ or H4 POI before targeting weak internal low.
Price attempted to do this but failed which possibly indicates the need for more liquidity.
Intraday expectation is for price to retrace to 50% EQ of the internal structure or H4 POI before once again targeting weak internal low.
H4 Chart:
M15 Analysis:
-> Swing: Bullish.
-> Internal: Bearish.
Price has now printed a further bearish iBOS which confirms comments made on 12 March 2024 that it would be useful to remember that all HTF's are requiring a pullback.
Pullback following bearish iBOS is underway .
Yesterday's Intraday expectation was for price to react at M15 POI, or 50% EQ (denoted in blue) before targeting weak internal low. Price did as expected.
However, price was unable to break and close below weak internal low which indicates that bearish pullback following bullish iBOS on M15 TF and bearish pullback for H4 TF remains underway.
Price has been moving sideways in a narrow range which could indicate that we await to see results of high impact incoming data before higher volatility moves are made.
Intraday expectation remains the same as yesterday, for price to target weak internal low.
M15 Chart:

Intraday Trading Nifty Futures & Options-20th Mar ’24 Below mentioned points are discussed in my post analysis video(Fast forward to 0:25 for Hindi Audio)
-No Trades in the morning
-No Volumes in Nifty
-Selling Nifty Once Prev Day Low Breaks Was the Plan!
-How will i trade when market opens tom

simple trendline gold price are going sideway correction above 2150 support but below white trend line
before big news fed fomc

EURUSD 19 Mar 2024 W12 - Intraday Analysis - EU ZEW / US HousingThis is my Intraday analysis on EURUSD for 19 Mar 2024 W12 based on Smart Money Concept (SMC) which includes the following Time Frames:
4H
15m
4H Chart Analysis
1.
Swing Bearish
INT Bullish
Swing Pullback Phase
2.
After a BOS and iBOS we expect a Pullback.
As expected after the Bullish CHoCH and mitigation of 4H/Daily Demand zones, we initiated the INT Structure Pullback.
Price reached the 4H/Daily Supply and from there we could start the bearish continuation.
Price failed to continue the bearish move and as expected it changed bullish and created iBOS confirming Swing Low and Bearish Swing Pullback Phase started.
3.
4H Swing pullback phase still active with Internal Structure continuing bullish with a new iBOS.
After iBOS we expect a pullback. Price had reached the INT Structure Demand zone and created a Bullish CHoCH which indicates that the INT Pullback maybe over and we are currently targeting the Weak INT High. after which price failed to target the Weak INT High.
Current price indicate that we will have a deep 4H INT Pullback to maybe the 4H/Daily Demand zones before any continuation.
4.
As expected, Price reached the Daily demand zone as refereed to the deep INT Structure Pullback.
We have now the 2 scenarios; if price will continue up targeting the Weak INT High we will respect the Strong Low.
If price breaking the Strong INT Low, then the Daily view in play and we will target the 4H/Daily Weak Swing Low.
15m Chart Analysis
1.
Swing Bearish
Swing Pullback Phase
2.
15m / 4H Supply Zones for possible shorts once reached. But be mindful that the 4H CHoCH is currently the 15m Swing High and there is a HP we will take it after mitigating the Daily Demand zone.
3.
After the Swing BOS, the pullback phase initiated after the Bullish CHoCH.

XAU/USD 19 March 2024 Intraday AnalysisH4 Analysis:
-> Swing: Bullish.
-> Internal: Bearish.
Price had printed a swing BOS and subsequently a bullish iBOS.
Swing range confirmed.
Price has now printed a bearish iBOS to confirm swing pullback has initiated.
Scenario 2 played out from previous analysis whereby it was mentioned price could target internal low as all HTF's are requiring a pullback.
Yesterday's Intraday expectation was for price to continue bullish, react at either 50% EQ or H4 POI before targeting weak internal low.
Price attempted to do this but failed which possibly indicates the need for more liquidity.
Intraday expectation is for price to retrace to 50% EQ of the internal structure or H4 POI before once again targeting weak internal low.
H4 Chart:
M15 Analysis:
-> Swing: Bullish.
-> Internal: Bearish.
Price has now printed a further bearish iBOS which confirms comments made on 12 March 2024 that it would be useful to remember that all HTF's are requiring a pullback.
Pullback following bearish iBOS is underway .
Yesterday's Intraday expectation was for price to react at M15 POI, or 50% EQ (denoted in blue) before targeting weak internal low. Price did as expected.
However, price was unable to break and close below weak internal low which indicates that bearish pullback following bullish iBOS on M15 TF and bearish pullback for H4 TF remains underway.
Intraday expectation is for price to react at 50% EQ of the internal structure (denoted in blue) and once again target weak internal low.
Price could potentially go deeper into premium EQ of the internal structure, react at H4 POI before targeting weak internal low.
M15 Chart:

Intraday Trading Nifty Futures & Options-19th Mar ’24Below mentioned points are discussed in my post analysis video(Fast forward to 0:50 for Hindi Audio)
-No Trades in the morning
-Nifty had sell volumes in the morning
-Scalped Nifty After 12 once Nifty Spot Broke IB Range
-How will i trade when market opens tom

EURUSD 18 Mar 2024 W12 - Intraday Analysis - EU CPIThis is my Intraday analysis on EURUSD for 18 Mar 2024 W12 based on Smart Money Concept (SMC) which includes the following Time Frames:
4H
15m
4H Chart Analysis
1.
Swing Bearish
INT Bullish / Continuation Phase
Swing Pullback Phase
2.
After a BOS and iBOS we expect a Pullback.
As expected after the Bullish CHoCH and mitigation of 4H/Daily Demand zones, we initiated the INT Structure Pullback.
Price reached the 4H/Daily Supply and from there we could start the bearish continuation.
Price failed to continue the bearish move and as expected it changed bullish and created iBOS confirming Swing Low and Bearish Swing Pullback Phase started.
3.
4H Swing pullback phase still active with Internal Structure continuing bullish with a new iBOS.
After iBOS we expect a pullback. Price had reached the INT Structure Demand zone and created a Bullish CHoCH which indicates that the INT Pullback maybe over and we are currently targeting the Weak INT High. after which price failed to target the Weak INT High.
Current price indicate that we will have a deep 4H INT Pullback to maybe the 4H/Daily Demand zones before any continuation.
15m Chart Analysis
1.
Swing Bearish
INT Bullish
Swing Pullback Phase
2.
15m Swing turned which indicates that the 4H Internal Structure pullback is not over yet.
After a BOS we expect a pullback. Price didn't reach any HTF POI to initiate the pullback yet.
3.
After the Swing BOS, the pullback phase initiated after the Bullish iBOS.
Expectations is set for price to continue Bullish to Swing EQ / HP POI within the Swing Premium.
Bearish iBOS will confirm the Swing Pullback is over and there is a HP of targeting the Weak Swing Low. (Also it will reflect on the 4H to create a new low and new closer CHoCH instead of the current high one)

XAU/USD 08 March 2024 Intraday AnalysisH4 Analysis:
-> Swing: Bullish.
-> Internal: Bearish.
Price had printed a swing BOS and subsequently a bullish iBOS.
Swing range confirmed.
Price has now printed a bearish iBOS to confirm swing pullback has initiated and is underway.
Scenario 2 played out from previous analysis whereby it was mentioned price could target internal low as all HTF's are requiring a pullback.
Intraday expectation is for price to continue bullish, react at either 50% EQ or H4 POI before targeting weak internal low.
H4 Chart:
M15 Analysis:
-> Swing: Bullish.
-> Internal: Bearish.
Price has now printed a further bearish iBOS which confirms comments made on 12 March 2024 that it would be useful to remember that all HTF's are requiring a pullback.
Pullback following bearish is underway .
Intraday expectation is for price to react at M15 POI, or 50% EQ before targeting weak internal low.
M15 Chart:

BANK NIFTY INTRADAY LEVELS FOR 18/03/2024BUY ABOVE - 46690
SL - 46560
TARGETS - 46870,47050,47200
SELL BELOW - 46450
SL - 46560
TARGETS - 46300,46100,45930
NO TRADE ZONE - 46450 to 46690
Previous Day High - 46690
Previous Day Low - 46300
Based on price action major support & resistance's are here, the red lines acts as resistances, the green lines acts as supports. If the price breaks the support/resistance, it will move to the next support/resistance line. White lines indicates previous day high & low, high acts as a resistance & low acts as a support for next day.
Trendlines are also significant to price action. If the price is above/below the trendlines, can expect an UP/DOWN with aggressive move.
Please NOTE: this levels are for intraday trading only.
Disclaimer - All information on this page is for educational purposes only,
we are not SEBI Registered, Please consult a SEBI registered financial advisor for your financial matters before investing And taking any decision. We are not responsible for any profit/loss you made.
Request your support and engagement by liking and commenting & follow to provide encouragement
HAPPY TRADING 👍

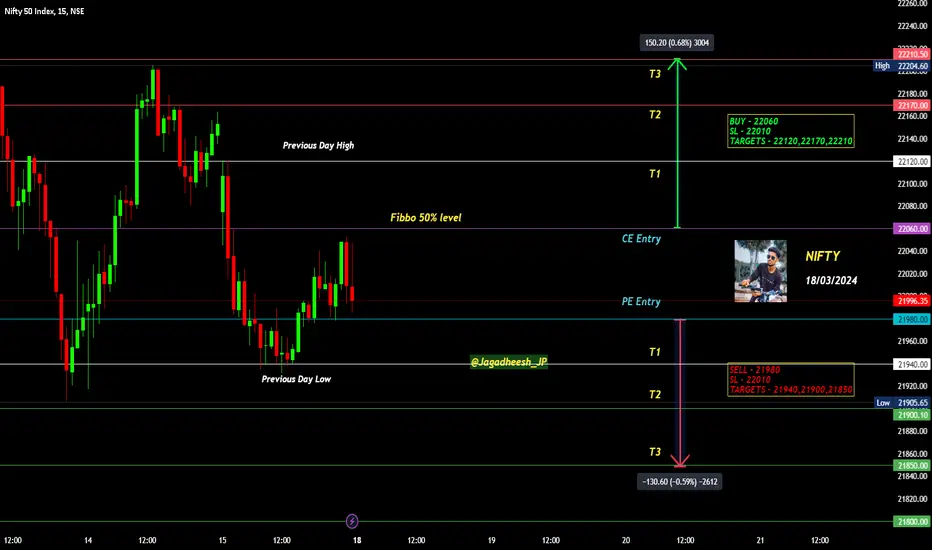
NIFTY INTRADAY LEVELS FOR 18/03/2024BUY ABOVE - 22060
SL - 22010
TARGETS - 22120,22170,22210
SELL BELOW - 21980
SL - 22010
TARGETS - 21940,21900,21850
NO TRADE ZONE - 21980 to 22060
Previous Day High - 22120
Previous Day Low - 21940
Based on price action major support & resistance's are here, the red lines acts as resistances, the green lines acts as supports. If the price breaks the support/resistance, it will move to the next support/resistance line. White lines indicates previous day high & low, high acts as a resistance & low acts as a support for next day.
Trendlines are also significant to price action. If the price is above/below the trendlines, can expect an UP/DOWN with aggressive move.
Please NOTE: this levels are for intraday trading only.
Disclaimer - All information on this page is for educational purposes only,
we are not SEBI Registered, Please consult a SEBI registered financial advisor for your financial matters before investing And taking any decision. We are not responsible for any profit/loss you made.
Request your support and engagement by liking and commenting & follow to provide encouragement
HAPPY TRADING 👍
S&P 500 INTRADAY LEVELS FOR 18/03/2024BUY ABOVE - 5124
SL - 5113
TARGETS - 5131,5140,5150
SELL BELOW - 5113
SL - 5124
TARGETS - 5104,5091,5083
NO TRADE ZONE - 5113 to 5124
Previous Day High - 5131
Previous Day Low - 5104
Based on price action major support & resistance's are here, the red lines acts as resistances, the green lines acts as supports. If the price breaks the support/resistance, it will move to the next support/resistance line. White lines indicates previous day high & low, high acts as a resistance & low acts as a support for next day.
Trendlines are also significant to price action. If the price is above/below the trendlines, can expect an UP/DOWN with aggressive move.
Please NOTE: this levels are for intraday trading only.
Disclaimer - All information on this page is for educational purposes only,
we are not SEBI Registered, Please consult a SEBI registered financial advisor for your financial matters before investing And taking any decision. We are not responsible for any profit/loss you made.
Request your support and engagement by liking and commenting & follow to provide encouragement
HAPPY TRADING 👍

EURUSD 15 Mar 2024 W11 - Intraday Analysis - US Ind. ProductionThis is my Intraday analysis on EURUSD for 15 Mar 2024 W11 based on Smart Money Concept (SMC) which includes the following Time Frames:
4H
15m
4H Chart Analysis
1.
Swing Bearish
INT Bullish / Continuation Phase
Swing Pullback Phase
2.
After a BOS and iBOS we expect a Pullback.
As expected after the Bullish CHoCH and mitigation of 4H/Daily Demand zones, we initiated the INT Structure Pullback.
Price reached the 4H/Daily Supply and from there we could start the bearish continuation.
Price failed to continue the bearish move and as expected it changed bullish and created iBOS confirming Swing Low and Bearish Swing Pullback Phase started.
3.
4H Swing pullback phase still active with Internal Structure continuing bullish with a new iBOS.
After iBOS we expect a pullback. Price had reached the INT Structure Demand zone and created a Bullish CHoCH which indicates that the INT Pullback maybe over and we are currently targeting the Weak INT High. after which price failed to target the Weak INT High.
Current price indicate that we will have a deep 4H INT Pullback to maybe the 4H/Daily Demand zones before any continuation.
15m Chart Analysis
1.
Swing Bearish
INT Bullish
Swing Pullback Phase
2.
15m Swing turned which indicates that the 4H Internal Structure pullback is not over yet.
After a BOS we expect a pullback. Price didn't reach any HTF POI to initiate the pullback yet.
3.
After the Swing BOS, the pullback phase initiated after the Bullish iBOS.
Expectations is set for price to continue Bullish to Swing EQ / HP POI within the Swing Premium.

BANK NIFTY INTRADAY LEVELS FOR 15/03/2024BUY ABOVE - 46870
SL - 46690
TARGETS - 47050,47200,47350
SELL BELOW - 46690
SL - 46870
TARGETS - 46450,46300,46100
NO TRADE ZONE - 46690 to 46870
Previous Day High - 47200
Previous Day Low - 46560
Based on price action major support & resistance's are here, the red lines acts as resistances, the green lines acts as supports. If the price breaks the support/resistance, it will move to the next support/resistance line. White lines indicates previous day high & low, high acts as a resistance & low acts as a support for next day.
Trendlines are also significant to price action. If the price is above/below the trendlines, can expect an UP/DOWN with aggressive move.
Please NOTE: this levels are for intraday trading only.
Disclaimer - All information on this page is for educational purposes only,
we are not SEBI Registered, Please consult a SEBI registered financial advisor for your financial matters before investing And taking any decision. We are not responsible for any profit/loss you made.
Request your support and engagement by liking and commenting & follow to provide encouragement
HAPPY TRADING 👍

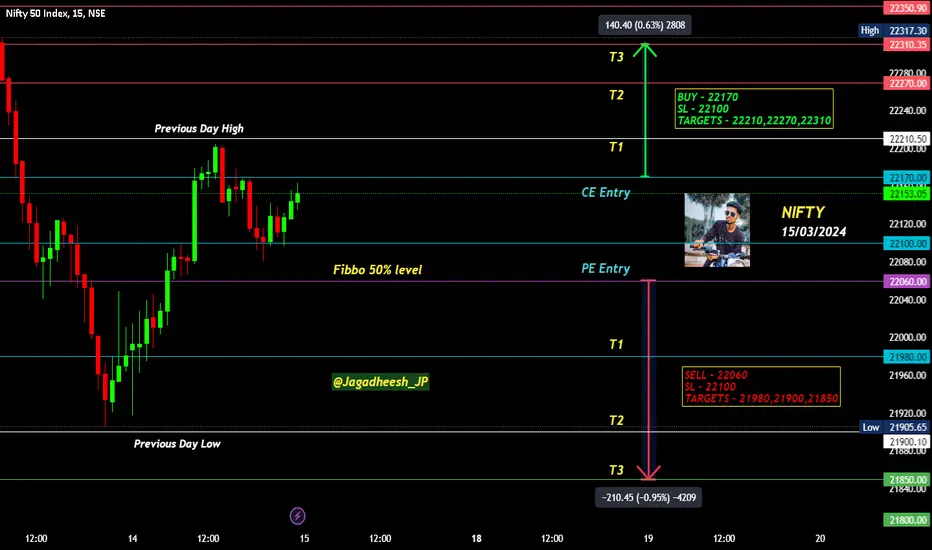
NIFTY INTRADAY LEVELS FOR 15/03/2024BUY ABOVE - 22170
SL - 22100
TARGETS - 22210,22270,22310
SELL BELOW - 22060
SL - 22100
TARGETS - 21980,21900,21850
NO TRADE ZONE - 22060 to 22170
Previous Day High - 22210
Previous Day Low - 21900
Based on price action major support & resistance's are here, the red lines acts as resistances, the green lines acts as supports. If the price breaks the support/resistance, it will move to the next support/resistance line. White lines indicates previous day high & low, high acts as a resistance & low acts as a support for next day.
Trendlines are also significant to price action. If the price is above/below the trendlines, can expect an UP/DOWN with aggressive move.
Please NOTE: this levels are for intraday trading only.
Disclaimer - All information on this page is for educational purposes only,
we are not SEBI Registered, Please consult a SEBI registered financial advisor for your financial matters before investing And taking any decision. We are not responsible for any profit/loss you made.
Request your support and engagement by liking and commenting & follow to provide encouragement
HAPPY TRADING 👍
S&P 500 INTRADAY LEVELS FOR 15/03/2024BUY ABOVE - 5160
SL - 5150
TARGETS - 5170,5178,5188
SELL BELOW - 5140
SL - 5150
TARGETS - 5120,5109,5100
NO TRADE ZONE - 5140 to 5160
Previous Day High - 5178
Previous Day Low - 5122
Based on price action major support & resistance's are here, the red lines acts as resistances, the green lines acts as supports. If the price breaks the support/resistance, it will move to the next support/resistance line. White lines indicates previous day high & low, high acts as a resistance & low acts as a support for next day.
Trendlines are also significant to price action. If the price is above/below the trendlines, can expect an UP/DOWN with aggressive move.
Please NOTE: this levels are for intraday trading only.
Disclaimer - All information on this page is for educational purposes only,
we are not SEBI Registered, Please consult a SEBI registered financial advisor for your financial matters before investing And taking any decision. We are not responsible for any profit/loss you made.
Request your support and engagement by liking and commenting & follow to provide encouragement
HAPPY TRADING 👍

EURUSD 14 Mar 2024 W11 - Intraday Analysis - US PPIThis is my Intraday analysis on EURUSD for 14 Mar 2024 W11 based on Smart Money Concept (SMC) which includes the following Time Frames:
4H
15m
4H Chart Analysis
1.
Swing Bearish
INT Bullish / Continuation Phase
Swing Pullback Phase
2.
After a BOS and iBOS we expect a Pullback.
As expected after the Bullish CHoCH and mitigation of 4H/Daily Demand zones, we initiated the INT Structure Pullback.
Price reached the 4H/Daily Supply and from there we could start the bearish continuation.
Price failed to continue the bearish move and as expected it changed bullish and created iBOS confirming Swing Low and Bearish Swing Pullback Phase started.
3.
4H Swing pullback phase still active with Internal Structure continuing bullish with a new iBOS.
After iBOS we expect a pullback. Price had reached the INT Structure Demand zone and created a Bullish CHoCH which indicates that the INT Pullback maybe over and we are currently targeting the Weak INT High. after which price failed to target the Weak INT High.
Current price indicate that we will have a deep 4H INT Pullback to maybe the 4H/Daily Demand zones before any continuation.
15m Chart Analysis
1.
Swing Bearish
INT Bearish
Swing Pullback Phase
2.
15m Swing turned which indicates that the 4H Internal Structure pullback is not over yet.
After a BOS we expect a pullback. Price didn't reach any HTF POI to initiate the pullback yet.
3.
Price tapped into a previous 15m demand within a previous 4H demand that was partially mitigated.
15m Swing pullback could start at anytime but no yet confirmation as minimum as a bullish CHoCH.

XAU/USD 14 March 2024 Intraday AnalysisH4 Analysis:
Analysis/bias remains unchanged from yesterday's 13/03/2024) analysis
-> Swing: Bullish.
-> Internal: Bullish.
Price printed a swing BOS and subsequently a bullish iBOS.
Bearish CHoCH has been printed.
We are now trading within an internal range.
As mentioned 11/03/2024, bearish CHoCH, which is the first structural indication, but not confirmation that bearish pullback is underway, will indicate pullback initiation has now been printed.
Bearish iBOS will provide confirmation that pullback is underway.
Due to the bullish nature of the market, Intraday expectation is for price to target internal high, however, all HTF's are indicating the need for a pullback, therefore, a second potential scenario could be price targeting internal low to confirm pullback is now underway.
H4 Chart:
M15 Analysis:
Analysis/bias remains unchanged from yesterday's 13/03/2024) analysis
-> Swing: Bullish.
-> Internal: Bearish.
Price has now printed a bearish iBOS which confirms my comments yesterday (12/03/2024) that it would be useful to remember that all HTF's are requiring a pullback.
Intraday expectation is for price to continue bullish, react at M15 POI or 50% EQ before targeting weak internal low.
M15 Chart:
