[INTRADAY] #BANKNIFTY PE & CE Levels(02/03/2024) Today will be gap up opening in BANKNIFTY. After opening if banknifty sustain above 47050 level then possible upside rally of 400-500 points upto 47450 level & this rally can extend another 400 points if market gives breakout 47550 level in todays session.Any Major downside only expected in case banknifty starts trading below 46950 level.
Intraday

#NIFTY Intraday Support and Resistance Levels -02/03/2024Nifty will be gap up opening in today's session. After opening nifty sustain above 22350 level and then possible upside rally up to 22470 level in today's session. in case nifty trades below 22310 level then the downside target can go up to the 22190 level.

XAU/USD 01 March 2024 Intraday AnalysisH4 Analysis:
Expectation remains the same as per analysis yesterday (29/02/2024)
-> Swing: Bullish.
-> Internal: Bearish.
-> Sub-Internal: Bullish.
-> Has reached EQ.
I have marked sub-internal in red due to the significant range of the internal structure.
Price has printed a bullish sub-internal iiBOS. which indicates that we are still in the pullback phase of the internal structure.
Price indicates that we are still in the bullish pullback phase of the bearish iBOS
Current expectation is for price to react at H4 POI before targeting weak internal low.
First sign of completion of pullback would be bearish CHoCH which is marked by a red dotted line.
H4 Chart:
M15 Analysis:
-> Swing: Bullish.
-> Internal: Bullish.
-> Has reached EQ.
Price has printed another bullish iBOS. Internal range established.
Bearish CHoCH indicates that bearish pullback could be underway.
Intraday expectation is for price to continue bearish, react at M15 POI before price continuing bullish to target weak internal high.
M15 Chart:

EURUSD 1 Mar 2024 W9 - Intraday Analysis - EU PMI/CPI - US PMIThis is my Intraday analysis on EURUSD for 1 Mar 2024 W9 based on Smart Money Concept (SMC) which includes the following Time Frames:
4H
15m
NOTE: Nothing changed again from yesterday, 4H no changes and 15m just within the INT to INT Structure.
4H Chart Analysis
1.
Swing Bearish
INT Bullish
Swing Pullback Phase
2.
After a BOS and iBOS we expect a Pullback.
As expected after the Bullish CHoCH and mitigation of 4H/Daily Demand zones, we initiated the INT Structure Pullback.
Price reached the 4H/Daily Supply and from there we could start the bearish continuation.
Price failed to continue the bearish move and as expected it changed bullish and created iBOS confirming Swing Low and Bearish Swing Pullback Phase started.
3.
After Bullish iBOS confirming Swing Pullback Phase started, We are expecting INT Pullback.
Price reached the 4H Supply as expected and showed solid reaction from there. This reaction is starting the Bullish INT Structure Pullback.
We didn't do a Bearish CHoCH to confirm INT High yet. So, there is a probability that price could tap into the CHoCH.
Also we tapped into a Daily Demand (Not a HP zone) which is currently containing price.
As the 4H Swing is bearish, the Swing pullback could be done after reaching the 4H Supply, Bearish CHoCH will be the initial weak conformation and a Bearish iBOS will be the solid confirmation for that scenario.
Other scenario is a deeper Swing Pullback and 4H INT will stay Bullish to facilitate that view.
15m Chart Analysis
1.
Swing Bullish
INT Bullish
INT INT Bearish
INT Continuation Phase
2.
Swing turned bullish to facilitate the 4H Swing Pullback.
After BOS we expect a pullback. Price reached the 4H Supply as expected and from there started the 15m INT Structure Pullback.
With the ranging behavior of price we created INT to INT Structure which turned bearish and currently challenging to maybe targeting the INT Structure Pullback low (ii Low @ 1.0803).
Price is currently bearish within the Bullish INT/Swing structure. Expectations was set to target the INT to INT Structure and we did that yesterday.
With the current price behavior, i'm expecting price to challenge the INT Structure Low which will confirm 15m Swing High and possible continuation bearish to continue the 4H Bearish INT Structure.

Head & Shoulder pattern breakout in BANKNIFTYBANKNIFTY INDEX
Key highlights: 💡⚡
✅On 15 MIN Time Frame Banknifty index Showing Breakout of Head & Shoulder Pattern.
✅Strong Bullish Candlestick Form on this timeframe.
✅It can give movement up to the Breakout target of 46850+.
✅Can Go Long in this Banknifty index by placing a stop loss below 46100-.

BANK NIFTY INTRADAY LEVELS FOR 01/03/2024BUY ABOVE - 46300
SL - 46100
TARGETS - 46450,46560,46750
SELL BELOW - 45930
SL - 46100
TARGETS - 45730,45570,45330
NO TRADE ZONE - 45930 to 46300
Previous Day High - 46300
Previous Day Low - 45730
Based on price action major support & resistance's are here, the red lines acts as resistances, the green lines acts as supports. If the price breaks the support/resistance, it will move to the next support/resistance line. White lines indicates previous day high & low, high acts as a resistance & low acts as a support for next day.
Trendlines are also significant to price action. If the price is above/below the trendlines, can expect an UP/DOWN with aggressive move.
Please NOTE: this levels are for intraday trading only.
Disclaimer - All information on this page is for educational purposes only,
we are not SEBI Registered, Please consult a SEBI registered financial advisor for your financial matters before investing And taking any decision. We are not responsible for any profit/loss you made.
Request your support and engagement by liking and commenting & follow to provide encouragement
HAPPY TRADING 👍

NIFTY INTRADAY LEVELS FOR 01/03/2024BUY ABOVE - 22060
SL - 22020
TARGETS -22120,22170,22230
SELL BELOW - 22940
SL - 21990
TARGETS - 21890,21850,21800
NO TRADE ZONE - 21940 to 22060
Previous Day High - 22060
Previous Day Low - 21850
Based on price action major support & resistance's are here, the red lines acts as resistances, the green lines acts as supports. If the price breaks the support/resistance, it will move to the next support/resistance line. White lines indicates previous day high & low, high acts as a resistance & low acts as a support for next day.
Trendlines are also significant to price action. If the price is above/below the trendlines, can expect an UP/DOWN with aggressive move.
Please NOTE: this levels are for intraday trading only.
Disclaimer - All information on this page is for educational purposes only,
we are not SEBI Registered, Please consult a SEBI registered financial advisor for your financial matters before investing And taking any decision. We are not responsible for any profit/loss you made.
Request your support and engagement by liking and commenting & follow to provide encouragement
HAPPY TRADING 👍

S&P 500 INTRADAY LEVELS FOR 01/03/2024BUY ABOVE - 5100
SL - 5094
TARGETS - 5110,5120,5135
SELL BELOW - 5088
SL - 5094
TARGETS - 5081,5076,5070
NO TRADE ZONE - 5088 to 5100
Previous Day High - 5100
Previous Day Low - 5062
Based on price action major support & resistance's are here, the red lines acts as resistances, the green lines acts as supports. If the price breaks the support/resistance, it will move to the next support/resistance line. White lines indicates previous day high & low, high acts as a resistance & low acts as a support for next day.
Trendlines are also significant to price action. If the price is above/below the trendlines, can expect an UP/DOWN with aggressive move.
Please NOTE: this levels are for intraday trading only.
Disclaimer - All information on this page is for educational purposes only,
we are not SEBI Registered, Please consult a SEBI registered financial advisor for your financial matters before investing And taking any decision. We are not responsible for any profit/loss you made.
Request your support and engagement by liking and commenting & follow to provide encouragement
HAPPY TRADING 👍

XAU/USD 29 Feb 2024 Intraday AnalysisH4 Analysis:
Expectation remains the same as per analysis yesterday (28/02/2024)
-> Swing: Bullish.
-> Internal: Bearish.
-> Sub-Internal: Bullish.
-> Has reached EQ.
I have marked sub-internal in red due to the significant range of the internal structure.
Price has printed a bullish sub-internal iiBOS. which indicates that we are still in the pullback phase of the internal structure.
We now seem to be in the pullback phase of the iiBOS.
Price reacted to the 50% EQ of the swing range, which is indicated in black to form bearish price action.
Current expectation, is for price to target weak internal low. A good indication that pullback phase of the internal structure is complete is once price breaks and closes below sub-internal structure low to target the weak internal low.
H4 Chart:
M15 Analysis:
-> Swing: Bullish.
-> Internal: Bullish.
-> Has reached EQ.
Price has printed a bullish iBOS. Internal range established.
POI marked with red border is a flip-zone where price mitigated and continued bullish.
Price reacted to the flip-zone again and continued bullish.
Intraday expectation is for price to continue bullish to target weak internal high.
M15 Chart:

EURUSD 29 Feb 2024 W9 - Intraday Analysis - US PCE/JoblessThis is my Intraday analysis on EURUSD for 29 Feb 2024 W9 based on Smart Money Concept (SMC) which includes the following Time Frames:
4H
15m
NOTE: Nothing changed again from yesterday, 4H no changes and 15m just created INT to INT Structure.
4H Chart Analysis
1.
Swing Bearish
INT Bullish
Swing Pullback Phase
2.
After a BOS and iBOS we expect a Pullback.
As expected after the Bullish CHoCH and mitigation of 4H/Daily Demand zones, we initiated the INT Structure Pullback.
Price reached the 4H/Daily Supply and from there we could start the bearish continuation.
Price failed to continue the bearish move and as expected it changed bullish and created iBOS confirming Swing Low and Bearish Swing Pullback Phase started.
3.
After Bullish iBOS confirming Swing Pullback Phase started, We are expecting INT Pullback.
Price reached the 4H Supply as expected and showed solid reaction from there. This reaction is starting the Bullish INT Structure Pullback.
We didn't do a Bearish CHoCH to confirm INT High yet. So, there is a probability that price could tap into the CHoCH.
Also we tapped into a Daily Demand (Not a HP zone) which is currently containing price.
As the 4H Swing is bearish, the Swing pullback could be done after reaching the 4H Supply, Bearish CHoCH will be the initial weak conformation and a Bearish iBOS will be the solid confirmation for that scenario.
Other scenario is a deeper Swing Pullback and 4H INT will stay Bullish to facilitate that view.
15m Chart Analysis
1.
Swing Bullish
INT Bullish
INT INT Bearish
INT Continuation Phase
2.
Swing turned bullish to facilitate the 4H Swing Pullback.
After BOS we expect a pullback. Price reached the 4H Supply as expected and from there started the 15m INT Structure Pullback.
With the ranging behavior of price we created INT to INT Structure which turned bearish and currently challenging to maybe targeting the INT Structure Pullback low (ii Low @ 1.0803).
Price is currently bearish within the Bullish INT/Swing structure. Expectations that the INT to INT Structure will continue bearish and target the INT to INT Low.
But be mindful that there is a HP that price can create a bullish iiBOS to continue the Bullish INT Structure.

BANK NIFTY INTRADAY LEVELS FOR 29/02/2024BUY ABOVE - 46100
SL - 45930
TARGETS - 46300,46450,46560
SELL BELOW - 45930
SL - 46100
TARGETS - 45730,45570,45330
NO TRADE ZONE - 45930 to 46100
Previous Day High - 46750
Previous Day Low - 45930
Based on price action major support & resistance's are here, the red lines acts as resistances, the green lines acts as supports. If the price breaks the support/resistance, it will move to the next support/resistance line. White lines indicates previous day high & low, high acts as a resistance & low acts as a support for next day.
Trendlines are also significant to price action. If the price is above/below the trendlines, can expect an UP/DOWN with aggressive move.
Please NOTE: this levels are for intraday trading only.
Disclaimer - All information on this page is for educational purposes only,
we are not SEBI Registered, Please consult a SEBI registered financial advisor for your financial matters before investing And taking any decision. We are not responsible for any profit/loss you made.
Request your support and engagement by liking and commenting & follow to provide encouragement
HAPPY TRADING 👍

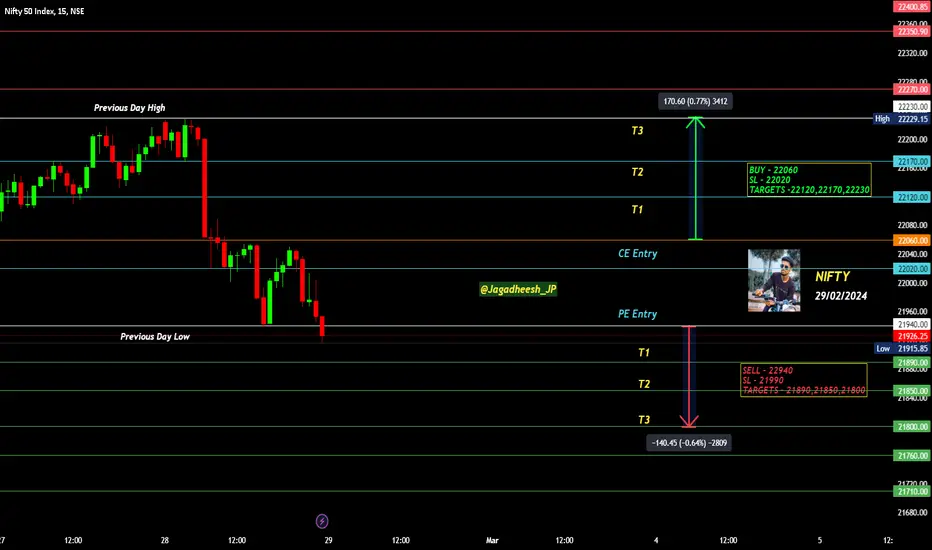
NIFTY INTRADAY LEVELS FOR 29/02/2024BUY ABOVE - 22060
SL - 22020
TARGETS -22120,22170,22230
SELL BELOW - 22940
SL - 21990
TARGETS - 21890,21850,21800
NO TRADE ZONE - 21940 to 22060
Previous Day High - 22230
Previous Day Low - 21940
Based on price action major support & resistance's are here, the red lines acts as resistances, the green lines acts as supports. If the price breaks the support/resistance, it will move to the next support/resistance line. White lines indicates previous day high & low, high acts as a resistance & low acts as a support for next day.
Trendlines are also significant to price action. If the price is above/below the trendlines, can expect an UP/DOWN with aggressive move.
Please NOTE: this levels are for intraday trading only.
Disclaimer - All information on this page is for educational purposes only,
we are not SEBI Registered, Please consult a SEBI registered financial advisor for your financial matters before investing And taking any decision. We are not responsible for any profit/loss you made.
Request your support and engagement by liking and commenting & follow to provide encouragement
HAPPY TRADING 👍
S&P 500 SYMMETRICAL TRIANGLE FOR INTRADAY 29/02/2024BUY ABOVE - 5076
SL - 5070
TARGETS - 5081,5088,5100
SELL BELOW - 5057
SL - 5062
TARGETS - 5047,5039,5032
NO TRADE ZONE - 5057 to 5076
Previous Day High - 5076
Previous Day Low - 5057
Based on price action major support & resistance's are here, the red lines acts as resistances, the green lines acts as supports. If the price breaks the support/resistance, it will move to the next support/resistance line. White lines indicates previous day high & low, high acts as a resistance & low acts as a support for next day.
Trendlines are also significant to price action. If the price is above/below the trendlines, can expect an UP/DOWN with aggressive move.
Please NOTE: this levels are for intraday trading only.
Disclaimer - All information on this page is for educational purposes only,
we are not SEBI Registered, Please consult a SEBI registered financial advisor for your financial matters before investing And taking any decision. We are not responsible for any profit/loss you made.
Request your support and engagement by liking and commenting & follow to provide encouragement
HAPPY TRADING 👍

XAU/USD 28 Feb 2024 Intraday AnalysisH4 Analysis:
Expectation remains the same as per analysis yesterday (27/02/2024)
-> Swing: Bullish.
-> Internal: Bearish.
-> Sub-Internal: Bullish.
-> Has reached EQ.
I have marked sub-internal in red due to the significant range of the internal structure.
Price has printed a bullish sub-internal iiBOS. which indicates that we are still in the pullback phase of the internal structure.
We now seem to be in the pullback phase of the iiBOS.
Price reacted to the 50% EQ of the swing range, which is indicated in black to form bearish price action.
Current expectation, is for price to target weak internal low. A good indication that pullback phase of the internal structure is completed is once price breaks and closes below sub-internal structure low to target the weak internal low.
H4 Chart:
M15 Analysis:
-> Swing: Bullish.
-> Internal: Bullish.
-> Has reached EQ.
Price has printed a bullish iBOS. Internal range established.
POI marked with red border is a flip-zone where price mitigated and continued bullish.
Flip zone is also closely located close to 50% EQ.
Intraday expectation is for price to react at H4 POI, strong internal low to be respected. Price to continue bullish to target weak internal high.
M15 Chart:

EURUSD 28 Feb 2024 W9 - Intraday Analysis - US GDPThis is my Intraday analysis on EURUSD for 28 Feb 2024 W9 based on Smart Money Concept (SMC) which includes the following Time Frames:
4H
15m
NOTE: Nothing changed again from yesterday, 4H no changes and 15m just created INT to INT Structure.
4H Chart Analysis
1.
Swing Bearish
INT Bullish
Swing Pullback Phase
2.
After a BOS and iBOS we expect a Pullback.
As expected after the Bullish CHoCH and mitigation of 4H/Daily Demand zones, we initiated the INT Structure Pullback.
Price reached the 4H/Daily Supply and from there we could start the bearish continuation.
Price failed to continue the bearish move and as expected it changed bullish and created iBOS confirming Swing Low and Bearish Swing Pullback Phase started.
3.
After Bullish iBOS confirming Swing Pullback Phase started, We are expecting INT Pullback.
Price reached the 4H Supply as expected and showed solid reaction from there. This reaction is starting the Bullish INT Structure Pullback.
We didn't do a Bearish CHoCH to confirm INT High yet. So, there is a probability that price could tap into the CHoCH.
Also we tapped into a Daily Demand (Not a HP zone) which is currently containing price.
As the 4H Swing is bearish, the Swing pullback could be done after reaching the 4H Supply, Bearish CHoCH will be the initial weak conformation and a Bearish iBOS will be the solid confirmation for that scenario.
Other scenario is a deeper Swing Pullback and 4H INT will stay Bullish to facilitate that view.
15m Chart Analysis
1.
Swing Bullish
INT Bullish
INT INT Bearish
INT Continuation Phase
2.
Swing turned bullish to facilitate the 4H Swing Pullback.
After BOS we expect a pullback. No HTF POI price tapped into yet to start the pullback.
Price reached the 4H Supply as expected and from there started the 15m INT Structure Pullback.
We reached the INT Structure extreme and price started a bounce.
Price created a Bullish CHoCH after ranging which indicates that the INT Pullback is over and expectation is to target the Weak INT High.
With the ranging behavior of price we created INT to INT Structure which turned bearish and currently challenging to maybe targeting the INT Structure Pullback low (ii Low @ 1.0803).

NIFTY INTRADAY LEVELS FOR 28/02/2024BUY ABOVE - 22210
SL - 22170
TARGETS -22250,22300,22350
SELL BELOW - 22170
SL - 22210
TARGETS - 22120,22070,22020
NO TRADE ZONE - 22170 to 22210
Previous Day High - 22210
Previous Day Low - 22070
Based on price action major support & resistance's are here, the red lines acts as resistances, the green lines acts as supports. If the price breaks the support/resistance, it will move to the next support/resistance line. White lines indicates previous day high & low, high acts as a resistance & low acts as a support for next day.
Trendlines are also significant to price action. If the price is above/below the trendlines, can expect an UP/DOWN with aggressive move.
Please NOTE: this levels are for intraday trading only.
Disclaimer - All information on this page is for educational purposes only,
we are not SEBI Registered, Please consult a SEBI registered financial advisor for your financial matters before investing And taking any decision. We are not responsible for any profit/loss you made.
Request your support and engagement by liking and commenting & follow to provide encouragement
HAPPY TRADING 👍

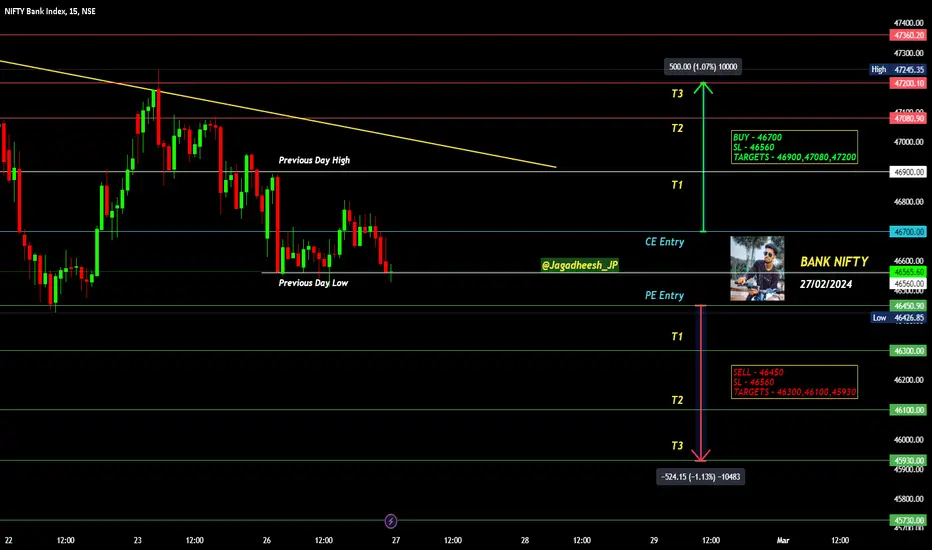
BANK NIFTY INTRADAY LEVELS FOR 28/02/2024BUY ABOVE - 46700
SL - 46560
TARGETS - 46900,47080,47200
SELL BELOW - 46450
SL - 46560
TARGETS - 46300,46450,46300
NO TRADE ZONE - 46560 to 46700
Previous Day High - 46700
Previous Day Low - 46300
Based on price action major support & resistance's are here, the red lines acts as resistances, the green lines acts as supports. If the price breaks the support/resistance, it will move to the next support/resistance line. White lines indicates previous day high & low, high acts as a resistance & low acts as a support for next day.
Trendlines are also significant to price action. If the price is above/below the trendlines, can expect an UP/DOWN with aggressive move.
Please NOTE: this levels are for intraday trading only.
Disclaimer - All information on this page is for educational purposes only,
we are not SEBI Registered, Please consult a SEBI registered financial advisor for your financial matters before investing And taking any decision. We are not responsible for any profit/loss you made.
Request your support and engagement by liking and commenting & follow to provide encouragement
HAPPY TRADING 👍

S&P 500 INTRADAY LEVELS FOR 28/02/2024BUY ABOVE - 5081
SL - 5075
TARGETS - 5088,5100,5110
SELL BELOW - 5070
SL - 5081
TARGETS - 5057,5047,5039
NO TRADE ZONE - 5070 to 5081
Previous Day High - 5081
Previous Day Low - 5057
Based on price action major support & resistance's are here, the red lines acts as resistances, the green lines acts as supports. If the price breaks the support/resistance, it will move to the next support/resistance line. White lines indicates previous day high & low, high acts as a resistance & low acts as a support for next day.
Trendlines are also significant to price action. If the price is above/below the trendlines, can expect an UP/DOWN with aggressive move.
Please NOTE: this levels are for intraday trading only.
Disclaimer - All information on this page is for educational purposes only,
we are not SEBI Registered, Please consult a SEBI registered financial advisor for your financial matters before investing And taking any decision. We are not responsible for any profit/loss you made.
Request your support and engagement by liking and commenting & follow to provide encouragement
HAPPY TRADING 👍

XAU/USD 27 Feb 2024 Intraday AnalysisH4 Analysis:
Expectation remains the same as per analysis yesterday (26/02/2024)
-> Swing: Bullish.
-> Internal: Bearish.
-> Sub-Internal: Bullish.
-> Has reached EQ.
I have marked sub-internal in red due to the significant range of the internal structure.
Price has printed a bullish sub-internal iiBOS. which indicates that we are still in the pullback phase of the internal structure.
We now seem to be in the pullback phase of the iiBOS.
Price is reacting to the 50% EQ of the swing range, which is indicated in black.
Current expectation, is for price to target weak internal low. A good indication that pullback phase of the internal structure is completed is once price breaks and closes below sub-internal structure low to target the weak internal low.
Price could possibly continue bullish, react at H4 POI before continuing bearish move.
H4 Chart:
M15 Analysis:
-> Swing: Bullish.
-> Internal: Bullish.
-> Has reached EQ.
Price has printed a bullish iBOS. Internal range established.
POI marked with red border is a flip-zone where price mitigated and continued bullish.
Flip zone is also closely located close to 50% EQ.
Intraday expectation is for price to continue bullish to target weak internal high.
M15 Chart:

Ascending Triangle pattern breakout in TATAMOTOTATA MOTORS LTD
Key highlights: 💡⚡
✅On 1 Hour Time Frame Stock Showing Breakout of Ascending Triangle Pattern.
✅Strong Bullish Candlestick Form on this timeframe.
✅It can give movement up to the Breakout target of 995+.
✅Can Go Long in this Stock by placing a stop loss below 930-.

EURUSD 27 Feb 2024 W9 - Intraday Analysis - US Cons. ConfidenceThis is my Intraday analysis on EURUSD for 27 Feb 2024 W9 based on Smart Money Concept (SMC) which includes the following Time Frames:
4H
15m
4H Chart Analysis
1.
Swing Bearish
INT Bullish
Swing Pullback Phase
2.
After a BOS and iBOS we expect a Pullback.
As expected after the Bullish CHoCH and mitigation of 4H/Daily Demand zones, we initiated the INT Structure Pullback.
Price reached the 4H/Daily Supply and from there we could start the bearish continuation.
Price failed to continue the bearish move and as expected it changed bullish and created iBOS confirming Swing Low and Bearish Swing Pullback Phase started.
3.
After Bullish iBOS confirming Swing Pullback Phase started, We are expecting INT Pullback.
Price reached the 4H Supply as expected and showed solid reaction from there. This reaction is starting the Bullish INT Structure Pullback.
We didn't do a Bearish CHoCH to confirm INT High yet. So, there is a probability that price could tap into the CHoCH.
Also we tapped into a Daily Demand (Not a HP zone) which is currently containing price.
As the 4H Swing is bearish, the Swing pullback could be done after reaching the 4H Supply, Bearish CHoCH will be the initial weak conformation and a Bearish iBOS will be the solid confirmation for that scenario.
Other scenario is a deeper Swing Pullback and 4H INT will stay Bullish to facilitate that view.
15m Chart Analysis
1.
Swing Bullish
INT Bullish
INT Continuation Phase
2.
Swing turned bullish to facilitate the 4H Swing Pullback.
After BOS we expect a pullback. No HTF POI price tapped into yet to start the pullback.
Price reached the 4H Supply as expected and from there started the 15m INT Structure Pullback.
We reached the INT Structure extreme and price started a bounce.
Price created a Bullish CHoCH after ranging which indicates that the INT Pullback is over and expectation is to target the Weak INT High.

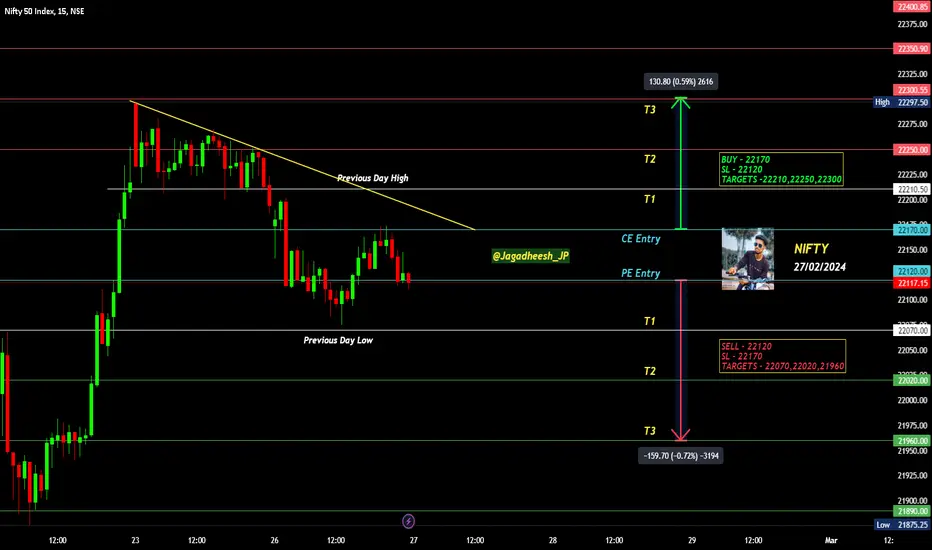
NIFTY INTRADAY LEVELS FOR 27/02/2024BUY ABOVE - 22170
SL - 22120
TARGETS -22210,22250,22300
SELL BELOW - 22120
SL - 22170
TARGETS - 22070,22020,21960
NO TRADE ZONE - 22120 to 22170
Previous Day High - 22210
Previous Day Low - 22070
Based on price action major support & resistance's are here, the red lines acts as resistances, the green lines acts as supports. If the price breaks the support/resistance, it will move to the next support/resistance line. White lines indicates previous day high & low, high acts as a resistance & low acts as a support for next day.
Trendlines are also significant to price action. If the price is above/below the trendlines, can expect an UP/DOWN with aggressive move.
Please NOTE: this levels are for intraday trading only.
Disclaimer - All information on this page is for educational purposes only,
we are not SEBI Registered, Please consult a SEBI registered financial advisor for your financial matters before investing And taking any decision. We are not responsible for any profit/loss you made.
Request your support and engagement by liking and commenting & follow to provide encouragement
HAPPY TRADING 👍
BANK NIFTY INTRADAY LEVELS FOR 27/02/2024BUY ABOVE - 46700
SL - 46560
TARGETS - 46900,47080,47200
SELL BELOW - 46450
SL - 46560
TARGETS - 46300,46100,45930
NO TRADE ZONE - 46450 to 46700
Previous Day High - 46900
Previous Day Low - 46560
Based on price action major support & resistance's are here, the red lines acts as resistances, the green lines acts as supports. If the price breaks the support/resistance, it will move to the next support/resistance line. White lines indicates previous day high & low, high acts as a resistance & low acts as a support for next day.
Trendlines are also significant to price action. If the price is above/below the trendlines, can expect an UP/DOWN with aggressive move.
Please NOTE: this levels are for intraday trading only.
Disclaimer - All information on this page is for educational purposes only,
we are not SEBI Registered, Please consult a SEBI registered financial advisor for your financial matters before investing And taking any decision. We are not responsible for any profit/loss you made.
Request your support and engagement by liking and commenting & follow to provide encouragement
HAPPY TRADING 👍