Descending Triangle pattern breakout in INDIGOINTERGLOBE AVIATION LTD
Key highlights: 💡⚡
✅On 1 Hour Time Frame Stock Showing Breakout of Descending Triangle Pattern.
✅Strong Bullish Candlestick Form on this timeframe.
✅It can give movement up to the Breakout target of 3240+.
✅Can Go Long in this Stock by placing a stop loss below 3040-.
Intraday

EURUSD 20 Feb 2024 W8 - Intraday AnalysisThis is my Intraday analysis on EURUSD for 20 Feb 2024 W8 based on Smart Money Concept (SMC) which includes the following Time Frames:
4H
15m - Scenario 1
15m - Scenario 2
4H Chart Analysis
1.
Swing Bearish
INT Bearish
INT Pullback Phase
2.
After a BOS and iBOS we expect a Pullback.
As expected after the Bullish CHoCH and mitigation of 4H/Daily Demand zones, we initiated the INT Structure Pullback.
Price reached the 4H/Daily Supply and from there we could start the bearish continuation.
Also be mindful that there is also a pullback required for the 4H Swing so there is a HP if price going to stay bullish we will take the Strong INT High.
Bullish iBOS will signal a Swing Pullback.
15m Chart Analysis - Scenario 1
1.
Swing Bearish
INT Bearish
Swing Bearish Continuation Phase
2.
Price is at the 15m Swing Extreme, mitigating the 4H Supply.
As the Swing is Bearish, expectations is set to continue Bearish.
Price created a Bearish iBOS signaling that that the Swing Pullback is over and we started the Swing Bearish Continuation Phase to target the Swing Low.
But also be mindful that the 4H Swing Pullback still required so there is a HP that we may take the 15m Swing High.
3.
15m/4H Demand zones that can provide only reaction and not a buy opportunity.
15m Chart Analysis - Scenario 1
1.
Swing Bearish
INT Bullish
INT Pullback Phase
2.
Price is at the 15m Swing Extreme, mitigating the 4H Supply.
As the Swing is Bearish, expectations is set to continue Bearish.
Price created a Bearish INT to INT structure and tuned bearish to facilitate the INT Structure Pullback. As the INT is Bullish there is a HP we are going to target the Swing High.
Bearish iBOS will signal that the Swing Pullback Phase is over and we are starting the Swing Bearish continuation Phase.
But also be mindful that the 4H Swing Pullback still required so there is a HP that we may take the 15m Swing High.
3.
15m/4H Demand zones that can provide only reaction and not a buy opportunity.

XAU/USD 19 Feb 2024 Intraday AnalysisH4 Analysis:
Analysis/expectation remains the same as weekly analysis posted on 18/02/2024)
-> Swing: Bullish.
-> Internal Bearish.
-> Has reached EQ.
Price has printed a further bearish iBOS followed by a bullish CHoCH which is the first structural indication that pullback following bearish iBOS has initiated.
Expectation dated 16/02/2024 was for price to continue bullish and react at H4 POI or 50% EQ which price did and currently doing.
Current expectation, await bearish price action to confirm bullish pullback is complete for price to target weak internal low.
First structural confirmation that pullback is complete would be for price to print a bearish CHoCH.
H4 Chart:
M15 Analysis:
-> Swing: Bullish.
-> Internal: Bullish.
-> Has reached EQ.
Price has printed a bullish iBOS. Internal range following bearish CHoCH is now established.
Expectation following iBOS is for price to pullback after reaction from a POI which is currently underway.
Current expectation is for price to continue bearish and react at 50% EQ or M15 POI.
M15 Chart:

EURUSD 19 Feb 2024 W8 - Intraday AnalysisThis is my Intraday analysis on EURUSD for 19 Feb 2024 W8 based on Smart Money Concept (SMC) which includes the following Time Frames:
4H
15m
4H Chart Analysis
1.
Swing Bearish
INT Bearish
INT Pullback Phase
2.
After a BOS and iBOS we expect a Pullback.
As expected after the Bullish CHoCH and mitigation of 4H/Daily Demand zones, we initiated the INT Structure Pullback.
Price reached the 4H/Daily Supply and from there we could start the bearish continuation.
Also be mindful that there is also a pullback required for the 4H Swing so there is a HP if price going to stay bullish we will take the Strong INT High.
Bullish iBOS will signal a Swing Pullback.
15m Chart Analysis
15m Chart 1
15m Chart 2
1.
Swing Bearish
INT Bullish
Swing / INT Pullback Phase
Swing Extreme
2.
Price is at the 15m Swing Extreme, mitigating the 4H Supply.
As the Swing is Bearish, expectations is set to continue Bearish. Bearish iBOS will be the signal that the Swing Pullback is over and we may start the Bearish 15m Swing Continuation Phase.
But also be mindful that the 4H Swing Pullback still required so there is a HP that we may take the 15m Swing High.
3.
15m/4H Demand zones that can provide only reaction and not a buy opportunity.

#NIFTY Intraday Support and Resistance Levels -19/02/2024Nifty will be gap up opening in today's session. After opening nifty sustain above 22060 level and then possible upside rally up to 22180 level in today's session. in case nifty trades below 22010 level then the downside target can go up to the 21890 level.

XAU/USD 16 Feb 2024 Intraday AnalysisH4 Analysis:
Analysis/expectation remains the same as yesterday (15/02/2024)
-> Swing: Bullish.
-> Internal Bearish.
-> Has reached EQ.
Price has printed a further bearish iBOS followed by a bullish CHoCH which is the first structural indication that pullback following bearish iBOS has initiated.
Expectation is for price to continue bullish and react at H4 POI or 50% EQ.
H4 Chart:
M15 Analysis:
-> Swing: Bullish.
-> Internal: Bullish.
-> Has reached EQ.
Price has printed a bullish iBOS indicating H4 bullish pullback has initiated.
Current intraday expectation remains the same as yesterday (15/02/2024) for price to continue bullish and react at nested H4 and M15 POI's.
M15 Chart:

EURUSD 16 Feb 2024 W7 - Intraday Analysis - US PPIThis is my Intraday analysis on EURUSD for 16 Feb 2024 W7 based on Smart Money Concept (SMC) which includes the following Time Frames:
4H
15m
4H Chart Analysis
1.
Swing Bearish
INT Bearish
INT Pullback Phase
2.
After a BOS and iBOS we expect a Pullback.
As expected after the Bullish CHoCH and mitigation of 4H/Daily Demand zones, we initiated the INT Structure Pullback.
Price reached the 4H/Daily Supply and from there we could start the bearish continuation.
Also be mindful that there is also a pullback required for the 4H Swing so there is a HP if price going to stay bullish we will take the Strong INT High.
Bullish iBOS will signal a Swing Pullback.
15m Chart Analysis
1.
Swing Bearish
INT Bullish
Swing / INT Pullback Phase
Swing Extreme
2.
Price reached the last Supply and Extreme of the 15m Swing / 4H Supply and initiated the Bullish INT Structure Pullback after.
As the Swing is Bearish, expectations is set to continue Bearish. INT to turn bearish will be the signal that the Swing Pullback is over.
But also be mindful that the 4H Swing Pullback still required so there is a HP that we may take the 15m Swing High.
3.
15m/4H Demand zones that can provide only reaction and not a buy opportunity.

EURUSD 15 Feb 2024 W7 - Intraday Analysis - US Retail SalesThis is my Intraday analysis on EURUSD for 15 Feb 2024 W7 based on Smart Money Concept (SMC) which includes the following Time Frames:
4H
15m
4H Chart Analysis
1.
Swing Bearish
INT Bearish
INT Pullback Phase
2.
Swing formed Bearish iBOS signaling that the Daily Bearish Swing Pullback Phase is over and we are currently in the Daily Bearish continuation phase.
3.
After a BOS we expect a Swing Pullback.
Internal Structure is also Bearish with iBOS, So 4H Swing and INT are expecting a pullback which could start at anytime from the current Daily Demand which is partially mitigated and we are below that mitigation or from the 4H Demand nested within the Daily Demand.
Price created a Bullish CHoCH confirming INT Low and we are currently in the INT Structure Pullback Phase.
Expectation is set to pullback to the 4H/Daily Supply zones and continue Bearish after.
Bullish iBOS will signal a Swing Pullback.
15m Chart Analysis
1.
Swing Bearish
INT Bullish
Swing / INT Pullback Phase
2.
Previous Swing Pullback ended with the Bearish iBOS and price created another Bearish iBOS with the CPI news which created a Bearish BOS.
3.
After a BOS we expect a Swing Pullback.
Price created a Bullish iBOS to facilitate the the 15m Swing Pullback.
Expectations is set now to continue bullish to the 15m Swing EQ / the 4H-15m Supply zones to continue the Bearish Swing.
But be mindful also that the 4H is requesting a Pullback so there is a HP that the 15m Swing could be broken too.

NIFTY INTRADAY LEVELS FOR 15/02/2024BUY ABOVE - 21860
SL - 21810
TARGETS - 21910,21970,21010
SELL BELOW - 21770
SL - 21810
TARGETS - 21710,21640,21580
NO TRADE ZONE - 21770 to 21860
Previous Day High - 21770
Previous Day Low - 21580
Based on price action major support & resistance's are here, the red lines acts as resistances, the green lines acts as supports. If the price breaks the support/resistance, it will move to the next support/resistance line. White lines indicates previous day high & low, high acts as a resistance & low acts as a support for next day.
Trendlines are also significant to price action. If the price is above/below the trendlines, can expect an UP/DOWN with aggressive move.
Please NOTE: this levels are for intraday trading only.
Disclaimer - All information on this page is for educational purposes only,
we are not SEBI Registered, Please consult a SEBI registered financial advisor for your financial matters before investing And taking any decision. We are not responsible for any profit/loss you made.
Request your support and engagement by liking and commenting & follow to provide encouragement
HAPPY TRADING 👍

BANK NIFTY INTRADAY LEVELS FOR 15/02/2024BUY ABOVE - 46170
SL - 46010
TARGETS - 46300,46500,46670
SELL BELOW - 45730
SL - 46010
TARGETS - 45570,45330,45150
NO TRADE ZONE - 45730 to 46170
Previous Day High - 45730
Previous Day Low - 44950
Based on price action major support & resistance's are here, the red lines acts as resistances, the green lines acts as supports. If the price breaks the support/resistance, it will move to the next support/resistance line. White lines indicates previous day high & low, high acts as a resistance & low acts as a support for next day.
Trendlines are also significant to price action. If the price is above/below the trendlines, can expect an UP/DOWN with aggressive move.
Please NOTE: this levels are for intraday trading only.
Disclaimer - All information on this page is for educational purposes only,
we are not SEBI Registered, Please consult a SEBI registered financial advisor for your financial matters before investing And taking any decision. We are not responsible for any profit/loss you made.
Request your support and engagement by liking and commenting & follow to provide encouragement
HAPPY TRADING 👍

XAU/USD 14 Feb 2024 Intraday AnalysisH4 Analysis:
-> Swing: Bullish.
-> Internal Bearish.
-> Has reached EQ.
As per previous analysis price did target weak internal low.
Internal structure remains bearish.
Price has printed a further bearish iBOS.
Expectation is for price to react at a POI, which price currently is reacting to Daily and H4 nested demand levels.
Bullish CHoCH, indicated by vertical dotted line will be first structural indication, but not confirmation, that pullback is underway.
Expectation is for price to print bullish pullback and react at H4 POI.
H4 Chart:
M15 Analysis:
-> Swing: Bullish.
-> Internal: Bearish.
-> Sub-Internal: Bearish.
-> Has reached EQ.
Price has printed a bearish iBOS, as per previous analysis, price did target weak internal low where we are now seeing a bullish reaction to nested Daily and H4 POI's.
Intraday expectation of previous analysis was for price to target weak internal low at 2001.895, therefore, expectation was reached.
Current intraday expectation is for price to print bullish iBOS to confirm pullback following H4 and M15 bearish iBOS is underway.
M15 Chart:

EURUSD 14 Feb 2024 W7 - Intraday Analysis - EU GDPThis is my Intraday analysis on EURUSD for 14 Feb 2024 W7 based on Smart Money Concept (SMC) which includes the following Time Frames:
Daily
4H
15m
Daily Chart Analysis
1.
Swing Bearish
INT Bearish
2.
Within the Bearish Swing we are currently in the Swing pullback reached the Swing extreme area and mitigated a Weekly Supply zone (But didn't reach the Daily Supply) and started the INT Structure Pullback after the Bullish iBOS.
For the Bearish Swing to continue bearish, we want to see a Bearish iBOS to confirm that the Swing Pullback is over and we are in the Swing Continuation to target the Weak Swing Low.
Price confirmed a Bearish iBOS yesterday and this signals the Swing continuation phase.
3.
After the iBOS we expect a Pullback.
Price is currently within the Daily demand on the left which is partially mitigated and approaching a Weekly Demand Zone which could provide reaction to facilitate the Bearish INT Structure Pullback.
4.
Daily and Weekly demand zones for reactions once reached.
4H Chart Analysis
1.
Swing Bearish
INT Bearish
OF Bearish
2.
Swing formed Bearish iBOS signaling that the Daily Bearish Swing Pullback Phase is over and we are currently in the Daily Bearish continuation phase.
3.
After a BOS we expect a Swing Pullback.
Internal Structure is also Bearish with iBOS, So 4H Swing and INT are expecting a pullback which could start at anytime from the current Daily Demand which is partially mitigated and we are below that mitigation or from the 4H Demand nested within the Daily Demand.
A Bullish CHoCH will confirm the INT Low and may start he INT Structure Pullback.
But be mindful that we the Bearish momentum we are in, Price can continue Bearish with minor Pullbacks.
Current CHoCH is high for price to reach so i'm expecting price to create a new low first before we start the INT Pullback.
Bullish iBOS will signal a Swing Pullback.
15m Chart Analysis
1.
Swing Bearish
INT Bearish
2.
Previous Swing Pullback ended with the Bearish iBOS and price created another Bearish iBOS with the CPI news yesterday which created a Bearish BOS.
3.
After a BOS we expect a Swing Pullback.
Price currently approaching a 4H Demand Zone that can provide reaction for the Pullback.
Most probably i'll wait for a Bullish iBOS to signal the Swing Pullback.

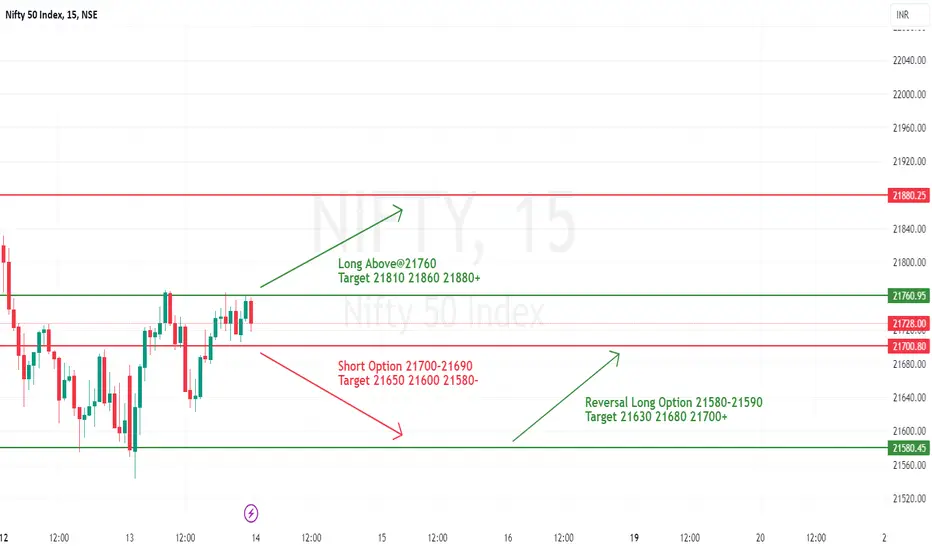
#NIFTY Intraday Support and Resistance Levels -14/02/2024Nifty will be gap down opening in today's session. After opening nifty start trading below 21700 level and then possible downside rally up to 21580 in today's session. in case nifty trades above 21760 level then the upside target can go up to the 21880 level.also possible reversal upside 21580 level.
BANK NIFTY INTRADAY LEVELS FOR 14/02/2024BUY ABOVE - 45570
SL - 45450
TARGETS - 45730,46010,46200
SELL BELOW - 45330
SL - 45470
TARGETS - 45150,44950,44740
NO TRADE ZONE - 45330 to 45730
Previous Day High - 45730
Previous Day Low - 44740
Based on price action major support & resistance's are here, the red lines acts as resistances, the green lines acts as supports. If the price breaks the support/resistance, it will move to the next support/resistance line. White lines indicates previous day high & low, high acts as a resistance & low acts as a support for next day.
Trendlines are also significant to price action. If the price is above/below the trendlines, can expect an UP/DOWN with aggressive move.
Please NOTE: this levels are for intraday trading only.
Disclaimer - All information on this page is for educational purposes only,
we are not SEBI Registered, Please consult a SEBI registered financial advisor for your financial matters before investing And taking any decision. We are not responsible for any profit/loss you made.
Request your support and engagement by liking and commenting & follow to provide encouragement
HAPPY TRADING 👍

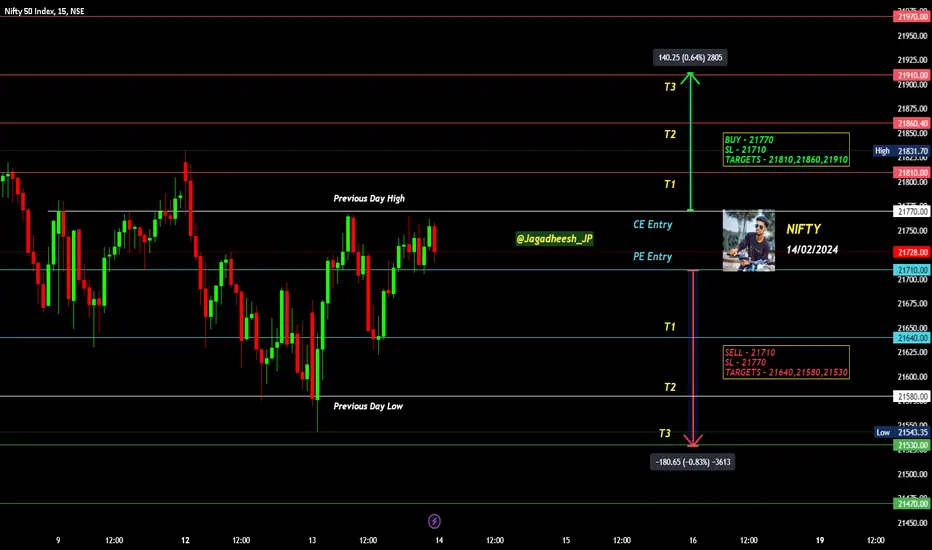
NIFTY INTRADAY LEVELS FOR 14/02/2024BUY ABOVE - 21770
SL - 21710
TARGETS - 21810,21860,21910
SELL BELOW - 21710
SL - 21770
TARGETS - 21640,21580,21530
NO TRADE ZONE - 21710 to 21770
Previous Day High - 21770
Previous Day Low - 21580
Based on price action major support & resistance's are here, the red lines acts as resistances, the green lines acts as supports. If the price breaks the support/resistance, it will move to the next support/resistance line. White lines indicates previous day high & low, high acts as a resistance & low acts as a support for next day.
Trendlines are also significant to price action. If the price is above/below the trendlines, can expect an UP/DOWN with aggressive move.
Please NOTE: this levels are for intraday trading only.
Disclaimer - All information on this page is for educational purposes only,
we are not SEBI Registered, Please consult a SEBI registered financial advisor for your financial matters before investing And taking any decision. We are not responsible for any profit/loss you made.
Request your support and engagement by liking and commenting & follow to provide encouragement
HAPPY TRADING 👍
XAU/USD 13 Feb 2024 Intraday AnalysisH4 Analysis:
-> Swing: Bullish.
-> Internal Bearish.
-> Has reached EQ.
Price printed double bullish iBOS to confirm swing pullback phase is complete.
Currently internal structure remains bearish.
Having started to map all CHoCh's to gain a micro-view of structure price is now trading within a POI.
Expectation remains, for price to continue to trade bearish to target weak internal low.
H4 Chart:
M15 Analysis:
-> Swing: Bullish.
-> Internal: Bullish.
-> Sub-Internal: Bearish.
-> Has reached EQ.
Following swing BOS price very aggressively pushed to the upside.
Price printed a bullish iBOS where we are still in the pullback phase.
Sub-structure to internal structure mapped in red printed bearish iiBOS and is currently trading within a nested H4 and M15 POI.
Intraday expectation - Price to target weak internal low at 2001.895.
M15 Chart:

Reversal Falling Wedge Pattern in BANKNIFTY INDEXBANKNIFTY Index
Key highlights: 💡⚡
📈 On 15 Min Time Frame Banknifty Index Showing Reversal of Falling Wedge Pattern.
📈 It can give movement upto the Reversal Final target of Below 44560-.
📈 There have chances of breakdown of Support level too.
📈 After breakdown of Support level this Banknifty index can gives strong downside rally upto below 43544-.
📈 Can Go short in this Banknifty index by placing a stop loss Above 45802+.

EURUSD 13 Feb 2024 W7 - Intraday Analysis - US CPI DayThis is my Intraday analysis on EURUSD for 13 Feb 2024 W7 based on Smart Money Concept (SMC) which includes the following Time Frames:
4H
15m
NOTE:
As i came to chart today it had the confusion for the first time since months in a clear view on the 15m Time Frame. This is because the Price behavior since Jan 2024 is not trending clearly specially in the past 2 to 3 weeks.
I decided to have 2 Scenarios for the 15m and will see which is the result after. I lean more Scenario 1 but lets see the at the end of the day what will be the results. It's one of these days that the market is telling you go do something else 😃 especially it's US CPI Day and one of the most waited news events since last FOMC meeting.
4H Chart Analysis (Nothing major changed since yesterday)
1.
Swing Bullish
INT Bearish
OF Bearish
In Swing Discount / Possible LiQ Sweep
2.
Price made a bullish BOS and after a BOS we expect a pullback.
After mitigating the Weekly Supply zone, price started the Swing pullback phase after a bearish CHoCH.
Price reached the 4H/Daily demand zones as expected after breaking the range and formed a Bullish INT Structure iBOS.
This Bullish iBOS failed to continue Bullish and we changed to Bearish INT Structure which means that the Swing Pullback Phase is not over.
We are also within the 4H Swing Demand/Discount so keep in mind that at anytime the Swing Continuation could start.
More price development needed with the current PA.
3.
Bearish momentum still active with a Bearish iBOS.
With the current series of bearish INT Structures, there is a HP that the 4H Swing Low will go as there is no much demand zones and the current demand is fully mitigated and every move up is just a sell opportunity.
After the iBOS we would expect a pullback. Price failed to close below the 4H Low which could be a sweep of LIQ.
As per previous days analysis, i was waiting to see at least a bullish CHoCH in order to see a possibility of a Pullback of the 4H Bearish iBOS and the 4H Swing is still Holding.
From the Fractal CHoCHs happening after Sweeping the LiQ below the 4H Swing Low showing that demand in control.
We are currently in the Pullback Phase of the Bearish iBOS and expectations to continue Bullish till the INT Structure EQ and maybe extending to the INT Extreme Supply.
15m Chart Analysis - Scenario 1️⃣
1.
Swing Bearish
INT Bullish
Pullback Phase
2.
INT Structure turned Bullish with iBOS confirming that the 15m Swing Pullback started as expected and we may have a deeper pullback.
After iBOS we expect a pullback which already started after a Bearish INT to INT Structure iiBOS.
As we didn't reach the Swing EQ or any HP POI we will have still the probability to continue up to maybe the 4H Supply Zone.
3.
The INT Structure had finished after the Bullish iiBOS.
Price is currently mitigating the INT to INT structure and expectations set to the target the Weak INT to INT high and then the INT High.
15m Chart Analysis - Scenario 2️⃣ (Correction INT Bearish)
1.
Swing Bearish
INT Bearish
Continuation Phase
2.
INT Structure turned Bearish signaling that the Swing Pullback is over and we are in the continuation phase targeting the Swing Low.
After iBOS we expect a pullback which is already started after a Bullish CHoCH reaching the INT Premium area but didn't mitigate any HP POI.
Expectations is set to targeting the Weak INT Low and continuation to target the Weak Swing Low.
3.
Demand Zone formed on the INT Pullback which is currently providing reaction and expectations is set to take out the current Weak INT Low.

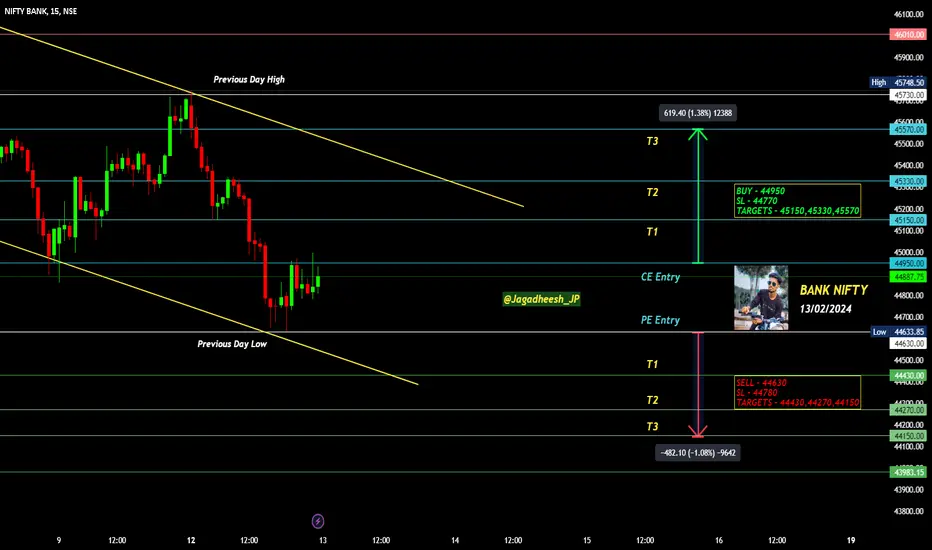
BANK NIFTY INTRADAY LEVELS FOR 13/02/2024BUY ABOVE - 44950
SL - 44770
TARGETS - 45150,45330,45570
SELL BELOW - 44630
SL - 44780
TARGETS - 44430,44270,44150
NO TRADE ZONE - 44630 to 44950
Previous Day High - 45730
Previous Day Low - 44630
Based on price action major support & resistance's are here, the red lines acts as resistances, the green lines acts as supports. If the price breaks the support/resistance, it will move to the next support/resistance line. White lines indicates previous day high & low, high acts as a resistance & low acts as a support for next day.
Trendlines are also significant to price action. If the price is above/below the trendlines, can expect an UP/DOWN with aggressive move.
Please NOTE: this levels are for intraday trading only.
Disclaimer - All information on this page is for educational purposes only,
we are not SEBI Registered, Please consult a SEBI registered financial advisor for your financial matters before investing And taking any decision. We are not responsible for any profit/loss you made.
Request your support and engagement by liking and commenting & follow to provide encouragement
HAPPY TRADING 👍
NIFTY INTRADAY LEVELS FOR 13/02/2024BUY ABOVE - 21670
SL - 21620
TARGETS - 21730,21770,21810
SELL BELOW - 21580
SL - 21620
TARGETS - 21530,21470,21400
NO TRADE ZONE - 21580 to 21670
Previous Day High - 21810
Previous Day Low - 21580
Based on price action major support & resistance's are here, the red lines acts as resistances, the green lines acts as supports. If the price breaks the support/resistance, it will move to the next support/resistance line. White lines indicates previous day high & low, high acts as a resistance & low acts as a support for next day.
Trendlines are also significant to price action. If the price is above/below the trendlines, can expect an UP/DOWN with aggressive move.
Please NOTE: this levels are for intraday trading only.
Disclaimer - All information on this page is for educational purposes only,
we are not SEBI Registered, Please consult a SEBI registered financial advisor for your financial matters before investing And taking any decision. We are not responsible for any profit/loss you made.
Request your support and engagement by liking and commenting & follow to provide encouragement
HAPPY TRADING 👍

#NIFTY Intraday Support and Resistance Levels -13/02/2024Nifty will be gap up opening in today's session. After opening nifty sustain above 21630 level and then possible upside rally up to 21750 level in today's session. in case nifty trades below 21580 level then the downside target can go up to the 21460 level.

S&P500 INTRADAY LEVELS FOR 12/02/2024BUY ABOVE - 5030
SL - 5020
TARGETS - 5045,5060+
SELL BELOW - 5015
SL - 5020
TARGETS - 5008,5000,4992
NO TRADE ZONE - 5015 to 5030
Previous Day High - 5030
Previous Day Low - 5000
Based on price action major support & resistance's are here, the red lines acts as resistances, the green lines acts as supports. If the price breaks the support/resistance, it will move to the next support/resistance line. White lines indicates previous day high & low, high acts as a resistance & low acts as a support for next day.
Trendlines are also significant to price action. If the price is above/below the trendlines, can expect an UP/DOWN with aggressive move.
Please NOTE: this levels are for intraday trading only.
Disclaimer - All information on this page is for educational purposes only,
we are not SEBI Registered, Please consult a SEBI registered financial advisor for your financial matters before investing And taking any decision. We are not responsible for any profit/loss you made.
Request your support and engagement by liking and commenting & follow to provide encouragement
HAPPY TRADING 👍

XAU/USD 12 Feb 2024 Intraday AnalysisH4 Analysis:
-> Swing: Bullish.
-> Internal Bearish.
-> Has reached EQ.
Price printed double bullish iBOS to confirm swing pullback phase is complete.
Currently internal structure remains bearish.
I have now started to map all CHoCh's to gain a micro-view of structure due to the nature of price action and the size of ranges.
Expectation remains as H4 analysis, for price to continue to trade bearish to target weak internal low.
H4: Chart:
M15 Analysis:
-> Swing: Bullish.
-> Internal: Bullish.
-> Sub-Internal: Bearish.
-> Has reached EQ.
Following swing BOS price very aggressively pushed to the upside.
Price printed a bullish iBOS where we are now in the pullback phase.
Sub-structure to internal structure, which is marked in red printed bullish iiBOS followed by a bearish iiBOS.
Intraday expectation -Price to target weak internal low at 2001.895.
M15 Chart:
