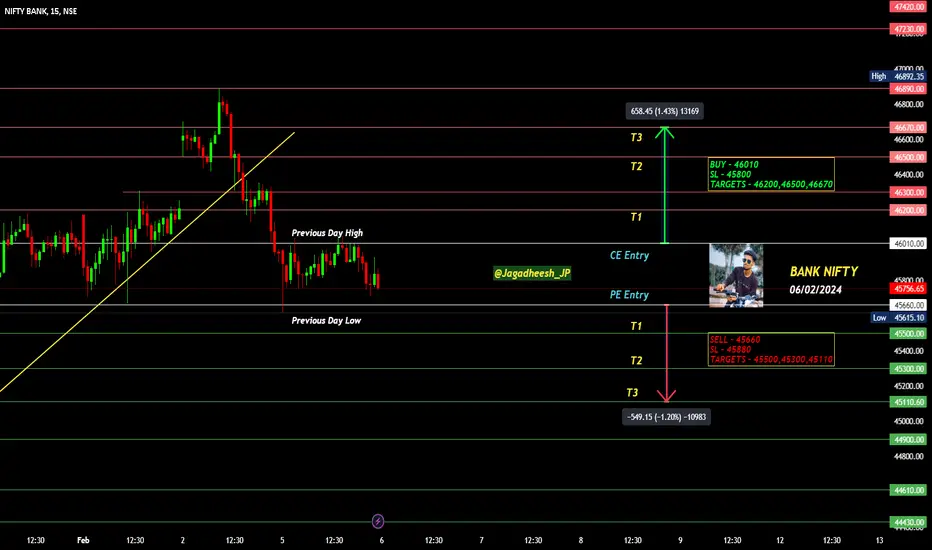
BANK NIFTY INTRADAY LEVELS FOR 06/02/2024BUY ABOVE - 46010
SL - 45800
TARGETS - 46200,46500,46670
SELL BELOW - 45660
SL - 45880
TARGETS - 45500,45300,45110
NO TRADE ZONE - 45660 to 46010
Previous Day High - 46010
Previous Day Low - 45660
Based on price action major support & resistance's are here, the red lines acts as resistances, the green lines acts as supports. If the price breaks the support/resistance, it will move to the next support/resistance line. White lines indicates previous day high & low, high acts as a resistance & low acts as a support for next day.
Trendlines are also significant to price action. If the price is above/below the trendlines, can expect an UP/DOWN with aggressive move.
Please NOTE: this levels are for intraday trading only.
Disclaimer - All information on this page is for educational purposes only,
we are not SEBI Registered, Please consult a SEBI registered financial advisor for your financial matters before investing And taking any decision. We are not responsible for any profit/loss you made.
Request your support and engagement by liking and commenting & follow to provide encouragement
HAPPY TRADING 👍
Intraday
XAU/USD 05 Feb 2024 Intraday AnalysisH4 Analysis:
-> Swing: Bullish.
-> Internal Bearish.
-> Has reached EQ.
Price printed double bullish iBOS to confirm swing pullback phase is complete.
Currently internal structure remains bearish.
Price has once again to reacted to Daily and H4 nested supply levels where we saw a noticeable reaction. Price wicked above high of internal structure but failed to close above.
Expectation remains as H4 analysis dated 04/02/2024, for price to continue to trade bearish to target weak internal low.
H4 Chart:
M15 Analysis:
-> Swing: Bullish.
-> Internal: Bearish.
-> Sub-Internal: Bullish
-> Has reached EQ.
Following swing BOS price very aggressively pushed to the upside.
Price has printed a bullish iBOS where we are now in the pullback phase.
Sub-structure to internal structure, which is marked in red has now printed a bearish iiBOS to align with internal bearish order-flow.
Expectation is for price to target weak internal low.
M15 Chart:

EURUSD 5 Feb 2024 W6 - Intraday Analysis - EU PMIThis is my Intraday analysis on EURUSD for 5 Feb 2024 W6 based on Smart Money Concept (SMC) which includes the following Time Frames:
4H
15m
4H Chart Analysis
1.
Swing Bullish
INT Bearish
OF Bearish
In Swing Discount
2.
Price made a bullish BOS and after a BOS we expect a pullback.
After mitigating the Weekly Supply zone, price started the Swing pullback phase after a bearish CHoCH.
Price reached the 4H/Daily demand zones as expected after breaking the range and formed a Bullish INT Structure iBOS.
This Bullish iBOS failed to continue Bullish and we changed to Bearish INT Structure which means that the Swing Pullback Phase is not over.
We are also within the 4H Swing Demand/Discount so keep in mind that at anytime the Swing Continuation could start.
More price development needed with the current PA.
3.
Bearish momentum still active with a Bearish iBOS.
With the current series of bearish INT Structures, there is a HP that the 4H Swing Low will go as there is no much demand zones and the current demand is in mitigation and every move up is just a sell opportunity.
After the iBOS we would expect a pullback and the current CHoCH is the INT High. So either price engineer a new CHoCH or it will target the INT High (i Doubt we have catalyst for that this week).
I'll be waiting 15m to align bullish to play the 4H iBOS pullback if possible. Other wise waiting for better Short opportunity from the 4H Supply.
Lets wait for the LTF to guide us.
15m Chart Analysis
1.
Swing Bearish
INT Bearish
2.
Swing couldn't sustain Bullish after the Bullish BOS and turned Bearish with NFP news on last Friday.
After a BOS we expect a pullback but be mindful that HTF are looking to target the 4H Swing Low and Daily INT Low so there is a HP we will continue down.
But for me following the structure and expectations, I'll be looking for the Swing Pullback after a bullish iBOS. And most probably will play the Bearish move when we tap into a HTF POI.
3.
15m INT Structure is bearish and we are in the continuation after the Swing BOS.
Price could continue from here bearish to the 4H Swing Low.

BANK NIFTY INTRADAY LEVELS FOR 05/02/2024BUY ABOVE - 46300
SL - 46040
TARGETS - 46500,46670,46890
SELL BELOW - 45910
SL - 46200
TARGETS - 45660,45500,45300
NO TRADE ZONE - 45910 to 46300
Previous Day High - 46890
Previous Day Low - 45910
Based on price action major support & resistance's are here, the red lines acts as resistances, the green lines acts as supports. If the price breaks the support/resistance, it will move to the next support/resistance line. White lines indicates previous day high & low, high acts as a resistance & low acts as a support for next day.
Trendlines are also significant to price action. If the price is above/below the trendlines, can expect an UP/DOWN with aggressive move.
Please NOTE: this levels are for intraday trading only.
Disclaimer - All information on this page is for educational purposes only,
we are not SEBI Registered, Please consult a SEBI registered financial advisor for your financial matters before investing And taking any decision. We are not responsible for any profit/loss you made.
Request your support and engagement by liking and commenting & follow to provide encouragement
HAPPY TRADING 👍

NIFTY INTRADAY LEVELS FOR 05/02/2024BUY ABOVE - 21920
SL - 21860
TARGETS - 21970,22040,22120
SELL BELOW - 21810
SL - 21860
TARGETS - 21740,21670,21580
NO TRADE ZONE - 21810 to 21920
Previous Day High - 22120
Previous Day Low - 21810
Based on price action major support & resistance's are here, the red lines acts as resistances, the green lines acts as supports. If the price breaks the support/resistance, it will move to the next support/resistance line. White lines indicates previous day high & low, high acts as a resistance & low acts as a support for next day.
Trendlines are also significant to price action. If the price is above/below the trendlines, can expect an UP/DOWN with aggressive move.
Please NOTE: this levels are for intraday trading only.
Disclaimer - All information on this page is for educational purposes only,
we are not SEBI Registered, Please consult a SEBI registered financial advisor for your financial matters before investing And taking any decision. We are not responsible for any profit/loss you made.
Request your support and engagement by liking and commenting & follow to provide encouragement
HAPPY TRADING 👍

XAU/USD 02 Feb 2024 Intraday AnalysisH4:
-> Swing: Bullish.
-> Internal Bearish.
-> Has reached EQ.
After the swing BOS price aggressively moved to the upside.
Price printed double bullish iBOS to confirm swing pullback phase is complete.
Currently internal structure remains bearish.
Price has again to reacted to Daily and H4 nested supply levels where we saw a reaction. Price wicked above high of internal structure but failed to close.
Expectation remains as yesterday's analysis, for price to continue to trade bearish to target weak internal low.
H4 chart:
M15:
-> Swing: Bullish.
-> Internal: Bearish.
-> Sub-Internal: Bullish
-> Has reached EQ.
Following swing BOS price very aggressively pushed to the upside.
Price has printed a bullish iBOS where we are now in the pullback phase.
Sub-structure to internal structure, which is marked in red where price has now printed a double bullish iiBOS.
Internal structure has now switched bullish, therefore, price is expected to pull back.
Expectation is for price to target weak internal high once pullback is complete.
M15 Chart:

NASDAQ100 Slows Down For An Intraday CorrectionNasdaq100 is in strong bullish trend and there can be room for more upside within a projected intraday five-wave bullish cycle. Nasdaq100 futures recently slide as Alphabet shares drop on disappointing Google ad revenue. However, that's pretty nice textbook 17300 - 17200 support area within an (a)-(b)-(c) correction for wave "iv", so ahead of today's FED meeting, be aware of a bullish continuation for wave "v". Invalidation level is at 17050.

EURUSD 2 Feb 2024 W5 - Intraday Analysis - NFP Day!This is my Intraday analysis on EURUSD for 2 Feb 2024 W5 based on Smart Money Concept (SMC) which includes the following Time Frames:
4H
15m
4H Chart Analysis
1.
Swing Bullish
INT Bearish
OF Bearish
In Swing Discount
2.
Price made a bullish BOS and after a BOS we expect a pullback.
After mitigating the Weekly Supply zone, price started the Swing pullback phase after a bearish CHoCH.
Price reached the 4H/Daily demand zones as expected after breaking the range and formed a Bullish INT Structure iBOS.
This Bullish iBOS failed to continue Bullish and we changed to Bearish INT Structure which means that the Swing Pullback Phase is not over.
We are also within the 4H Swing Demand/Discount so keep in mind that at anytime the Swing Continuation could start.
More price development needed with the current PA.
3.
As the INT Structure turned Bearish, we resumed again the Swing Pullback which in my opinion going to target the Swing Low.
After iBOS we expected a Pullback, CHoCH is the first sign that the INT Structure Pullback is starting.
Price did the Pullback and failed after to break and close below the Weak INT Low. This leaded to target the High that failed to break the low.
Still the INT is bearish but in point #2 we are assuming that Bullish Swing Continuation could start at any time so this could be the one. Bullish iBOS will be a solid sign for that.
More Price development needed to assess better.
15m Chart Analysis
1.
Swing Bearish
INT Bullish
Swing Extreme
2.
Swing is Bearish after mitigating a HTF Supply.
After a BOS we expect a pullback, INT structure turned Bullish to facilitate the Swing Pullback where we reached the15m Swing Extreme and 4H Supply Zone.
INT Structure still bullish so there is HP to take out this Strong Swing High.
On the Flip side, a failure to create a Bullish BOS and we get a Bearish iBOS will indicate that the Swing Pullback is over and we could be starting the Pro Bearish Swing Move.
Today NFP so be cautious.
3.
15m/4H Demand zones for reaction when reached.

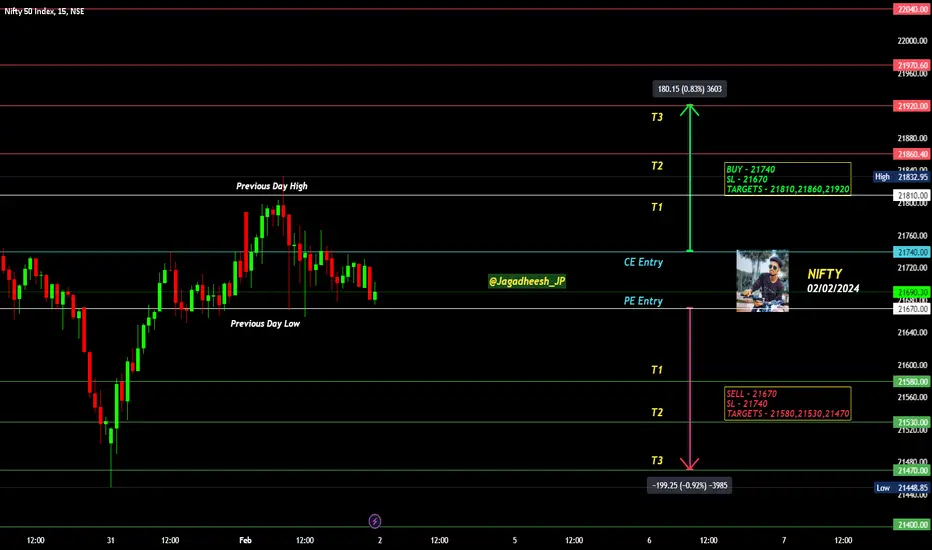
NIFTY INTRADAY LEVELS FOR 02/02/2024BUY ABOVE - 21740
SL - 21670
TARGETS - 21810,21860,21920
SELL BELOW - 21670
SL - 21740
TARGETS - 21580,21530,21470
NO TRADE ZONE - 21670 to 21740
Previous Day High - 21810
Previous Day Low - 21670
Based on price action major support & resistance's are here, the red lines acts as resistances, the green lines acts as supports. If the price breaks the support/resistance, it will move to the next support/resistance line. White lines indicates previous day high & low, high acts as a resistance & low acts as a support for next day.
Trendlines are also significant to price action. If the price is above/below the trendlines, can expect an UP/DOWN with aggressive move.
Please NOTE: this levels are for intraday trading only.
Disclaimer - All information on this page is for educational purposes only,
we are not SEBI Registered, Please consult a SEBI registered financial advisor for your financial matters before investing And taking any decision. We are not responsible for any profit/loss you made.
Request your support and engagement by liking and commenting & follow to provide encouragement
HAPPY TRADING 👍
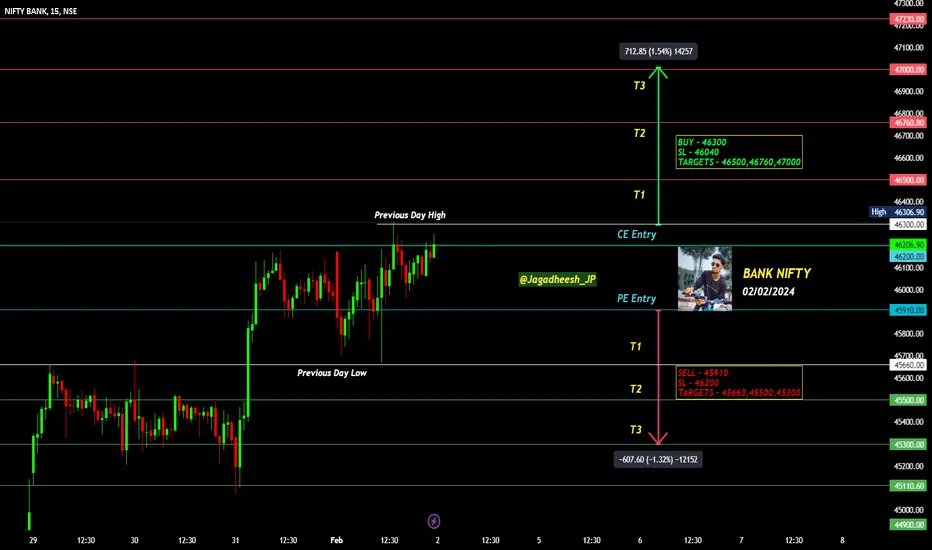
BANK NIFTY INTRADAY LEVELS FOR 02/02/2024BUY ABOVE - 46300
SL - 46040
TARGETS - 46500,46760,47000
SELL BELOW - 45910
SL - 46200
TARGETS - 45660,45500,45300
NO TRADE ZONE - 45910 to 46300
Previous Day High - 46300
Previous Day Low - 45660
Based on price action major support & resistance's are here, the red lines acts as resistances, the green lines acts as supports. If the price breaks the support/resistance, it will move to the next support/resistance line. White lines indicates previous day high & low, high acts as a resistance & low acts as a support for next day.
Trendlines are also significant to price action. If the price is above/below the trendlines, can expect an UP/DOWN with aggressive move.
Please NOTE: this levels are for intraday trading only.
Disclaimer - All information on this page is for educational purposes only,
we are not SEBI Registered, Please consult a SEBI registered financial advisor for your financial matters before investing And taking any decision. We are not responsible for any profit/loss you made.
Request your support and engagement by liking and commenting & follow to provide encouragement
HAPPY TRADING 👍
Review and plan for 2nd February 2024 Nifty future and banknifty future analysis and intraday plan in kannada.
This video is for information/education purpose only. you are 100% responsible for any actions you take by reading/viewing this post.
please consult your financial advisor before taking any action.
----Vinaykumar hiremath, CMT

XAU/USD 01 Fed 2024 Intraday AnalysisH4:
-> Swing: Bullish.
-> Internal Bearish.
-> Has reached EQ.
After the swing BOS price aggressively moved to the upside.
Price printed double bullish iBOS to confirm swing pullback phase is complete.
Currently internal structure remains bearish
Price has reacted to Daily and H4 nested supply levels where we saw a reaction within premium zone of the internal structure.
Expectation remains as yesterday's analysis, for price to continue to trade bearish to target weak internal low.
H4:
M15:
-> Swing: Bullish.
-> Internal: Bearish.
-> Has reached EQ.
Following swing BOS price very aggressively pushed to the upside.
Price has printed a bearish iBOS where we are now in the pullback phase.
Sub-structure to internal structure, which is marked in red where price has now printed a bullish iiBOS.
Yesterday's Fed news regarding holding interest rates did little to affect price action which remains contained within sub-internal structure
Price is currently once again reacting to 50% EQ of the sub-internal range.
Expectation remains the same, for price to target weak internal low.
M15:

EURUSD 1 Feb 2024 W5 - Intraday Analysis - EU CPI - US PMI/JobsThis is my Intraday analysis on EURUSD for 1 Feb 2024 W5 based on Smart Money Concept (SMC) which includes the following Time Frames:
4H
15m
4H Chart Analysis
1.
Swing Bullish
INT Bearish
OF Bearish
In Swing Discount
2.
Price made a bullish BOS and after a BOS we expect a pullback.
After mitigating the Weekly Supply zone, price started the Swing pullback phase after a bearish CHoCH.
Price reached the 4H/Daily demand zones as expected after breaking the range and formed a Bullish INT Structure iBOS.
This Bullish iBOS failed to continue Bullish and we changed to Bearish INT Structure which means that the Swing Pullback Phase is not over.
We are also within the 4H Swing Demand/Discount so keep in mind that at anytime the Swing Continuation could start.
More price development needed with the current PA.
3.
As the INT Structure turned Bearish, we resumed again the Swing Pullback which in my opinion going to target the Swing Low.
After iBOS we expect a Pullback, CHoCH is the first sign that the INT Structure Pullback is starting.
Price made a ChoCH yesterday confirming the INT Low and a Sweep of Liq to continue the bearish INT Structure.
Currently we are going to take this INT Low and there is a high probability that the Swing Low is the target after.
15m Chart Analysis
1.
Swing Bearish
INT Bearish
2.
Swing is Bearish after mitigating a HTF Supply.
After a BOS we expect a pullback, INT structure turned Bullish to facilitate the Swing Pullback where we reached the EQ.
With the news yesterday price Swept Liq above the Strong Swing High and the 4H CHoCH to resume the move to the down side targeting the 15m Weak Swing Low.
Most probably this Swing Low will be broken.
3.
Currently price is in Bearish INT Structure and expectation that we will break the Swing Low.
Just be mindful that Shorts now are not preferred as we are at the end of the move.
Will wait to see if there is option for Pullback plays after the BOS or hold my hands this week for better opportunities next week.
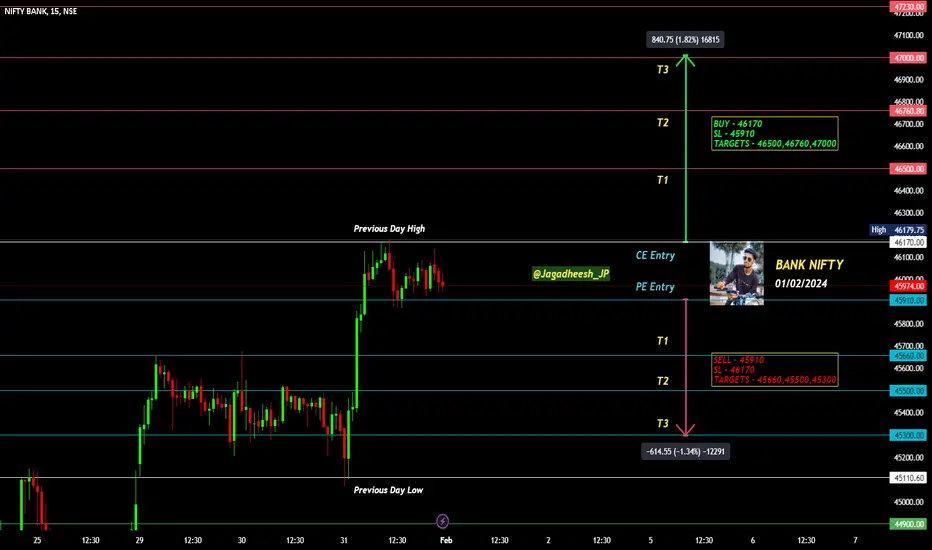
BANK NIFTY INTRADAY LEVELS FOR 01/02/2024BUY ABOVE - 46170
SL - 45910
TARGETS - 46500,46760,47000
SELL BELOW - 45910
SL - 46170
TARGETS - 45660,45500,45300
NO TRADE ZONE - 45910 to 46170
Previous Day High - 46170
Previous Day Low - 45110
Based on price action major support & resistance's are here, the red lines acts as resistances, the green lines acts as supports. If the price breaks the support/resistance, it will move to the next support/resistance line. White lines indicates previous day high & low, high acts as a resistance & low acts as a support for next day.
Trendlines are also significant to price action. If the price is above/below the trendlines, can expect an UP/DOWN with aggressive move.
Please NOTE: this levels are for intraday trading only.
Disclaimer - All information on this page is for educational purposes only,
we are not SEBI Registered, Please consult a SEBI registered financial advisor for your financial matters before investing And taking any decision. We are not responsible for any profit/loss you made.
Request your support and engagement by liking and commenting & follow to provide encouragement
HAPPY TRADING 👍
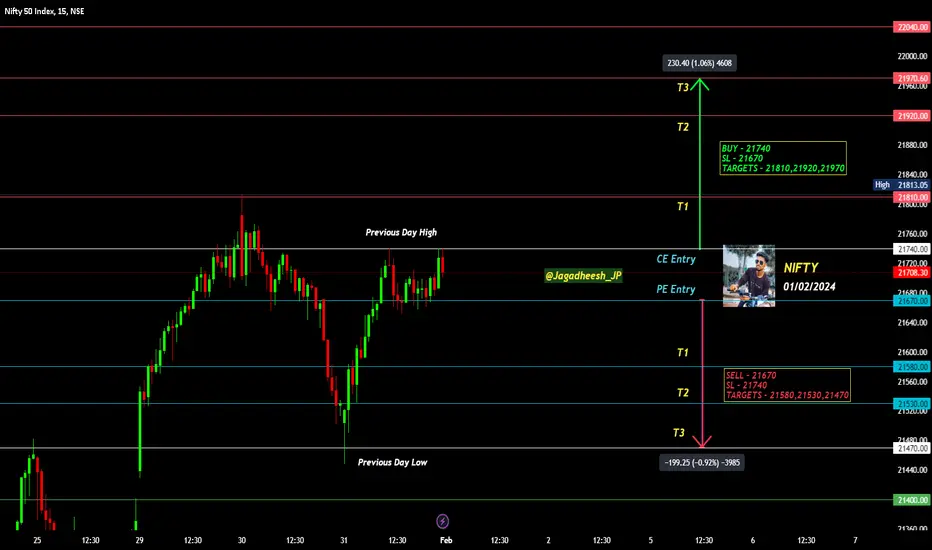
NIFTY INTRADAY LEVELS FOR 01/02/2024BUY ABOVE - 21740
SL - 21670
TARGETS - 21810,21920,21970
SELL BELOW - 21670
SL - 21740
TARGETS - 21580,21530,21470
NO TRADE ZONE - 21470 to 21740
Previous Day High - 21740
Previous Day Low - 21670
Based on price action major support & resistance's are here, the red lines acts as resistances, the green lines acts as supports. If the price breaks the support/resistance, it will move to the next support/resistance line. White lines indicates previous day high & low, high acts as a resistance & low acts as a support for next day.
Trendlines are also significant to price action. If the price is above/below the trendlines, can expect an UP/DOWN with aggressive move.
Please NOTE: this levels are for intraday trading only.
Disclaimer - All information on this page is for educational purposes only,
we are not SEBI Registered, Please consult a SEBI registered financial advisor for your financial matters before investing And taking any decision. We are not responsible for any profit/loss you made.
Request your support and engagement by liking and commenting & follow to provide encouragement
HAPPY TRADING 👍
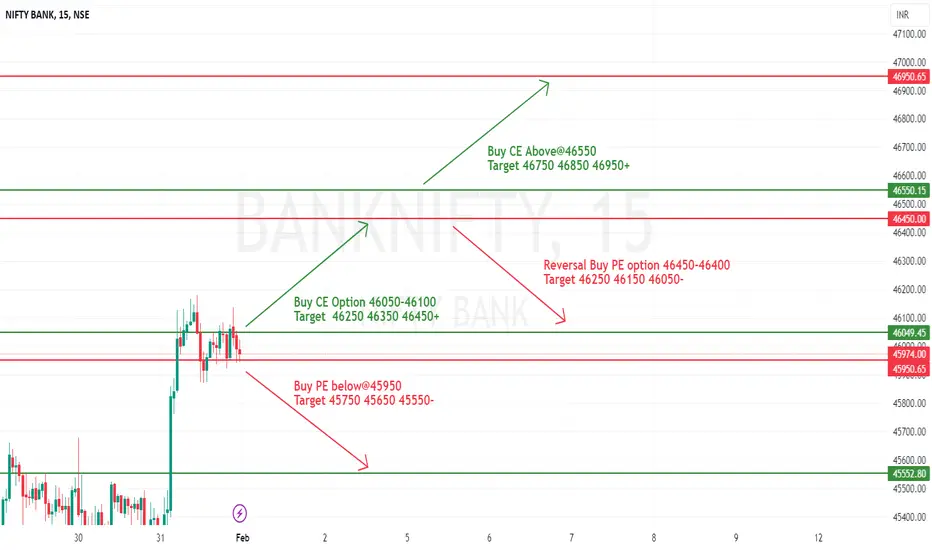
[INTRADAY] #BANKNIFTY PE & CE Levels (01/02/2024) Today will be gap up opening in BANKNIFTY. After opening if banknifty sustain above 46050 level then possible upside rally of 400-500 points upto 46450 level & this rally can extend another 400 points if market give breakout 46550 level.Any Major downside only expected in case banknifty starts trading below 45950 level.also possible reversal downside 46450 level.
XAU/USD 31 Jan 2024 Intraday AnalysisH4 Analysis:
-> Swing: Bullish.
-> Internal Bearish.
-> Has reached EQ.
After the swing BOS price aggressively moved to the upside.
Price printed double bullish iBOS to confirm swing pullback phase is complete.
Currently internal structure remains bearish and trading sideways in a large internal range.
Price has reacted to Daily and H4 nested supply levels where we saw a reaction.
Expectation remains as yesterday's analysis, for price to continue to trade bearish to target weak internal low.
H4 Chart:
M15 Analysis:
-> Swing: Bullish.
-> Internal: Bearish.
-> Has reached EQ.
Following swing BOS price very aggressively pushed to the upside.
Price has printed a bearish iBOS where we are now in the pullback phase.
Sub-structure to internal structure, which is marked in red where price has now printed a bullish iiBOS.
As mentioned yesterday, price could potentially target H4 POI, which it did and rejected sharply where price printed a bearish CHoCH thereby confirming sub-internal range which we continue to trade within.
Price is currently reacting to 50% EQ of the sub-internal range.
Expectation remains the same, for price to target weak internal low.
M15 Chart:

EURUSD 31 Jan 2024 W5 - Intraday Analysis - FOMC Day!This is my Intraday analysis on EURUSD for 31 Jan 2024 W5 based on Smart Money Concept (SMC) which includes the following Time Frames:
4H
15m
4H Chart Analysis
1.
Swing Bullish
INT Bearish
OF Bearish
In Swing Discount
2.
Price made a bullish BOS and after a BOS we expect a pullback.
After mitigating the Weekly Supply zone, price started the Swing pullback phase after a bearish CHoCH.
Price reached the 4H/Daily demand zones as expected after breaking the range and formed a Bullish INT Structure iBOS.
This Bullish iBOS failed to continue Bullish and we changed to Bearish INT Structure which means that the Swing Pullback Phase is not over.
We are also within the 4H Swing Demand/Discount so keep in mind that at anytime the Swing Continuation could start.
More price development needed with the current PA.
3.
As the INT Structure turned Bearish, we resumed again the Swing Pullback which in my opinion going to target the Swing Low.
After iBOS we expect a Pullback, CHoCH is the first sign that the INT Structure Pullback is starting.
We mitigated the 4H Supply and price reacted from there. Currently we don't have a Bullish CHoCH to confirm the INT Structure Pullback started (It's not a must but it's currently my mechanical approach to define Pullbacks).
Price could continue down to create a new low and then the CHoCH position will be changed or Price will try again to create a Bullish CHoCH.
Waiting for more price development
15m Chart Analysis
1.
Swing Bearish
INT Bearish
Reached EQ
2.
Swing turned Bearish again after mitigating a HTF Supply.
After a BOS we expect a pullback, INT structure turned Bullish to facilitate the Swing Pullback where we reached the EQ.
Price reached and mitigated the 15m/4H Supply zones and INT structure turned bearish signaling the 15m Swing Pullback is finished and we are currently Pro Swing aligning with the Bearish Swing as expected.
Expectations is that we will target the Weak Swing Low.
3.
After INT Structure turned bearish (iBOS) we expect a pullback.
The 15m Supply zone within the INT Structure is the only zone that can provide Short opportunity after confirmation.
Be mindful that today there is heavy news for Germany, but the most waited news is the US ADP and FOMC/Powell Conference so volatility will be high.

NIFTY INTRADAY LEVELS FOR 31/01/2024BUY ABOVE - 21580
SL - 21530
TARGETS - 21670,21760,21840
SELL BELOW - 21470
SL - 21530
TARGETS - 21400,21300,21250
NO TRADE ZONE - 21470 to 21580
Previous Day High - 21813
Previous Day Low - 21530
Based on price action major support & resistance's are here, the red lines acts as resistances, the green lines acts as supports. If the price breaks the support/resistance, it will move to the next support/resistance line. White lines indicates previous day high & low, high acts as a resistance & low acts as a support for next day.
Trendlines are also significant to price action. If the price is above/below the trendlines, can expect an UP/DOWN with aggressive move.
Please NOTE: this levels are for intraday trading only.
Disclaimer - All information on this page is for educational purposes only,
we are not SEBI Registered, Please consult a SEBI registered financial advisor for your financial matters before investing And taking any decision. We are not responsible for any profit/loss you made.
Request your support and engagement by liking and commenting & follow to provide encouragement
HAPPY TRADING 👍

BANK NIFTY INTRADAY LEVELS FOR 31/01/2023BUY ABOVE - 45500
SL - 45300
TARGETS - 45660,46000,46240
SELL BELOW - 45300
SL - 45500
TARGETS - 45110,44900,44610
NO TRADE ZONE - 45300 to 45500
Previous Day High - 45660
Previous Day Low - 45300
Based on price action major support & resistance's are here, the red lines acts as resistances, the green lines acts as supports. If the price breaks the support/resistance, it will move to the next support/resistance line. White lines indicates previous day high & low, high acts as a resistance & low acts as a support for next day.
Trendlines are also significant to price action. If the price is above/below the trendlines, can expect an UP/DOWN with aggressive move.
Please NOTE: this levels are for intraday trading only.
Disclaimer - All information on this page is for educational purposes only,
we are not SEBI Registered, Please consult a SEBI registered financial advisor for your financial matters before investing And taking any decision. We are not responsible for any profit/loss you made.
Request your support and engagement by liking and commenting & follow to provide encouragement
HAPPY TRADING 👍

EURUSD 30 Jan 2024 W5 - Intraday Analysis - EU GDP / US JobsThis is my Intraday analysis on EURUSD for 30 Jan 2024 W5 based on Smart Money Concept (SMC) which includes the following Time Frames:
4H
15m
4H Chart Analysis
1.
Swing Bullish
INT Bearish
OF Bearish
In Swing Discount
2.
Price made a bullish BOS and after a BOS we expect a pullback.
After mitigating the Weekly Supply zone, price started the Swing pullback phase after a bearish CHoCH.
Price reached the 4H/Daily demand zones as expected after breaking the range and formed a Bullish INT Structure iBOS.
This Bullish iBOS failed to continue Bullish and we changed to Bearish INT Structure which means that the Swing Pullback Phase is not over.
We are also within the 4H Swing Demand/Discount so keep in mind that at anytime the Swing Continuation could start.
More price development needed with the current PA.
3.
As the INT Structure turned Bearish, we resumed again the Swing Pullback which in my opinion going to target the Swing Low.
After iBOS we expect a Pullback, CHoCH is the first sign that the INT Structure Pullback is starting.
Will be waiting for 15m to align with the 4H request to start a pullback.
15m Chart Analysis
1.
Swing Bearish
INT Bullish
Reached EQ
2.
Swing turned Bearish again after mitigating a HTF Supply.
After a BOS we expect a pullback, INT structure turned Bullish to facilitate the Swing Pullback where we reached the EQ.
Expectation that we are going to target the 15m Weak Swing Low but be mindful that we are currently in Bullish INT Structure.
3.
We are currently in Pullback Phase of the Bullish INT Structure. But after the 4H Bearish iBOS the momentum is to the down side.
Shorts are the preferred option until the 15m Swing turns Bullish to facilitate the 4H INT Bearish Structure Pullback.

[INTRADAY] #BANKNIFTY PE & CE Levels(30/01/2024) Today will be gap up opening in BANKNIFTY. After opening if banknifty sustain above 45550 level then possible upside rally of 400-500 points upto 45950 level & this rally can extend another 400 points if market give breakout 46050 level.Any Major downside only expected in case banknifty starts trading below 45450 level.

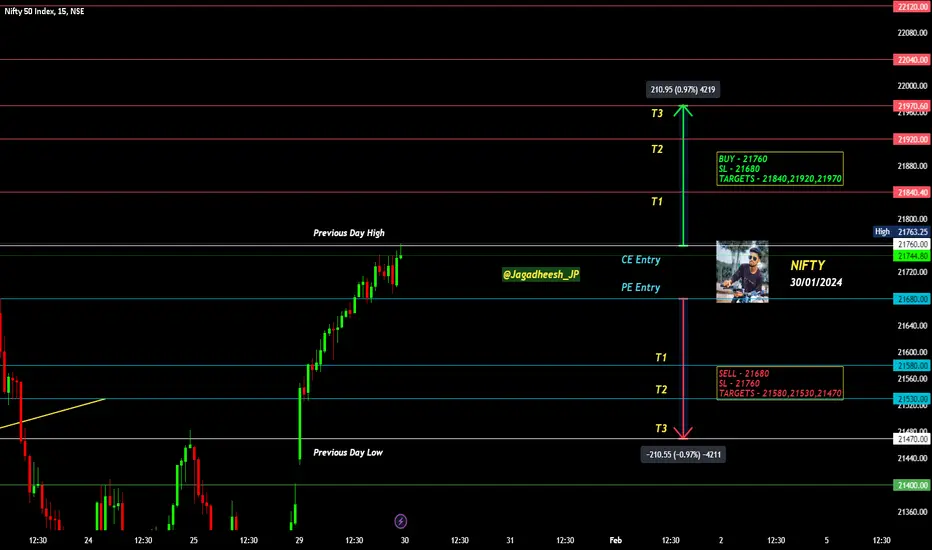
NIFTY INTRADAY LEVELS FOR 30/01/2024BUY ABOVE - 21760
SL - 21680
TARGETS - 21840,21920,21970
SELL BELOW - 21680
SL - 21760
TARGETS - 21580,21530,21470
NO TRADE ZONE - 21680 to 21760
Previous Day High - 21760
Previous Day Low - 21470
Based on price action major support & resistance's are here, the red lines acts as resistances, the green lines acts as supports. If the price breaks the support/resistance, it will move to the next support/resistance line. White lines indicates previous day high & low, high acts as a resistance & low acts as a support for next day.
Trendlines are also significant to price action. If the price is above/below the trendlines, can expect an UP/DOWN with aggressive move.
Please NOTE: this levels are for intraday trading only.
Disclaimer - All information on this page is for educational purposes only,
we are not SEBI Registered, Please consult a SEBI registered financial advisor for your financial matters before investing And taking any decision. We are not responsible for any profit/loss you made.
Request your support and engagement by liking and commenting & follow to provide encouragement
HAPPY TRADING 👍