XAU/USD 29 Jan 2024 Intraday AnalysisH4 Chart Analysis:
-> Swing: Bullish.
-> Internal Bearish.
-> Has reached EQ.
After the swing BOS price aggressively moved to the upside.
Price printed double bullish iBOS to confirm swing pullback phase is complete.
Currently internal structure remains bearish and trading sideways in a large internal range.
Price is currently reacting at H4 supply and 50% EQ.
Expectation remains as previous analysis, for price to continue to trade bearish to target weak internal low.
M15 Chart Analysis:
-> Swing: Bullish.
-> Internal: Bearish.
-> Has reached EQ.
Following swing BOS price very aggressively pushed to the upside.
Price has printed a bearish iBOS where we are now in the pullback phase.
Price has printed a bullish CHoCH which is the first sign (but not confirmation) that internal pullback has initiated. Internal EQ is marked in green.
Sub-structure to internal structure is marked in red where price has printed a bearish iiBOS in line with the internal structure as it is anticipated that price will target M15 internal low as per analysis since Monday this week.
Currently price is trading in premium of the sub-internal structure where price is reacting to nested H4 and M15 supply levels.
Expectation is for price to target weak internal low.
M15:
Intraday

EURUSD 29 Jan 2024 W5 - Intraday AnalysisThis is my Intraday analysis on EURUSD for 29 Jan 2024 W5 based on Smart Money Concept (SMC) which includes the following Time Frames:
4H
15m
4H Chart Analysis
1.
Swing Bullish
INT Bullish
OF Bullish
In Discount
2.
Price made a bullish BOS and after a BOS we expect a pullback.
After mitigating the Weekly Supply zone, price started the Swing pullback phase after a bearish CHoCH.
Price reached the Swing EQ/Discount, mitigating 4H demand zones and ranged.
Price reached the 4H/Daily demand zones as expected after breaking the range and formed a Bullish INT Structure iBOS.
This Bullish iBOS indicates that the 4H Swing Pullback had finished and we are starting the 4H Bullish Swing Continuation Phase to target the Weak 4H Swing High.
3.
Bullish INT Structure after mitigating the 4H/Daily demand Zones.
As we are starting the Swing Continuation Phase, this INT Structure Low is the last structure point to hold for the 4H Swing Continuation Phase.
If it failed, there is a high probability that we will target the 4H Swing Low.
15m Chart Analysis
1.
Swing Bearish
INT Bullish
Reached EQ
2.
Swing turned Bearish after failing at HTF Supply.
After a BOS we expect a pullback, INT structure turned Bullish to facilitate the Swing Pullback where we reached the EQ and mitigated the 4H Supply.
Expectation that we are going to target the 15m Weak Swing Low but be mindful that we are currently in Bullish INT Structure and the 4H Demand formed after sweeping the LIQ below the 4H Strong INT Low.
Wouldn't be much convinced to Short in a 4H Demand Zone. So waiting for more price development.
3.
We are currently in Pullback Phase of the Bullish INT Structure and mitigating the 4H Demand Zone.
With Swing is Bearish and INT Bullish and we are in Swing Discount, it makes it tough for me to prefer a trade. I'd prefer a new structure after the BOS down or iBOS up.

BANK NIFTY INTRADAY LEVELS FOR 29/01/2024BUY ABOVE - 45110
SL - 44900
TARGETS - 45330,45500,45800
SELL BELOW - 44900
SL - 45110
TARGETS - 44610,44430,44270
NO TRADE ZONE - 44900 to 45110
Previous Day High - 45110
Previous Day Low - 44430
Based on price action major support & resistance's are here, the red lines acts as resistances, the green lines acts as supports. If the price breaks the support/resistance, it will move to the next support/resistance line. White lines indicates previous day high & low, high acts as a resistance & low acts as a support for next day.
Trendlines are also significant to price action. If the price is above/below the trendlines, can expect an UP/DOWN with aggressive move.
Please NOTE: this levels are for intraday trading only.
Disclaimer - All information on this page is for educational purposes only,
we are not SEBI Registered, Please consult a SEBI registered financial advisor for your financial matters before investing And taking any decision. We are not responsible for any profit/loss you made.
Request your support and engagement by liking and commenting & follow to provide encouragement
HAPPY TRADING 👍

NIFTY50 INTRADAY LEVELS FOR 29/01/2024BUY ABOVE - 21400
SL - 21330
TARGETS - 21470,21530,21580
SELL BELOW - 21300
SL - 21340
TARGETS - 21250,21210,21130
NO TRADE ZONE - 21300 to 21400
Previous Day High - 21470
Previous Day Low - 21250
Based on price action major support & resistance's are here, the red lines acts as resistances, the green lines acts as supports. If the price breaks the support/resistance, it will move to the next support/resistance line. White lines indicates previous day high & low, high acts as a resistance & low acts as a support for next day.
Trendlines are also significant to price action. If the price is above/below the trendlines, can expect an UP/DOWN with aggressive move.
Please NOTE: this levels are for intraday trading only.
Disclaimer - All information on this page is for educational purposes only,
we are not SEBI Registered, Please consult a SEBI registered financial advisor for your financial matters before investing And taking any decision. We are not responsible for any profit/loss you made.
Request your support and engagement by liking and commenting & follow to provide encouragement
HAPPY TRADING 👍

XAU/USD 26 Jan 2024 Intraday Analysis H4:
-> Swing: Bullish.
-> Internal Bearish.
-> Has reached EQ.
After the swing BOS price aggressively moved to the upside.
Price printed double bullish iBOS to confirm swing pullback phase is complete.
Currently internal structure remains bearish and trading sideways in a large internal range.
Expectation remains as yesterday, for price to continue to trade bearish to target weak internal low.
M15:
-> Swing: Bullish.
-> Internal: Bearish.
-> Has reached EQ.
Following swing BOS price very aggressively pushed to the upside.
Currently price has printed a bearish iBOS where we are now in the pullback phase.
Price has printed a bullish CHoCH which is the first sign (but not confirmation) that internal pullback has initiated. Internal EQ is marked in green.
Sub-structure to internal structure is marked in red where price has printed a bearish iiBOS in line with the internal structure as it is anticipated that price will target M15 internal low as per analysis since Monday this week.
Yesterday's ECB interest rate decision to pause did little to push XAU/USD out of the sub-internal range.

XAUUSD: Unexpected test of $2000 support againHello everyone, gold has experienced a sharp decline since yesterday evening and has entered a consolidation phase with seemingly no change in price for over half a day. The precious metal is trading around $2017 USD and continues to remain stable at this price level.
The price still leans towards a short-term downward outlook due to the reversal signal from the EMA 34 and selling pressure intensifying while the USD weakens but gold continues to decline. Speculators are selling heavily due to concerns about the improving US economy. The Fed may not cut interest rates until March 2024, which has a negative impact on the gold market.

EURUSD 26 Jan 2024 W4 - Intraday Analysis - US PCEThis is my Intraday analysis on EURUSD for 26 Jan 2024 W4 based on Smart Money Concept (SMC) which includes the following Time Frames:
4H
15m
4H Chart Analysis
1.
Swing Bullish
INT Bullish
OF Bullish
In Discount
2.
Price made a bullish BOS and after a BOS we expect a pullback.
After mitigating the Weekly Supply zone, price started the Swing pullback phase after a bearish CHoCH.
Price reached the Swing EQ/Discount, mitigating 4H demand zones and ranged.
Price reached the 4H/Daily demand zones as expected after breaking the range and formed a Bullish INT Structure iBOS.
This Bullish iBOS indicates that the 4H Swing Pullback had finished and we are starting the 4H Bullish Swing Continuation Phase to target the Weak 4H Swing High.
3.
Bullish INT Structure after mitigating the 4H/Daily demand Zones.
As we are starting the Swing Continuation Phase, this INT Structure Low is the last structure point to hold for the 4H Swing Continuation Phase.
If it failed, there is a high probability that we will target the 4H Swing Low.
15m Chart Analysis
1.
Swing Bullish
INT Bearish
INT INT Bearish
At Swing Extreme
2.
Swing turned Bullish after mitigating the 4H/Daily Demand zones as expected yesterday.
After the BOS we expect a 15m Swing pullback which we are already in this phase after the Bearish CHoCH.
INT Structure turned bearish to facilitate the 15m Swing Pullback.
3.
Price currently at the Extreme Swing low and there is a high probability that we are going to take the 15m Strong Swing Low according to the Bearish PA.

XAU/USD 25 Jan 2024 Intraday Analysis-> Swing: Bullish.
-> Internal: Bearish.
-> Has reached EQ.
Following swing BOS price very aggressively pushed to the upside.
Currently price has printed a bearish iBOS where we are now in the pullback phase.
Price has printed a bullish CHoCH which is the first sign (but not confirmation) that internal pullback has initiated. Internal EQ is marked in green.
Sub-structure to internal structure is marked in red where price has printed a bearish iiBOS in line with the internal structure as it is anticipated that price will target M15 internal low as per analysis since Monday this week.

XAU/USD 25 Jan 2024 Intraday Analysis-> Swing: Bullish.
-> Internal Bearish.
-> Has reached EQ.
After the swing BOS price aggressively moved to the upside.
Price printed double bullish iBOS to confirm swing pullback phase is complete.
Currently internal structure remains bearish following second bearish iBOS. Price pulled back to premium 50% EQ and is trading between and internal range.
Expectation remains as yesterday, for price to continue to trade bearish to target weak internal low.

EURUSD 25 Jan 2024 W4 - Intraday Analysis - EU Rate / US GDPThis is my Intraday analysis on EURUSD for 25 Jan 2024 W4 based on Smart Money Concept (SMC) which includes the following Time Frames:
4H
15m
4H Chart Analysis
1.
Swing Bullish
INT Bullish
OF Bullish
In Discount
2.
Price made a bullish BOS and after a BOS we expect a pullback.
After mitigating the Weekly Supply zone, price started the Swing pullback phase after a bearish CHoCH.
Price reached the Swing EQ/Discount, mitigating 4H demand zones and ranged.
Price reached the 4H/Daily demand zones as expected after breaking the range and formed a Bullish INT Structure iBOS.
This Bullish iBOS indicates that the 4H Swing Pullback had finished and we are starting the 4H Bullish Swing Continuation Phase to target the Weak 4H Swing High.
3.
Bullish INT Structure after mitigating the 4H/Daily demand Zones.
As we are starting the Swing Continuation Phase, this INT Structure Low is the last structure point to hold for the 4H Swing Continuation Phase.
If it failed, there is a high probability that we will target the 4H Swing Low.
4H Chart Analysis
1.
Swing Bullish
INT Bullish
INT INT Bearish
Pullback Phase
2.
Swing turned Bullish after mitigating the 4H/Daily Demand zones as expected yesterday.
After the BOS we expect a 15m Swing pullback which we are already in this phase after the Bearish CHoCH.
Currently price reached the EQ and 15m/4H demand zones for potential continuation of the Bullish Swing and targeting the Weak Swing High.
The 4H Demand is big so be cautious of a deeper pullback within the Swing.
My expectations that we will continue Bullish as long we don't close below the 15m Swing Low.
3.
Extreme 15m Swing Demand.

BANK NIFTY INTRADAY LEVELS FOR 25/01/2024BUY ABOVE - 45110
SL - 44900
TARGETS - 45330,45500,45800
SELL BELOW - 44900
SL - 45110
TARGETS - 44700,44550,44390
NO TRADE ZONE - 44900 to 45110
Previous Day High - 45500
Previous Day Low - 44550
Based on price action major support & resistance's are here, the red lines acts as resistances, the green lines acts as supports. If the price breaks the support/resistance, it will move to the next support/resistance line. White lines indicates previous day high & low, high acts as a resistance & low acts as a support for next day.
Trendlines are also significant to price action. If the price is above/below the trendlines, can expect an UP/DOWN with aggressive move.
Please NOTE: this levels are for intraday trading only.
Disclaimer - All information on this page is for educational purposes only,
we are not SEBI Registered, Please consult a SEBI registered financial advisor for your financial matters before investing And taking any decision. We are not responsible for any profit/loss you made.
Request your support and engagement by liking and commenting & follow to provide encouragement
HAPPY TRADING 👍

NIFTY INTRADAY LEVELS FOR 25/01/2024BUY ABOVE - 21470
SL - 21400
TARGETS - 21530,21580,21670
SELL BELOW - 21400
SL - 21470
TARGETS - 21300,21210,21130
NO TRADE ZONE - 21400 to 21470
Previous Day High - 21470
Previous Day Low - 21130
Based on price action major support & resistance's are here, the red lines acts as resistances, the green lines acts as supports. If the price breaks the support/resistance, it will move to the next support/resistance line. White lines indicates previous day high & low, high acts as a resistance & low acts as a support for next day.
Trendlines are also significant to price action. If the price is above/below the trendlines, can expect an UP/DOWN with aggressive move.
Please NOTE: this levels are for intraday trading only.
Disclaimer - All information on this page is for educational purposes only,
we are not SEBI Registered, Please consult a SEBI registered financial advisor for your financial matters before investing And taking any decision. We are not responsible for any profit/loss you made.
Request your support and engagement by liking and commenting & follow to provide encouragement
HAPPY TRADING 👍

XAU/USD 24 Jan 2024 Intraday Analysis-> Swing: Bullish.
-> Internal: Bearish.
-> Has reached EQ.
Following swing BOS price very aggressively pushed to the upside.
Currently price has printed a bearish iBOS where we are now in the pullback phase.
Price has printed a bullish CHoCH which is the first sign (but not confirmation) that internal pullback has initiated. Internal EQ is marked in green.
Sub-structure to internal structure is marked in red.
Internal structure traded past 50% EQ where we saw a reaction at premium. Sub-internal structure is now bullish.
Price could potentially continue bullish, react at H4 supply level to continue bearish.
Price is currently trading sideways between sub-internal structure

XAU/USD 24 Jan 2024 Intraday Analysis-> Swing: Bullish.
-> Internal Bearish.
-> Has reached EQ.
After the swing BOS price aggressively moved to the upside.
Price printed double bullish iBOS to confirm swing pullback phase is complete.
Currently internal structure remains bearish following second bearish iBOS. Price pulled back to premium 50% EQ and is trading between and internal range.
Expectation remains as yesterday, for price to continue to trade bearish to target weak internal low.
Caution at H4 demand price has already reacted from there.

EURUSD 24 Jan 2024 W4 - Intraday Analysis - EU PMI / US PMIThis is my Intraday analysis on EURUSD for 24 Jan 2024 W4 based on Smart Money Concept (SMC) which includes the following Time Frames:
4H
15m
4H Chart Analysis
1.
Swing Bullish
INT Bearish
OF Bullish
In Discount
2.
Price made a bullish BOS and after a BOS we expect a pullback.
After mitigating the Weekly Supply zone, price started the Swing pullback phase after a bearish CHoCH.
Price reached the Swing EQ/Discount, mitigating 4H demand zones and ranged.
Price reached the 4H/Daily demand zones as expected after breaking the range. Still the OF is bearish and if the 4H Bullish swing is going to continue Bullish we need to see bullish reaction at least a bullish CHoCH.
On the flip side, if these demand zones failed to hold, there is a high probability that the Bearish Daily/Weekly structures are in play and we are in a HTF Bearish move.
Let's see the LTF development to have a clear guide.
3.
Price reached the Swing extreme 4H demand and Daily for possible continuation to the upside.
As OF is bearish we need to see the formation of demand at least with a Bullish CHoCH and that demand to hold.
15m Chart Analysis
1.
Swing Bearish
Pullback Phase
2.
Swing continued Bearish with the recent BOS.
After the Swing BOS we expect a Pullback to start, which is currently reacting from the 4H/Daily Demand zones.
As per the structure, expectations that the Swing will continue bearish and there is a potential short plays from the 15m/4H Supply within the Swing. (This will solidify the point that the 4H Swing low is the target)
But be mindful that we had mitigated a HTF POIs (4H/Daily Demands) in a Bullish 4H Swing so there is also high expectations that the current 15m Swing High could be taken out and turn bullish to confirm the 4H Swing Pullback is over and we are in the 4H Bullish Swing Continuation.
Following the structure is the optimum way and we have now 2 scenarios with HTF narratives.
Lets wait for price to guide us.
3.
Price had tapped into 4H/Daily demand zones and initiated the 15m Swing Pullback.
After the ChoCH we will have a confirmed Swing Low.

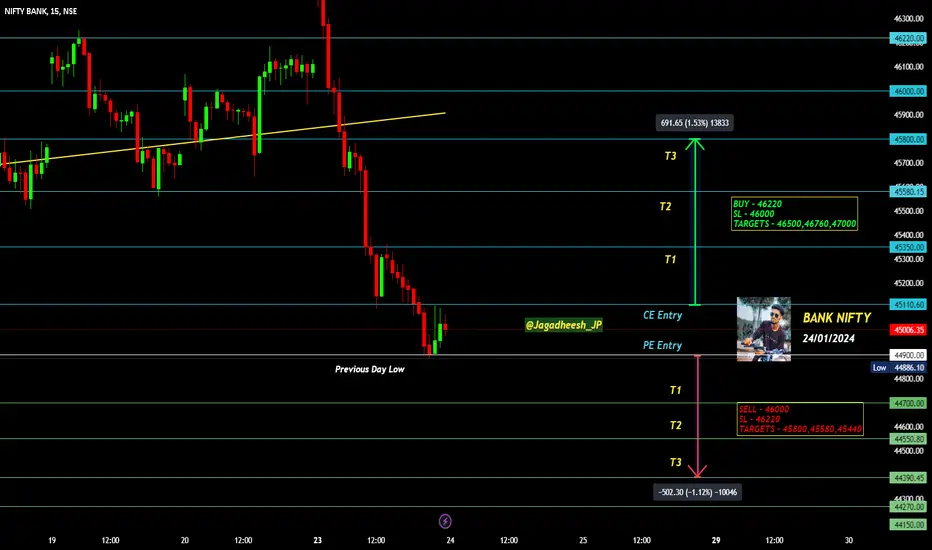
BANK NIFTY INTRADAY LEVELS FOR 24/01/2024BUY ABOVE - 46220
SL - 46000
TARGETS - 46500,46760,47000
SELL BELOW - 46000
SL - 46220
TARGETS - 45800,45580,45440
NO TRADE ZONE - 44900 to 45110
Previous Day High - 46580
Previous Day Low - 44900
Based on price action major support & resistance's are here, the red lines acts as resistances, the green lines acts as supports. If the price breaks the support/resistance, it will move to the next support/resistance line. White lines indicates previous day high & low, high acts as a resistance & low acts as a support for next day.
Trendlines are also significant to price action. If the price is above/below the trendlines, can expect an UP/DOWN with aggressive move.
Please NOTE: this levels are for intraday trading only.
Disclaimer - All information on this page is for educational purposes only,
we are not SEBI Registered, Please consult a SEBI registered financial advisor for your financial matters before investing And taking any decision. We are not responsible for any profit/loss you made.
Request your support and engagement by liking and commenting & follow to provide encouragement
HAPPY TRADING 👍
NIFTY INTRADAY LEVELS FOR 24/01/2024BUY ABOVE - 21300
SL - 21210
TARGETS - 21420,21480,21530
SELL BELOW - 21210
SL - 21300
TARGETS - 21130,21030,20970
NO TRADE ZONE - 21210 to 21300
Previous Day High - 21750
Previous Day Low - 21210
Based on price action major support & resistance's are here, the red lines acts as resistances, the green lines acts as supports. If the price breaks the support/resistance, it will move to the next support/resistance line. White lines indicates previous day high & low, high acts as a resistance & low acts as a support for next day.
Trendlines are also significant to price action. If the price is above/below the trendlines, can expect an UP/DOWN with aggressive move.
Please NOTE: this levels are for intraday trading only.
Disclaimer - All information on this page is for educational purposes only,
we are not SEBI Registered, Please consult a SEBI registered financial advisor for your financial matters before investing And taking any decision. We are not responsible for any profit/loss you made.
Request your support and engagement by liking and commenting & follow to provide encouragement
HAPPY TRADING 👍

AUDCHF I Potential rise to top of the channelWelcome back! Let me know your thoughts in the comments!
** AUDCFH Analysis - Listen to video!
We recommend that you keep this pair on your watchlist and enter when the entry criteria of your strategy is met.
Please support this idea with a LIKE and COMMENT if you find it useful and Click "Follow" on our profile if you'd like these trade ideas delivered straight to your email in the future.
Thanks for your continued support!

XAu/USD 23 Jan 2024 Intraday Analysis-> Swing: Bullish.
-> Internal: Bearish.
-> Has reached EQ.
Following swing BOS price very aggressively pushed to the upside.
Currently price has printed a bearish iBOS where we are now in the pullback phase.
Price has printed a bullish CHoCH which is the first sign (but not confirmation) that internal pullback has initiated. Internal EQ is marked in green.
Sub-structure to internal structure is marked in red.
Internal structure traded past 50% EQ where we saw a reaction at premium. Sub-internal structure is now bullish.
Price could potentially continue bullish, react at H4 supply level to continue bearish.
As per yesterday's analysis, price anticipated to target weak internal low.

XAU/USD 23 Jan 2024 Intraday Analysis -> Swing: Bullish.
-> Internal Bearish.
-> Has reached EQ.
After the swing BOS price aggressively moved to the upside.
Price printed double bullish iBOS to confirm swing pullback phase is complete.
Currently internal structure remains bearish following second bearish iBOS. Price pulled back to premium 50% EQ.
Expectation remains as yesterday, for price to continue to trade bearish to target weak internal low.
Caution at H4 demand price has already reacted from there.

EURUSD 23 Jan 2024 W4 - Intraday Analysis - EU Cons. ConfidenceThis is my Intraday analysis on EURUSD for 23 Jan 2024 W4 based on Smart Money Concept (SMC) which includes the following Time Frames:
4H
15m
Note: Nothing changed much since yesterday and yesterday analysis still the same.
4H Chart Analysis
1.
Swing Bullish
INT Bearish
OF Bullish
In Discount
2.
Price made a bullish BOS and after a BOS we expect a pullback.
After mitigating the Weekly Supply zone, price started the Swing pullback phase after a bearish CHoCH.
Price reached the Swing EQ/Discount, mitigating 4H/Daily demand zones and ranged.
OF currently is bullish after the Bullish CHoCH. Demand formed from the CHoCH is mitigated and still holding. But that Bullish OF is not coming from a HP POI so there is a high probability we will continue down unless we see Bullish OF holding and continuing.
Current targets will be the Daily/4H demand zones and we can wait for price development on LTF to see if we will resume the Bullish Swing or not.
3.
Swing extreme 4H demand and Daily for possible continuation to the upside.
15m Chart Analysis
1.
Swing Bearish
Internal Bullish
Pullback Phase
2.
INT Structure turned Bullish (iBOS) confirming a 15m Swing Low formed and the start of the 15m Swing pullback Phase.
Expectation now is set to play the pullback phase as Bullish move till we reach a HP 4H Supply zone.
Just to note that we didn't mitigate any HTF POI to initiate the current Pullback. So be cautious that we may also continue Bearish till we mitigate the Daily/4H demand zone and from there we could continue the 4H Swing Bullish Continuation Phase.
3.
INT structure continuing Bullish again with Bullish iBOS.
After iBOS we expect a pullback. No HP demand zones except the one presented which is also not positioned well within the new INT Structure.
Waiting for more price development with expectations for price to continue bullish respecting the INT Low.
4.
Weak Swing low is still holding which means that the Swing pullback still active and we will have a deeper swing pullback.

BANK NIFTY INTRADAY LEVELS FOR 23/01/2023BUY ABOVE - 46220
SL - 46000
TARGETS - 46500,46760,47000
SELL BELOW - 46000
SL - 46220
TARGETS - 45800,45580,45440
NO TRADE ZONE - 46000 to 46220
Previous Day High - 46220
Previous Day Low - 45580
Based on price action major support & resistance's are here, the red lines acts as resistances, the green lines acts as supports. If the price breaks the support/resistance, it will move to the next support/resistance line. White lines indicates previous day high & low, high acts as a resistance & low acts as a support for next day.
Trendlines are also significant to price action. If the price is above/below the trendlines, can expect an UP/DOWN with aggressive move.
Please NOTE: this levels are for intraday trading only.
Disclaimer - All information on this page is for educational purposes only,
we are not SEBI Registered, Please consult a SEBI registered financial advisor for your financial matters before investing And taking any decision. We are not responsible for any profit/loss you made.
Request your support and engagement by liking and commenting & follow to provide encouragement
HAPPY TRADING 👍

XAU/USD 22 Jan 2024 Intraday Analysis-> Swing: Bullish.
-> Internal: Bearish.
-> Has reached EQ.
Following swing BOS price very aggressively pushed to the upside.
Currently price has printed a bearish iBOS where we are now in the pullback phase.
Price has printed a bullish CHoCH which is the first sign (but not confirmation) that internal pullback has initiated. Internal EQ is marked in green.
Due to the size of internal structure I have plotted sub-structure to internal structure which is marked in red.
Internal structure traded past 50% EQ where we saw a reaction at premium. Sub-internal structure is bearish.
Price anticipated to target weak internal low.
