EURUSD 22 Jan 2024 W4 - Intraday AnalysisThis is my Intraday analysis on EURUSD for 22 Jan 2024 W4 based on Smart Money Concept (SMC) which includes the following Time Frames:
4H
15m
4H Chart Analysis
1.
Swing Bullish
INT Bearish
OF Bullish
In Discount
2.
Price made a bullish BOS and after a BOS we expect a pullback.
After mitigating the Weekly Supply zone, price started the Swing pullback phase after a bearish CHoCH.
Price reached the Swing EQ/Discount, mitigating 4H/Daily demand zones and ranged.
OF currently is bullish after the Bullish CHoCH. Demand formed from the CHoCH is mitigated and still holding. But that Bullish OF is not coming from a HP POI so there is a high probability we will continue down unless we see Bullish OF holding and continuing.
Current targets will be the Daily/4H demand zones and we can wait for price development on LTF to see if we will resume the Bullish Swing or not.
3.
Swing extreme 4H demand and Daily for possible continuation to the upside.
15m Chart Analysis
1.
Swing Bearish
Internal Bullish
Pullback Phase
2.
INT Structure turned Bullish (iBOS) confirming a 15m Swing Low formed and the start of the 15m Swing pullback Phase.
Expectation now is set to play the pullback phase as Bullish move till we reach a HP 4H Supply zone.
Just to note that we didn't mitigate any HTF POI to initiate the current Pullback. So be cautious that we may also continue Bearish till we mitigate the Daily/4H demand zone and from there we could continue the 4H Swing Bullish Continuation Phase.
3.
INT structure continuing Bullish again with Bullish iBOS.
After iBOS we expect a pullback. No HP demand zones except the one presented which is also not positioned well within the new INT Structure.
Waiting for more price development with expectations for price to continue bullish respecting the INT Low.
4.
Weak Swing low is still holding which means that the Swing pullback still active and we will have a deeper swing pullback.
Intraday

GBPUSD : Regain psychological level 1.270Dear friends, GBPUSD continues to achieve some recovery drivers when he has regained 1,270, but the main trend and long -term trends are still horizontal moving.
The price is approaching 1,072 and GBPUSD are approaching the limit of the Bollinger Band. It is expected that a decrease of adjustment will occur when the money pair reaches the threshold, the goal is the support levels of 1,265 and 1,260.
And you, you think how will GBPSUD move on the weekend trading day!

GBPUSD1H - On the hourly timeframe, we are currently in a long context, with the nearest target being the Friday High. After updating that level, I plan to revise the idea based on the price reaction to the Friday maximum.

EURUSD 1wOn the weekly timeframe, after the shift to a long context in mid-December, we witnessed aggressive movement that also surpassed the fractal maximum. Subsequently, a corrective movement began, with the target of this correction being considered the fractal level at 1.072. It's crucial to note that if the price firmly establishes below 1.072, it will signify a change in context to a short one.

BANK NIFTY INTRADAY LEVELS FOR 20/01/2024BUY ABOVE - 45800
SL - 46660
TARGETS - 46000,46220,46500
SELL BELOW - 45580
SL - 45650
TARGETS - 45440,45260,45090
NO TRADE ZONE - 45580 to 45800
Previous Day High - 46220
Previous Day Low - 45580
Based on price action major support & resistance's are here, the red lines acts as resistances, the green lines acts as supports. If the price breaks the support/resistance, it will move to the next support/resistance line. White lines indicates previous day high & low, high acts as a resistance & low acts as a support for next day.
Trendlines are also significant to price action. If the price is above/below the trendlines, can expect an UP/DOWN with aggressive move.
Please NOTE: this levels are for intraday trading only.
Disclaimer - All information on this page is for educational purposes only,
we are not SEBI Registered, Please consult a SEBI registered financial advisor for your financial matters before investing And taking any decision. We are not responsible for any profit/loss you made.
Request your support and engagement by liking and commenting & follow to provide encouragement
HAPPY TRADING 👍

NIFTY INTRADAY LEVELS FOR 20/01/2024BUY ABOVE - 21670
SL - 21620
TARGETS - 21730,21840,21920
SELL BELOW - 21580
SL - 21630
TARGETS - 21530,21480,21420
NO TRADE ZONE - 21580 to 21670
Previous Day High - 21610
Previous Day Low - 21580
Based on price action major support & resistance's are here, the red lines acts as resistances, the green lines acts as supports. If the price breaks the support/resistance, it will move to the next support/resistance line. White lines indicates previous day high & low, high acts as a resistance & low acts as a support for next day.
Trendlines are also significant to price action. If the price is above/below the trendlines, can expect an UP/DOWN with aggressive move.
Please NOTE: this levels are for intraday trading only.
Disclaimer - All information on this page is for educational purposes only,
we are not SEBI Registered, Please consult a SEBI registered financial advisor for your financial matters before investing And taking any decision. We are not responsible for any profit/loss you made.
Request your support and engagement by liking and commenting & follow to provide encouragement
HAPPY TRADING 👍

XAU/USD 19 Jan 2024 Intraday Analysis -> Swing: Bullish.
-> Internal: Bearish.
-> Has reached EQ.
Following swing BOS price very aggressively pushed to the upside.
Currently price has printed a bearish iBOS where we are now in the pullback phase.
Price has printed a bullish CHoCH which is the first sign (but not confirmation) that internal pullback has initiated. Internal EQ is marked in green.
Expectation is for price to continue bullish and react at M15 and H4 POI's, which it currently is.
Price anticipated to target weak internal low.

XAU/USD 19 Jan 2024 Intraday Analysis -> Swing: Bullish.
-> Internal Bearish.
-> Has reached EQ.
After the swing BOS price aggressively moved to the upside.
Price printed double bullish iBOS to confirm swing pullback phase is complete.
Currently internal structure is bearish. First aggressive structural indication that pullback is underway (CHoCH) where price is reacting at H4 supply zone.
Await for bearish structure formation to target weak swing low priced at 2001.795.

USDJPY : Prices continue to increase ?Hello everyone, what do you think about USDJPY?
Today USDJPY continued to maintain a significant recovery, this pair successfully broke out of the resistance level at 148.10 and moved closer to the new resistance level at 149.635 and the ultimate goal is still to regain the peak near 152.00 .
However, this is still a rather arduous process as it is greatly dependent and influenced by market news. Need to follow more news in the new week to better grasp the trends.
Karina set an increased target as analyzed, what about you? Do you think USDJPY will be strong enough to regain its peak of 152.00?

EURUSD 19 Jan 2024 W3 - Intraday Analysis - EU Con ConfidenceThis is my Intraday analysis on EURUSD for 19 Jan 2024 W3 based on Smart Money Concept (SMC) which includes the following Time Frames:
4H
15m
4H Chart Analysis
1.
Swing Bullish
INT Bearish
OF Bullish
In Discount
2.
Price made a bullish BOS and after a BOS we expect a pullback.
After mitigating the Weekly Supply zone, price started the Swing pullback phase after a bearish CHoCH.
Price reached the Swing EQ/Discount, mitigating 4H/Daily demand zones and ranged.
OF currently is bullish after the Bullish CHoCH. Demand formed from the CHoCH is mitigated and still holding. But that Bullish OF is not coming from a HP POI so there is a high probability we will continue down unless we see Bullish OF holding and continuing.
Current targets will be the Daily/4H demand zones and we can wait for price development on LTF to see if we will resume the Bullish Swing or not.
3.
Swing extreme demand for possible continuation to the upside.
15m Chart Analysis
1.
Swing Bearish
Internal Bullish
Pullback Phase
2.
INT Structure turned Bullish (iBOS) confirming a 15m Swing Low formed and the start of the 15m Swing pullback Phase.
Expectation now is set to play the pullback phase as Bullish move till we reach a HP 4H Supply zone.
Just to note that we didn't mitigate any POI to initiate the current Pullback. So be cautious that we may also continue Bearish till we mitigate the Daily/4H demand zone and from there we could continue the 4H Swing Bullish Continuation Phase.
3.
Currently the new INT structure is Bullish and we had reached the extreme and price respected the INT Low and continued up.
Expectation that we are going to target the INT High as long we respect the Swing Low.
Also there is a high probability that we may break the Swing low as we didn't mitigate any HP POI to initiate a pullback.

BANK NIFTY INTRADAY LEVELS FOR 19/01/2024BUY ABOVE - 45800
SL - 46660
TARGETS - 46000,46180,46340
SELL BELOW - 45490
SL - 45660
TARGETS - 45260,45090,44950
NO TRADE ZONE - 45490 to 45800
Previous Day High - 46180
Previous Day Low - 45490
Based on price action major support & resistance's are here, the red lines acts as resistances, the green lines acts as supports. If the price breaks the support/resistance, it will move to the next support/resistance line. White lines indicates previous day high & low, high acts as a resistance & low acts as a support for next day.
Trendlines are also significant to price action. If the price is above/below the trendlines, can expect an UP/DOWN with aggressive move.
Please NOTE: this levels are for intraday trading only.
Disclaimer - All information on this page is for educational purposes only,
we are not SEBI Registered, Please consult a SEBI registered financial advisor for your financial matters before investing And taking any decision. We are not responsible for any profit/loss you made.
Request your support and engagement by liking and commenting & follow to provide encouragement
HAPPY TRADING 👍

NIFTY INTRADAY LEVELS FOR 19/01/2024BUY ABOVE - 21540
SL - 21480
TARGETS - 21610,21680,21730
SELL BELOW - 21420
SL - 21480
TARGETS - 21300,21210,21130
NO TRADE ZONE - 21420 to 21540
Previous Day High - 21540
Previous Day Low - 21300
Based on price action major support & resistance's are here, the red lines acts as resistances, the green lines acts as supports. If the price breaks the support/resistance, it will move to the next support/resistance line. White lines indicates previous day high & low, high acts as a resistance & low acts as a support for next day.
Trendlines are also significant to price action. If the price is above/below the trendlines, can expect an UP/DOWN with aggressive move.
Please NOTE: this levels are for intraday trading only.
Disclaimer - All information on this page is for educational purposes only,
we are not SEBI Registered, Please consult a SEBI registered financial advisor for your financial matters before investing And taking any decision. We are not responsible for any profit/loss you made.
Request your support and engagement by liking and commenting & follow to provide encouragement
HAPPY TRADING 👍

XAU/USD 18 Jan 2024 Intraday Analysis-> Swing: Bullish.
-> Internal: Bearish.
-> Has reached EQ.
Following swing BOS price very aggressively pushed to the upside.
Currently price has printed a bearish iBOS where we are now in the pullback phase.
Price has printed a bullish CHoCH which is the first sign (but not confirmation) that internal pullback has initiated. Internal EQ is marked in green.
Expectation is for price to continue bullish and react at M15 POI's, however, POI's are positioned in discount.

XAU/USD 18 Jan 2024 Intraday Analysis-> Swing: Bullish.
-> Internal Bearish.
-> Has reached EQ.
After the swing BOS price aggressively moved to the upside.
First structural sign of pullback initiation was the bearish iBOS. Price pulled back to beyond EQ where we saw reaction at POI's.
Price printed double bullish iBOS to confirm swing pullback phase is complete.
Currently internal structure is bearish. After iBOS we expect pullback which is underway. CHoCH and H4 supply POI where price is anticipated to react, however, it is to be approached with caution as POI is positioned in discount.
Price did as anticipated with weak internal low being targeted priced at 2013.390.

EURUSD 18 Jan 2024 W3 - Intraday Analysis - ECB MinutesThis is my Intraday analysis on EURUSD for 18 Jan 2024 W3 based on Smart Money Concept (SMC) which includes the following Time Frames:
4H
15m
4H Chart Analysis
1.
Swing Bullish
INT Bearish
OF Bullish
In Discount
2.
Price made a bullish BOS and after a BOS we expect a pullback.
After mitigating the Weekly Supply zone, price started the Swing pullback phase after a bearish CHoCH.
Price reached the Swing EQ/Discount, mitigating 4H/Daily demand zones and ranged.
OF is bearish within the Swing Pullback phase signaling that we still looking for deeper pullback to the next Daily/4H Demand zones.
Current targets will be the Daily/4H demand zones and we can wait for price development on LTF to see if we will resume the Bullish Swing or not.
3.
Swing extreme demand for possible continuation to the upside.
15m Chart Analysis
1.
Swing Bearish
Internal Bullish
Pullback Phase
2.
Finally we are out of the range where the 15m Swing turned bearish signaling the expectation that if the Swing turned bearish then the 4H is having a deep pullback phase within the 4H Bullish Swing.
After a BOS we expect a pullback phase to initiate and we will be looking for Bullish iBOS to confirm Swing Low and the initiation of the Swing pullback.
I'll be cautious that after range we were in the momentum will be aggressive and pullback may not happen directly and following the current INT structure will be the safe option.
3.
INT Structure turned Bullish (iBOS) confirming a 15m Swing Low formed and the start of the 15m Swing pullback Phase.
Expectation now is set to play the pullback phase as Bullish move till we reach a HP 4H Supply zone.
Just to note that we didn't mitigate any POI to initiate the current Pullback. So be cautious that we may also continue Bearish till we mitigate the Daily/4H demand zone and from there we could continue the 4H Swing Bullish Continuation Phase.

[INTRADAY] #BANKNIFTY PE & CE Levels(18/01/2024) Today will be gap down opening in BANKNIFTY. After opening if banknifty start trading below 45950 level then possible downside rally of 400-500 points upto 45550 Level in todays session.Any Major upside only expected in case banknifty starts trading above 46050 level to 46450 level.

LTTS is facing ResistanceLTTS can be a good buy or sell for tomorrow as it is an all-time high.
If it breaks the level of 5560 then take buy-side trade but be careful as the market is bearish and you are on an all-time high.
And if it gives any rejection candle in 5 min. timeframe and confirm its reversal move by another bearish candle then take the sell side trade and targets can be 5546,5526. Further, it can also fill the gap and the target would be 5388 i.e. 200 EMA.

Short Sell SAILSell it if it breaks the level of 112.5 and closes the candle below this level in 5 min. timeframe.
Targets can be 111.4,109.6 as it have a clear range on the left-hand side.
Happy Trading!!

Short Sell TATACHEMIf it breaks the low of 1080 in a 1h timeframe, its next target can be 1040,1027.

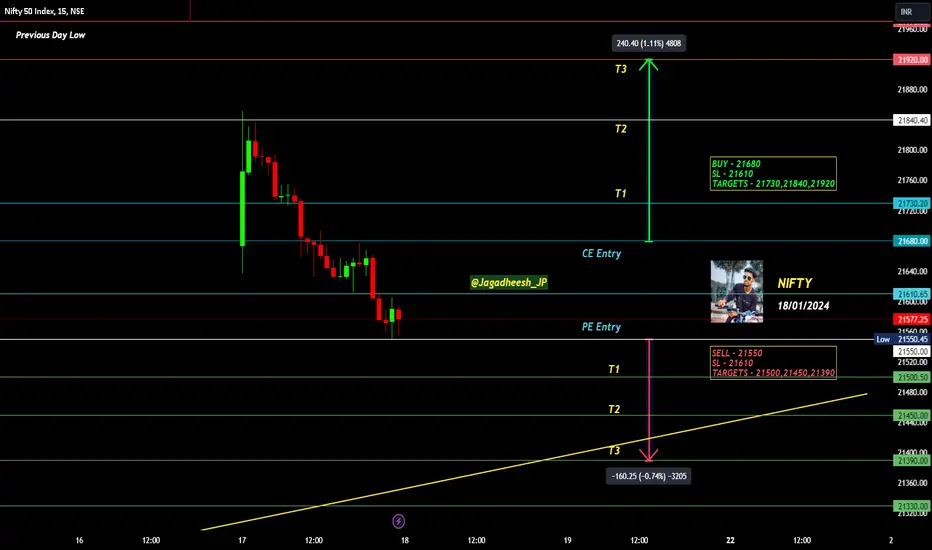
NIFTY INTRADAY LEVELS FOR 18/01/2024BUY ABOVE - 21680
SL - 21610
TARGETS - 21730,21840,21920
SELL BELOW - 21550
SL - 21610
TARGETS - 21500,21450,21390
NO TRADE ZONE - 21550 to 21680
Previous Day High - 21840
Previous Day Low - 21550
Based on price action major support & resistance's are here, the red lines acts as resistances, the green lines acts as supports. If the price breaks the support/resistance, it will move to the next support/resistance line. White lines indicates previous day high & low, high acts as a resistance & low acts as a support for next day.
Trendlines are also significant to price action. If the price is above/below the trendlines, can expect an UP/DOWN with aggressive move.
Please NOTE: this levels are for intraday trading only.
Disclaimer - All information on this page is for educational purposes only,
we are not SEBI Registered, Please consult a SEBI registered financial advisor for your financial matters before investing And taking any decision. We are not responsible for any profit/loss you made.
Request your support and engagement by liking and commenting & follow to provide encouragement
HAPPY TRADING 👍
BANK NIFTY INTRADAY LEVELS FOR 18/01/2024BUY ABOVE - 46260
SL - 46000
TARGETS - 46500,46760,47000
SELL BELOW - 46000
SL - 46200
TARGETS - 45800,45660,45490
NO TRADE ZONE - 46000 to 46260
Previous Day High - 47230
Previous Day Low - 46000
Based on price action major support & resistance's are here, the red lines acts as resistances, the green lines acts as supports. If the price breaks the support/resistance, it will move to the next support/resistance line. White lines indicates previous day high & low, high acts as a resistance & low acts as a support for next day.
Trendlines are also significant to price action. If the price is above/below the trendlines, can expect an UP/DOWN with aggressive move.
Please NOTE: this levels are for intraday trading only.
Disclaimer - All information on this page is for educational purposes only,
we are not SEBI Registered, Please consult a SEBI registered financial advisor for your financial matters before investing And taking any decision. We are not responsible for any profit/loss you made.
Request your support and engagement by liking and commenting & follow to provide encouragement
HAPPY TRADING 👍

XAU/USD 17 Jan 2024 Intraday Analysis-> Swing: Bullish.
-> Internal: Bullish.
-> Has reached EQ.
Following swing BOS price very aggressively pushed to the upside.
Currently price has printed a bullish iBOS where we are now in the pullback phase of the bullish iBOS.
Price has reacted at M15 POI's where we are now approaching internal EQ.
Expectation is for price to target weak internal low priced at 2013.390, however, price is reacting at H4 POI's.

XAU/USD H4 ANALYSIS-> Swing: Bullish.
-> Internal Bearish.
-> Has reached EQ.
After the swing BOS price aggressively moved to the upside.
First structural sign of pullback initiation was the bearish iBOS. Price pulled back to beyond EQ where we saw reaction at POI's.
Price printed double bullish iBOS to confirm swing pullback phase is complete.
Currently internal structure is bearish. After iBOS we expect pullback which is underway
Price is trading near extreme internal low and reacting at H4 POI.
Expectation is for price to target weak internal low priced at 2013.390.
