Learning#04 : PDH & PDL🎯 Learning#04 : PDH & PDL
- The 2 Levels Every Intraday Trader Must Watch
Turn Yesterday’s Levels into Today’s Profits – PDH/PDL Playbook
In intraday trading, simplicity often beats complexity.
You don’t always need fancy indicators, dozens of lines, or complicated systems. Sometimes, two levels are all it takes to stay in sync with the market:
👉 Previous Day’s High (PDH)
👉 Previous Day’s Low (PDL)
These levels may look basic, but they carry psychological weight and often mark where real action — and opportunity — unfolds.
Let’s break it down into a practical strategy you can start using as early as tomorrow morning 👇
🧠 What Are PDH and PDL?
PDH = The highest price the market reached yesterday
PDL = The lowest price the market reached yesterday
That’s it. No calculations. No indicators. Just two simple levels from the previous session.
But here’s why they matter:
They’re visible to everyone — retail traders, institutional desks, even algo systems. These are “memory zones” where the market often reacts — bouncing, breaking, or trapping traders in fakeouts.
Think of them as psychological boundaries.
When price approaches these levels, traders ask:
“Will it break or bounce?”
That hesitation — that moment of decision — is your opportunity.
⚡ Why These Levels Work So Well
✅ They’re objective — no subjectivity involved. Anyone can mark them.
✅ They’re reaction zones — price often stalls, breaks, or rejects here.
✅ They reflect sentiment — how price behaves around them reveals market strength or weakness.
PDH and PDL often act like turning points — or springboards for continuation. The key is in reading how price behaves when it gets there.
📊 3 Smart Ways to Trade Around PDH/PDL
Let’s look at three powerful setups based on how price behaves near these levels:
1️⃣ Rejection at PDH or PDL (Classic Reversal)
This is the simplest setup — and one of the most effective.
When price tests PDH or PDL but fails to break, it often leaves signs:
Long upper/lower wicks
Rejection candles (like pin bars or inside bars)
Sudden volume drop
💡 Example:
Nifty rallies to PDH at 22,180, prints a long upper wick, then forms a red candle closing below. That’s a reversal clue.
You could enter short below the rejection candle, with a stop just above the high and a target near VWAP or mid-range.
🎯 Why this setup works: Tight risk. Logical context. High clarity.
2️⃣ Breakout and Retest (Trend Continuation)
If price breaks through PDH/PDL with strength, don’t chase it.
Wait for price to pull back and retest the level.
If PDH was broken, wait for a bullish retest — former resistance becomes support.
If PDL was broken, wait for a bearish retest — former support becomes resistance.
💡 Example:
BankNifty breaks PDH, pulls back, then prints a bullish engulfing candle right at the level — confirmation to go long.
📌 This setup works best on trending days and offers cleaner entries than chasing breakouts.
3️⃣ The Failed Breakout (Trap Setup)
One of the most high-probability setups — and one that traps many.
Here’s how it plays out:
Price breaks PDH/PDL
But immediately snaps back inside the range
Traders who chased the breakout are now trapped
💡 Signal to watch:
A candle closes above PDH, followed by a candle that closes back below — that’s your short signal. Reverse for long setups around PDL.
🚨 Even more effective when the breakout happens on low volume — no real conviction behind the move.
🔧 Tools That Amplify These Setups
These setups work great with a clean chart — but a few tools can boost your edge:
VWAP: Check if price is extended or supported near PDH/PDL. When VWAP aligns with these levels — confluence zone!
Candlestick patterns: Look for pin bars, inside bars, or engulfing patterns at the level.
Opening range: If price breaks PDH/PDL early in the day,
especially within the first 30 minutes, it signals directional intent.
Volume: Strong breakouts need volume. Weak volume = likely fakeout.
🔑 Remember: You don’t trade the level — you trade the reaction at the level.
✅ Why This Simple Strategy Works
Don’t underestimate the power of PDH and PDL. These levels:
Show where emotions exist — greed and fear often play out here.
Create natural reaction zones — ideal spots for clean entries and exits.
Let you trade with structure, not guesswork.
Instead of chasing price all day, do this:
Mark PDH and PDL
Wait for price to approach the zone
Watch how it behaves
React with a plan — not emotion
✨ Simple, repeatable, and highly effective — if you stay patient and disciplined.
✍️ Final Thoughts
In a world full of overcomplicated strategies, PDH/PDL trading is a refreshing reminder that clarity often comes from simplicity.
These levels won’t give you 10 trades a day — but they will give you high-quality, context-driven opportunities that align with how real price and volume work.
See you in the next one — and until then:
Keep it simple. Trade with structure. Trust the levels.
— Kiran Zatakia
Intradaystrategy

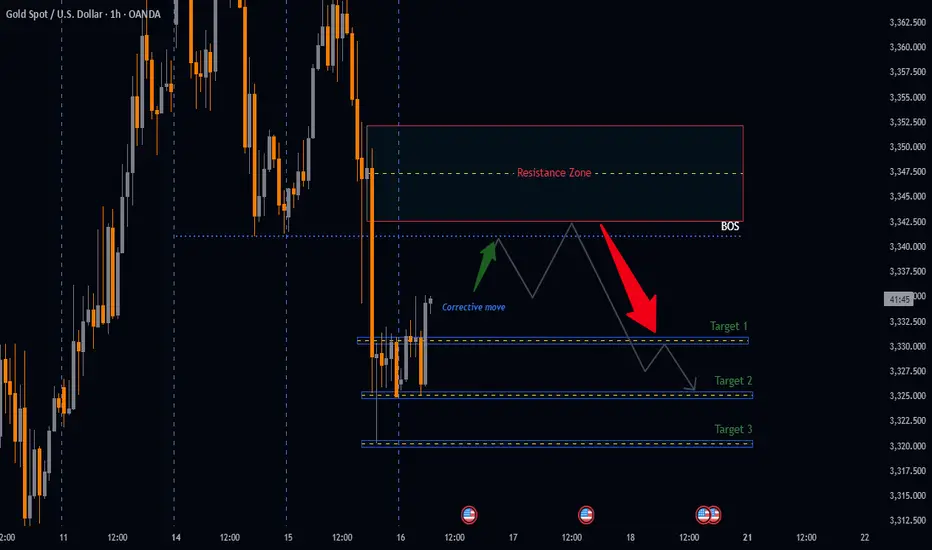
GOLD: A Bearish Trading SetupBearish Breakdown Setup
**Summary
Analysing Price action from yesterday we have got a very nice distribution leg push that broke down below our accumulation zone a good indication of downside momentum, therefore the anticipation is that price will retest our BOS an ideal zone to look for bearish setups.
📉 XAUUSD Daily Breakdown Potential setup
🔴 Distribution leg: 3366.425 - 3320.305
📉 Sell level: 3341 (BOS)
🎯 Target 1: R:R 1:2
🎯 Target 2: R:R 1:3
🎯 Target 3: R:R 1:4
🛑 Stop Loss: Above Resistance Zone
🔍 Watch: Failure to break back in = Confirmation
LIKE or COMMENT if this idea sparks your interest, or share your thoughts below!
FOLLOW to keep up with fresh ideas.
Tidypips: "Keep It Clean, Trade Mean!"
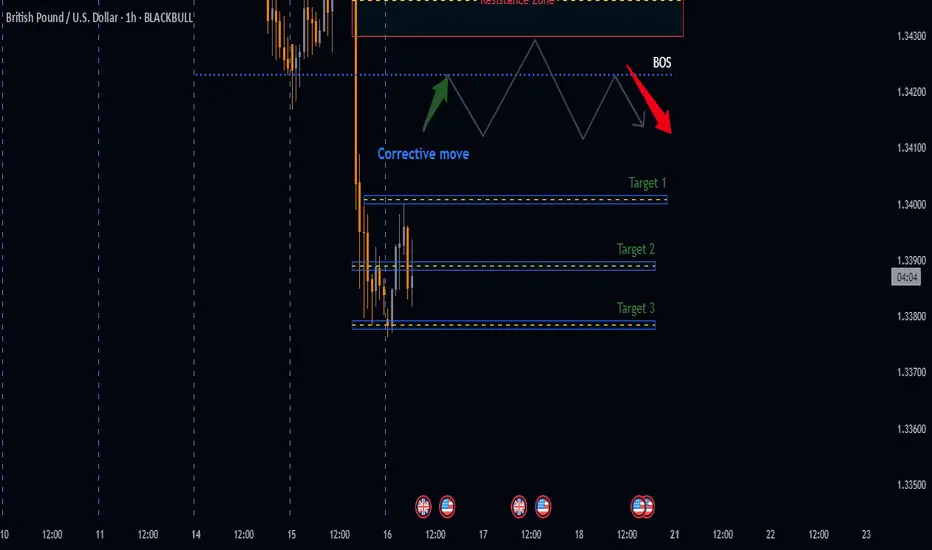
Potential Bearish Setup for GBPUSDBearish Breakdown Setup
**Summary
Analysing Price action from yesterday we have got a very nice distribution leg push that broke down below our accumulation zone a good indication of downside momentum, therefore the anticipation is that price will retest our BOS an ideal zone to look for bearish setups.
📉 GBPUSD Daily Breakdown Potential setup
🔴 Distribution leg: 1.34588 - 1.33785
📉 Sell level: 1.34230 (Confirmed Break)
🎯 Target 1: R:R 1:2
🎯 Target 2: R:R 1:3
🎯 Target 3: R:R 1:4
🛑 Stop Loss: Above Resistance Zone
🔍 Watch: Failure to break back in = Confirmation
LIKE or COMMENT if this idea sparks your interest, or share your thoughts below!
FOLLOW to keep up with fresh ideas.
Tidypips: "Keep It Clean, Trade Mean!"
Potential Bearish Setup on EURUSDBearish Breakdown Setup
Summary
Analysing Price action from yesterday we have got a very nice distribution leg push that broke down below our accumulation zone a good indication of downside momentum, therefore the anticipation is that price will retest our BOS an ideal zone to look for bearish setups.
📉 EURUSD Daily Breakdown Potential setup
🔴 Distribution leg: 1.16921 - 1.15924
📉 Sell Below: 1.16540 (Confirmed Break)
🎯 Target 1: R:R 1:2
🎯 Target 2: R:R 1:3
🎯 Target 3: R:R 1:4
🛑 Stop Loss: Above Resistance Zone
🔍 Watch: Failure to break back in = Confirmation
LIKE or COMMENT if this idea sparks your interest, or share your thoughts below!
FOLLOW to keep up with fresh ideas.
Tidypips: "Keep It Clean, Trade Mean!"

Golden Rejection Candle Strategy–Catch Explosive Intraday Moves!Hello Trader!
Are you tired of buying options and watching premiums die slowly?
Or chasing breakouts that reverse the moment you enter?
Here’s your solution – the Golden Rejection Candle Strategy , designed especially for option buyers who want timed entries, fast momentum, and defined risk .
What is a Golden Rejection Candle?
A special candlestick that forms when price hits a strong level (like VWAP, trendline, or demand/supply zone) and gets instantly rejected.
It leaves behind a long wick (shadow), showing that buyers or sellers stepped in with force .
This candle often marks the start of a sharp intraday reversal .
It's not just a random wick — it’s a smart money footprint .
Live Chart Example – Nifty Spot vs Option Premium (23950 CE)
Date: 9th May 2025
Timeframe: 1 min (Spot), 1 min (Options)
Spot Chart Setup: Nifty approached a marked green support zone and created a strong wick rejection with a small body candle — classic sign of buyers defending the level.
Confirmation Candle: The next candle broke above the rejection candle’s high, confirming the reversal setup.
Premium Reaction: On the 1-min ATM Option chart (23950 CE), premiums jumped from 270 to 344 – a clean 26% gain within few minutes.
Risk-Reward Snapshot: Entry was at breakout, SL just below rejection wick, and target hit in a single momentum burst — the kind of move option buyers live for.
How to Trade It as an Option Buyer
Choose the Right Strike: Use ATM or slightly ITM options to get faster movement when price reverses.
Entry Strategy: Wait for the next candle to break the rejection candle’s high/low. No break = No trade.
SL Placement: Keep it just beyond the wick. Small loss if wrong, big reward if right.
Exit Plan: Aim for intraday resistance/support or spike-based exits — option premiums often give quick moves post-rejection.
What NOT to Do:
Don’t enter on the rejection candle itself — wait for confirmation.
Avoid trading this pattern in low volume or middle of the range.
Don’t hold blindly — if premium spikes, take the money and run!
Rahul’s Tip:
“Sudden reversals are where option buyers make money — not slow trends. The rejection candle shows intent. The breakout shows confirmation. Combine both.”
Conclusion:
The Golden Rejection Candle Strategy gives you an edge that most random trades lack — timing, context, and structure.
If you're an option buyer, this can be your go-to setup to avoid traps and enter only when smart money steps in.
No more guessing. No more fear.
Just clean, price-action-based entries that make sense.
👇 Have you ever used rejection-based setups? Drop your favorite trade below! Let’s learn together.
If you found this post valuable, don't forget to LIKE and FOLLOW!
I regularly share real-world trading setups, actionable strategies, and learning-focused content — all from real trading experience , not theory . Stay connected if you're serious about growing as a trader!

Gold prices bottomed out and rebounded, market trend analysis.Analysis of gold trend: From the perspective of market sentiment, interest-free gold as a safe-haven asset has performed strongly this year, with prices soaring by nearly $700 and hitting record highs several times. However, the recent optimistic expectations of easing global economic and trade relations have boosted market risk appetite, and the equity market has generally performed positively. Some funds have flowed out of safe-haven assets such as gold and turned to risky assets, which is also the main psychological factor under pressure on gold prices. If market risk appetite continues to improve, global economic and trade relations further ease, and the US dollar strengthens, gold prices may face greater downward pressure. From a technical point of view, the gold price needs to effectively fall below the $3,265-3,260 range in the short term before a larger correction downward may be confirmed. Once confirmed to fall below, the gold price may quickly fall to the 50% retracement level near $3,225, further pointing to the $3,200 mark. If $3,200 is lost, it will suggest that gold may have peaked in the short term.
Gold opened higher in the Asian session on Monday and continued to fall last week after hitting 3336. The idea of the Asian session was to directly bearish at the analysis point of 3277. After hitting the lowest point of 3268, it fluctuated upward. The European session also fell to 3273 and then rebounded. The highest point in the US session just reached 3336 again, a standard bottoming and rebounding trend. Since it is an adjustment structure, let's re-analyze the idea. The gold price fell at 3500 and rebounded at 3260 last Wednesday. The rhythm was volatile. It rebounded above 3260 many times below and did not cross the first rebound high of 3367 above.
Today, we mainly focus on the closing price. If it stands firmly at the 3313 line, we will adjust our thinking on Tuesday. On the contrary, it will fall back after encountering resistance at 3336, today's opening high, and go to 3278. On Tuesday, we will continue to look at the idea of swinging and falling. Now it is the end of the market, and the market is also falling from a high.

How to Trade After Major News Events – The 15-Min Trap SetupHello Traders!
We all get excited when major news hits the market — whether it’s budget day, RBI policy, US inflation data, or company results . But jumping in too early can be a trap. Smart money often creates fake moves in the first few minutes. That’s where the 15-Min Trap Setup becomes a powerful tool for intraday traders.
Let me show you how to avoid traps and catch real moves after news events.
Why the First 15 Minutes Matter
Emotions are high: Retail traders often react instantly without confirmation. This creates liquidity for big players.
Fake breakouts happen often: Price breaks key levels in the first candle — then reverses and traps traders.
Volume is misleading: The biggest volume often comes early, but the real direction is seen later.
The 15-Min Trap Setup – How It Works
Step 1: Wait for the first 15-minute candle to close after a big news event — don’t trade before that.
Step 2: Mark the high and low of this 15-minute candle.
Step 3: Wait for a fake breakout above or below that range — if price breaks out but quickly comes back inside, it’s a trap.
Step 4: Enter in the opposite direction of the breakout after confirmation — ride the real move.
When to Use This Strategy
Major economic events – like Fed decisions, budget day, inflation data, RBI policies.
Company results – high-impact earnings or news releases.
Gap up/gap down openings after big global cues.
Rahul’s Tip
Don’t react — observe. Let the market show its trap. Big players love early overconfidence. Use their game to your advantage by planning around the 15-min candle.
Conclusion
The 15-Min Trap Setup helps you avoid emotional trades and catch the real move after major news. Be patient, mark your zones, and strike when the trap is confirmed. This simple rule can completely change your intraday game.
Have you ever been trapped in the first candle after news? Let’s share experiences below and grow together!

Catching Intraday Trades like a PRO!!Hows the Josh?
High, sir!
--------------
Attaching today's intraday positions, all in profit, for your motivation.
Have a great weekend, wonderful people!
Stay strong!


XAU/USD 05 April 2024 Intraday AnalysisH4 Analysis:
-> Swing: Bullish.
-> Internal: Bullish.
Gold continues it's bullish run following the Fed's dovish outlook.
Price has printed further highs since yesterday's highs (04-04-2024) where we continue to trade within a fractal high and internal low.
As mentioned on 22/03/2024, Intraday expectation was for price to react H4 POI to then target fractal high, which price did, creating a new highs and still remains the case.
Due to the bullish nature of the market and prices at all time highs, the most prudent approach would be to adopt patience and allow price to print structure as opposed to picking tops.
H4 Chart:
M15 Analysis:
-> Swing: Bullish.
-> Internal: Bullish.
Price has printed a further bullish iBOS where it continues to print all time highs.
Price is trading within internal low and fractal high.
First structural sign, but not confirmation that pullback has initiated is a bearish CHoCH, which is denoted by a blue dotted line.
Yesterday's intraday expectation was met again.
Intraday expectation would be for price to pull back following bullish iBOS, react at either M15 POI or 50% EQ of the internal structure before price targets weak internal high.
Another likely scenario, and due to the fact that all HTF's need to pull back, is price prints a bearish iBOS on M15 which would mean first structural indication (CHoCH) on H4 that pullback is about to initiate.
M15 Chart:

Bank Nifty Trade Setup (12-June-2023)This will be my personal trade Setup, This is not an advice of any kind to initiate trade according to this setup. This is for only for my learning purpose and maintaining my trading journal.
Bank Nifty selling of and forming shooting star candles... what should we expect ? Is it trend reversal ? or is it profit booking buy previously holding stocks ?
Day traders shouldn't worry about long term...
So for tomorrow this will be my trade setup:
1.) If opens flat which is near trendline or above it and horizontal reistance (44060) and takes support there i will buy for target of 44250.
2.) If opening flat and broke both trendline and resistance of 44060 keep acting as resistance i will short for target of 1st support 43850, then 2nd support 43730.
3.) Big gap up or down will stay away from market unless there is good setup.

Nifty Trade Setup (09-June-2023)This will be my personal trade Setup, This is not an advice of any kind to initiate trade according to this setup. This is for only for my learning purpose and maintaining my trading journal.
Today Nifty gave good setups wasn't able to pre analyze due to work and missed good trade after many days of range bound and gaps. :)
Trade Setup for tomorrow:
1.) If opens flat and took support near trendline and 18580 will look for buy for target of 18700, 18726 and PDH. . if doesn't hold 18580 support will look for shorting for next support place.
2.) If gaps i will wait for good setups to form.

CUMMINSIND Intraday Trading SetupCUMMISIND Intraday Trading setup. Buy above 1460.
TARGETS - 1490-1500.

BEL (Intraday) (Swing) [Illiquid Stock]Looks suitable for Intraday.
Since this is an illiquid stock, therefore take the trade on a min 15 min timeframe.
This looks good for the short term too. (Switch to daily timeframe to get a clearer view)
Disclaimer: Not a buy or sell suggestion, this is my analysis shared for educational purposes.


Crypto - Trade SetupMost ALTs haven't tested the main resistance level yet and even though they rejected beneath the resistance still there is a smell of bulls in the price action. Yes not so much interest yet but i'm expecting something more likely upward towards the resistance zone soon. But like i say market emotions change with the time so we must not stay rigid, we need to move along with the market.
Here are the key areas for my trade setup on ENJI against USDT, I'm saying again once the price reaches my zones I'll observe the market emotion clearly then only i get into the trade otherwise I'll look for another trade setup. This is what disciplined traders do so what are you doing ??
My calling : 0.5922
Note : I'll update once the trade setup got triggered!
Disclaimer : I'm not a financial advisor, trade at your own risk.

Double top Trading exampleHow to trade double top
how to fix sl
how to fix tgt
for more confirmation use indicators ie adx macd rsi ema

TCS is in a Important Breakout Point, Buy/Sell after BreakoutTCS Intraday Strategy for 10/02/2022
TCS is in a Important Breakout Point, Buy/Sell after Breakout

SPX500: my intraday scenario using 81strategyHi Traders,
This is my view on this pair for the next days on #SPX500 using my 2 intraday strategies.
(I’ve just shared my fully explained 81strategy on Tube)
I remind you that this is only a forecast based on what current data are.
Therefore the following signal will be activated only if specific rules are strictly respected.
If you follow my strategy you will be able to identify the right filters and triggers to enter correctly the market and avoid fake signals.
I really hope you liked this video and I would like to know what do you think about this analysis, so please use the comment section below this video to give me your point of view.
Thank You
———————————
Pit from Trading Kitchen

Procter & Gamble intraday buy signals H1PG, H1: Mirror level + Support line + Side of Bollinger bands + Dragonfly doji + Hidden divergence
