future of the DXYHi to every one
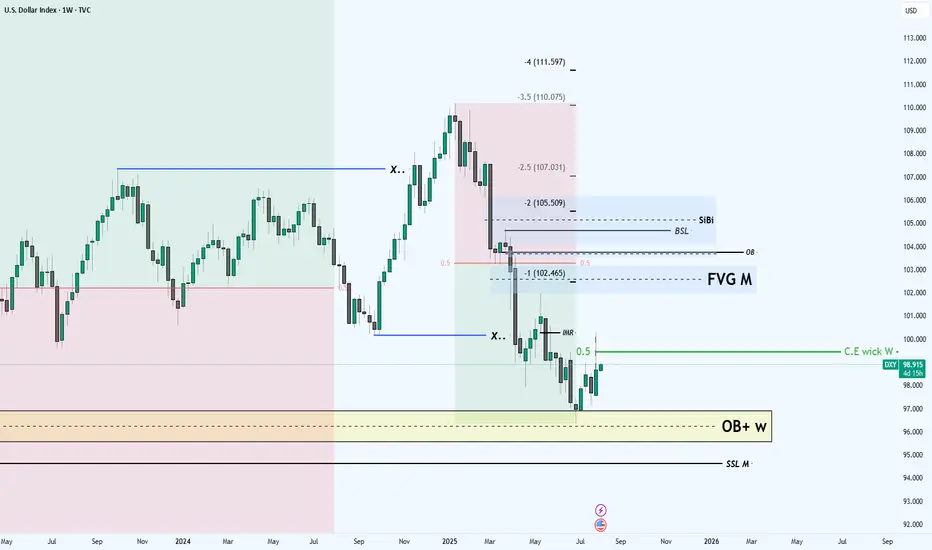
In the DXY we are in the middle of the decisioning area which means
we should wait for the market to show its hands
First sensitive level that i am looking for is the C.E of the weekly candle(Prev.week)
IF we get resistance at that level we can wait for the price to deep into the SSL M level
Other wise i don't see any indication and obstacle for the DXY to reach the OB level above the 0.5 mid level of the range
this is my the first low hanging fruit objective which is high probability
after that my ultimate objective is the SiBi to be rebalanced
This was the technical perspective
BUT
things are happening around the world the most important one is the
USA central bank Interest Rate Cutting Decision which can leads the DXY to go lower without retracting to the 0.5 of the range
this factor also should be considered BUT overall i am bullish for DXY
Intrestrates
DXY Bulls Ready — Can Powell Spark the Rally?📊 DXY Pre-FOMC Outlook
In my previous analysis released on Monday, I expected the Dollar Index to fill the gap around the 98.60 zone and range below the key red line at 99.429.
Now, with less than 8 hours left until the highly anticipated FOMC rate decision, it’s time to take a closer look at tonight’s event and what it could mean for the markets.
From a purely technical perspective — setting the news aside — the Dollar Index looks ready to break through the crucial 100 level and kick off a strong bullish rally.
However, recent political pressure from Trump urging rate cuts, along with visible tension between him and Fed Chair Jerome Powell, has created uncertainty. If it weren’t for these conflicting signals, I would’ve confidently expected a clean breakout above 100.
As much as I enjoy trading news-driven events, I’ll likely stay out of the market tonight and observe from the sidelines. The setup is tempting, but the dual narratives make it risky.
That said — if you ask for my final take — I believe the stage is fully set for a bullish dollar and a corresponding drop in gold, EUR, GBP, and other major assets.
Let’s see how it plays out. 👀💥

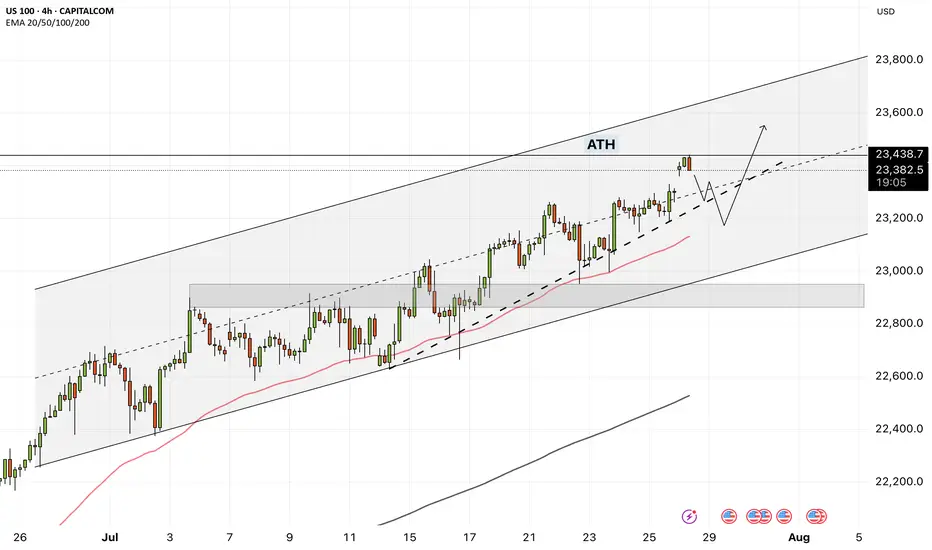
NAS100 - How will the stock market react to the FOMC meeting?!The index is trading above the EMA200 and EMA50 on the four-hour timeframe and is trading in its ascending channel. The target for this move will be the ceiling of the channel, but if it corrects towards the indicated support area, you can buy Nasdaq with better reward-risk.
As signs of easing global trade tensions begin to emerge, the Federal Open Market Committee (FOMC) is scheduled to meet this week. Analysts widely expect the Fed to hold interest rates steady for a fifth consecutive time. This anticipated decision comes as the U.S. President continues to push for rate cuts, persistently pressuring the Fed to adopt a more accommodative monetary stance.
So far, the Federal Reserve has kept its benchmark rate within a range of 4.25% to 4.5%. While some officials project two cuts by the end of the year, markets are waiting for the Fed’s patience to run out. According to the CME Group’s FedWatch tool, investors have priced in a 62% chance of a rate cut in the September meeting. By then, the Fed will have access to the July and August employment reports—key indicators of whether the labor market is weakening or remains resilient.
The upcoming week marks the peak of Q2 earnings season, with 37% of S&P 500 companies reporting results, including four major tech firms. In parallel, the August 1st tariff deadline for the EU and other countries is approaching, while legal challenges over existing tariffs remain ongoing.
According to a report by The Wall Street Journal, many large U.S. corporations have so far absorbed the bulk of tariff-related costs without passing them on to consumers. This strategy aims to maintain market share and avoid drawing criticism from President Trump. However, the question remains—how long can this continue?
Examples from the report include:
• General Motors paid over $1 billion in tariffs in Q2 alone without announcing any price hikes.
• Nike expects a $1 billion hit from tariffs this fiscal year and is planning price increases.
• Hasbro is working on a combination of price hikes and cost cuts to offset $60 million in tariff impacts.
• Walmart has made slight pricing adjustments (e.g., bananas rising from $0.50 to $0.54) and managed pressure through inventory reductions.
This week is shaping up to be one of the busiest on the economic calendar in recent months. A flood of key data on growth, inflation, and employment, alongside three major interest rate decisions, has markets on high alert.
On Tuesday, attention will turn to two significant reports: the Job Openings and Labor Turnover Survey (JOLTS) and the U.S. Consumer Confidence Index for July. These metrics will offer a clearer view of labor market dynamics and household sentiment heading into critical monetary policy decisions.
The most anticipated day is Wednesday. That day brings the ADP private payrolls report, the first estimate of Q2 GDP, and pending home sales data. Additionally, both the Bank of Canada and the Federal Reserve will announce rate decisions—events with the potential to simultaneously steer global market trajectories.
On Thursday, the July Personal Consumption Expenditures (PCE) price index will be released—a key inflation gauge closely monitored by the Fed. Weekly jobless claims data will also be published that day.
The week concludes Friday with two heavyweight economic indicators: July’s Non-Farm Payrolls (NFP) report, a crucial input for Fed policy decisions, and the ISM Manufacturing PMI, which offers insights into the health of the real economy.
Some economists argue that a September rate cut may be premature, and even suggest that no rate changes might occur in 2025. Analysts expect Fed Chair Jerome Powell to reiterate a data-dependent stance, consistent with previous meetings.
Still, beyond political dynamics, the July meeting holds independent significance.The Fed’s internal policy tone is gradually leaning more dovish, and subtle signals of this shift may emerge in the final statement. Given that only one meeting remains before September, if policymakers are leaning toward a rate cut then, it’s critical that the groundwork for such communication be laid now.
EURUSD LONG AND EDUCATIONAL BREAKDOWN ECB INTRESTRATE RELEASE The European Central Bank is expected to hold key rates for the first time in over a year on Thursday.
The Eurozone inflation rate has hit the ECB’s 2% target as the US-EU trade deal uncertainty lingers.
The EUR/USD pair could experience intense volatility following the ECB policy announcements.
The European Central Bank (ECB) is on track to leave its key interest rates unchanged after its July policy meeting, after having reduced rates at each of its last seven meetings. The decision will be announced on Thursday at 12:15 GMT.
The interest rate decision will be followed by ECB President Christine Lagarde’s press conference at 12:45 GMT.

US Unemployment Rising: How Is This NOT a Recession?The U.S. unemployment numbers are steadily climbing, as indicated by recent Bureau of Labor Statistics data. Typically, significant rises in unemployment correlate directly with recessions, which are shaded gray in historical data charts.
Currently, unemployment has reached over 7 million, significantly higher than recent lows. Historically, every similar increase has coincided with or preceded an official recession declaration. Yet, mainstream economic narratives have avoided labeling this a recession.
What does this data tell us, and is the market accurately pricing in the risk? Are we already in a recession, or is this time different?
Share your thoughts below. Let's discuss the disconnect between the unemployment reality and official recession narratives.


XAUUSD - Gold awaits the Fed meeting!Gold is above the EMA200 and EMA50 on the 4-hour timeframe and is in its ascending channel. If gold rises to the previous ATH, we can look for selling positions at the ceiling marked with the target of the bottom of the ascending channel. A correction of gold towards the demand zone will provide us with its next buying position.
Sergio Ermotti, CEO of UBS, has warned that the anticipated interest rate cuts could be delayed if Donald Trump’s second-term tariffs take effect and drive inflation higher.
Speaking with Andrew Ross Sorkin of CNBC, he stated:
“I have been saying for some time that inflation is far more persistent than we initially thought. The key question now is how tariffs will impact inflation.”
He further added:
“Tariffs are unlikely to help in reducing inflation. Therefore, I do not expect rates to drop as quickly as many anticipate.”
With Trump’s trade policies in play, the risk of rising inflation is high, and a major clash between Trump and the Federal Reserve over interest rate cuts seems inevitable. Such tensions could negatively impact the U.S. dollar.
Meanwhile, Scott Bessant, the newly appointed U.S. Treasury Secretary, is proposing a gradual global tariff plan starting at 2.5%, which will increase monthly and could reach up to 20%. This strategy aims to give businesses time to adjust to the new economic landscape. The Financial Times reported this plan, citing anonymous sources for details.
At the same time, the U.S.Senate has confirmed Scott Bessant as Treasury Secretary with a majority vote. This decision comes as Trump imposes a 25% tariff on imports from Colombia, reinforcing his aggressive trade policy stance.
The Federal Reserve’s monetary policy meeting is set to conclude today, and it is widely expected that interest rates will remain unchanged. However, analysts argue that gold markets are now focusing more on Trump’s policies rather than short-term aggressive monetary measures.
Gold prices rallied after Trump’s speech at the World Economic Forum in Davos, Switzerland. In a video address to global business leaders and policymakers, he urged central banks worldwide to cut interest rates. Trump stated:
“I am strongly calling for an immediate rate cut, and this must happen globally.”
Economists note that Trump’s remarks contradict the current economic reality, as a relatively strong economy continues to fuel persistent inflation. In recent weeks, the Federal Reserve has warned consumers about growing upside inflation risks and is seeking to shorten the current monetary easing cycle.
Ahead of this week’s policy meeting, markets expect the Fed to hold rates steady, with only one rate cut projected for this year.
Ole Hansen, Head of Commodity Strategy at Saxo Bank, believes that the divergent views between Trump and the Federal Reserve have created uncertainty, benefiting gold as a safe-haven asset.
He further stated that the recent bullish momentum in the gold market suggests that the $2,800 price level may just be the beginning. Hansen concluded:
“As long as this uncertainty persists, I see no risk of overheating. Any downside break could trigger fresh buying interest.”

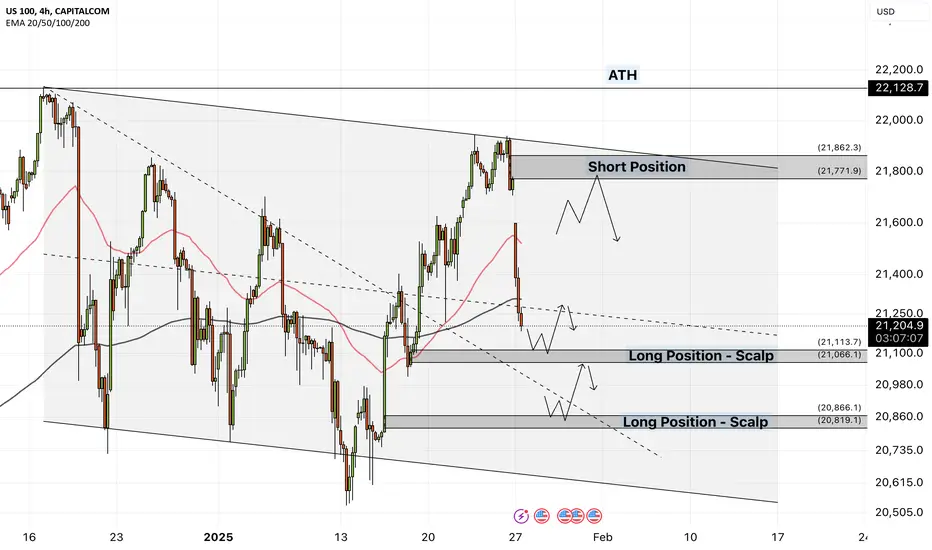
NAS100 - Is Nasdaq on track to record a new ATH?!The index is trading below the EMA200 and EMA50 on the 4-hour timeframe and is trading in its descending channel. If the index corrects towards the supply zone, we can look for further short positions on Nasdaq with a risk-to-reward ratio. Nasdaq’s position in the demand zone will provide us with short-term buying conditions.
President Trump announced that the U.S. government plans to invest $500 billion in artificial intelligence infrastructure. This project, carried out in collaboration with companies such as OpenAI, Oracle, and SoftBank, aims to create 100,000 jobs.Trump also pledged to support the project through emergency declarations.
OpenAI, along with SoftBank, Oracle, NVIDIA, and ARM, announced the start of their collaboration in technology development. This partnership includes Microsoft’s commitment to Azure, with plans extending until 2030.
Microsoft confirmed that it will maintain its strategic partnership with OpenAI and participate in the Stargate project. This collaboration includes new agreements granting Microsoft priority rights to utilize the new capacity. Additionally, Microsoft will leverage OpenAI’s intellectual property (IP) in its products, such as Copilot.
This week’s economic calendar is dominated by major events related to central banks. The U.S. Federal Reserve and the Bank of Canada will announce their interest rate decisions on Wednesday, while the European Central Bank will follow on Thursday.
Additionally, several significant economic reports are expected. On Monday, data on new home sales for December will be released. On Tuesday, reports on durable goods and the Consumer Confidence Index will be published. On Thursday, the U.S. GDP for Q4, weekly jobless claims, and pending home sales data will be announced. Finally, on Friday, the PCE index (the Fed’s preferred measure of inflation), along with personal income and spending reports, will be released.
It is projected that the U.S. economy will grow at an annualized rate of 2.6% this quarter, compared to 3.1% in the previous quarter. If the data surpass expectations, the likelihood of the Fed adopting expansionary policies may decrease. Similarly, inflation data from the PCE index and consumer income and spending reports on Friday will play a crucial role in shaping expectations for rate cuts.
Unlike the European Central Bank and the Bank of Canada, the Federal Reserve is expected not to reduce interest rates. The robust U.S. economy and inflationary pressures have left the Fed with limited room to lower borrowing costs. This situation existed even before Trump’s administration and the Republican-led Congress implemented tax cuts and tariff hikes.
Federal Reserve Chairman Jerome Powell has stated that the Fed has no predetermined path and may raise interest rates if new government policies lead to higher inflation. However, inflationary pressures have recently eased and could continue to decline in early 2025. Christopher Waller, a prominent Fed official, recently hinted at a possible rate cut in the first half of the year, but market reactions to his comments were muted, with only minor dollar weakening following news of Trump’s tariffs.
Several major companies are set to release their quarterly financial updates this week. Among them are some members of the Magnificent 7, as well as leading firms in technology, energy, finance, and manufacturing. Microsoft, Meta, and Tesla are scheduled to report on Wednesday, while Apple will release its financial information on Thursday.
Tesla’s report comes as Elon Musk, its CEO, has taken on a role in President Trump’s administration. The company’s recent vehicle delivery data fell short of analysts’ expectations.
Microsoft’s planned report follows last week’s announcement of a $500 billion AI initiative, which includes Microsoft-backed OpenAI. Meta’s report comes as the company raises its investment forecasts for emerging technologies such as AI. Meanwhile, Apple’s report is being released amid analysts’ downgraded ratings due to concerns about demand for its new iPhones.
NAS100 - Nasdaq, waiting for the final days of Santa Rally?!The index is located between EMA200 and EMA50 in the four-hour time frame and is trading in its ascending channel. If the index corrects towards the supply zone, you can look for the next Nasdaq sell positions with the appropriate risk reward. Nasdaq being in the demand zone will provide us with the conditions to buy it.
The Federal Reserve, in its latest meeting, reduced the interest rate by 25 basis points, bringing it to a range of 4.25%–4.50%. However, FOMC members now forecast the 2025 interest rate to hover around 3.9%, higher than their September projection of 3.4%.
Markets were largely surprised by the Fed’s hawkish stance, especially following Donald Trump’s victory in the U.S. presidential election. Jerome Powell, the Fed Chair, indirectly emphasized during the post-meeting press conference that policymakers are currently assessing the impact of Trump’s economic policies on inflation and growth.
This shift has unsettled investors, dampening the optimistic market sentiment that typically precedes the Christmas holiday. Concerns are rising that if the Trump administration follows through on its campaign promises regarding taxes, tariffs, and immigration, the Fed may have to reverse its rate-cutting trajectory and adopt rate hikes instead.
The outlook for 2025 has also seen adjustments. The Federal Reserve now expects only two rate cuts in 2025, compared to four cuts forecasted in September. This adjustment reflects the persistent inflation that remains above the central bank’s target range.
Following the Fed’s announcement, the S&P 500 experienced its steepest decline in 27 months, falling over 3.5%. The last time the U.S. stock index saw such a significant drop was in September 2022, during peak inflation and amid aggressive monetary tightening. Similarly, the Nasdaq dropped by 3.6%, marking its worst decline in five months.
Morgan Stanley also revised its outlook for the Fed, predicting two 25-basis-point rate cuts in 2025, instead of the previously anticipated three cuts.
On the economic front, the Conference Board Consumer Confidence Index, scheduled for release today, is likely to draw market attention. This index has risen steadily over the past two months, while one of its components—the sub-index measuring “job finding difficulty”—has declined during the same period. Given its strong correlation with the official unemployment rate, a further drop in December could signal job growth and a stronger dollar.
On Tuesday, November data for durable goods orders and new home sales will be released. Durable goods orders, which grew by 0.3% in October, are expected to decline by 0.4% month-over-month. However, investors often focus on the more specific “non-defense capital goods orders (excluding aircraft),” which tends to exhibit less volatility and is a key input for GDP calculations.
Overall, if market volatility persists during the holiday season, equities and bonds are likely to be impacted. The Fed’s hawkish tone is unfavorable for stocks, suggesting continued selling pressure as Treasury yields rise. The U.S. Treasury plans to auction two-year, five-year, and seven-year notes this week. If demand falls short of expectations, bond yields could face additional upward pressure.
Deutsche Bank, in a recent note, highlighted a significant shift in the Fed’s tone. Although the Fed reduced the interest rate by 25 basis points to a range of 4.25%–4.50%, analysts noted a more hawkish stance than expected.
One key indicator of this shift is the upward revision of the 2025 median inflation forecast to 2.5%, which Deutsche Bank described as “notable.” According to this report, the Fed does not anticipate inflation returning to its 2% target until 2027.
Furthermore, the Fed’s updated forward guidance lacked any clear indications of future rate cuts. Jerome Powell described the December rate cut as a “difficult decision,” which faced opposition from Loretta Mester, President of the Cleveland Fed.
Deutsche Bank analysts believe the Fed is unlikely to take any action during its January meeting, and the current pause could extend into a prolonged hold throughout 2025. Forecasts suggest that interest rates will remain above 4% next year, with no additional cuts anticipated.

XAGUSD- silver, waiting for the correction process to continue?!Silver is below EMA200 and EMA50 in the 4H timeframe and is moving in its descending channel. If the decline continues, we can see the demand zone and buy within that range with the appropriate risk reward. Stabilization of silver above the resistance range will provide us with the way for silver to rise to the supply range.
With the Federal Reserve beginning its interest rate cuts in September and expectations for this trend to continue, markets are now shifting their focus toward determining the neutral rate. The neutral rate refers to the benchmark interest rate in a normal economic cycle that neither accelerates economic growth nor slows it down.
Federal Reserve officials have emphasized that predicting this rate is currently not feasible. They insist that it is necessary to observe how economic data reacts to each stage of rate cuts before making any conclusions about the neutral rate. Nevertheless, bond market fluctuations suggest that this rate may be higher in the current cycle compared to previous ones. On average, FOMC members estimate a long-term neutral rate close to 3%, although this figure remains uncertain.
According to a recent Reuters survey of economists, the yield on 10-year U.S. Treasury bonds is expected to decline to 4.3% within three months and 4.25% within a year. These figures were 4.25% and 4.1% in the November survey, and 3.8% and 3.75% in October.In a note from Citi, it was stated that demand for gold and silver is likely to remain strong until U.S. and global economic growth stabilizes. Additionally, buying these precious metals as a hedge against declining equity values will persist until U.S. interest rates reach the neutral level.
This week, besides the FOMC’s decision on interest rates, other key economic data will be released. These include the GDP report, the Personal Consumption Expenditures (PCE) index, and the latest findings on consumer sentiment.
Bloomberg has reported that Wall Street’s perspective on the U.S. dollar is shifting. Policies introduced by Donald Trump and further rate cuts by the Federal Reserve in the second half of 2025 could weaken the dollar’s strength. Analysts from Morgan Stanley to J.P. Morgan predict that the U.S. dollar will peak by mid-next year before entering a downward trajectory. Similarly, Société Générale has forecasted a 6% decline in the dollar index by the end of 2025.
Bloomberg also noted that Jerome Powell, the Federal Reserve Chair, is expected to announce another quarter-point rate cut. However, the bigger question is what signals the Fed will provide regarding the future policy path and whether this will heighten tensions between Jerome Powell and President-elect Donald Trump.
Following a full percentage point reduction in borrowing costs since mid-September, Powell and his colleagues are expected to pause rate cuts for now. The Federal Reserve is likely to maintain a holding pattern during its January meeting and reassess inflation and labor market conditions in March.
This approach could lead to friction between the FOMC and Trump’s White House. Known for his preference for low rates and frequent complaints when he feels rates are not low enough, Trump’s arrival in office just over a week before the January meeting may amplify these tensions.

AUDUSD - What message will the Federal Reserve's dotplot have?!The AUDUSD currency pair is below the EMA200 and EMA50 in the 4H timeframe and is moving in its downward channel. In case of a valid failure of the channel ceiling, we can see the supply zones and sell within those zones with the appropriate risk reward. If the downward momentum decreases, we will look for buy positions on the midline and bottom of the channel.
Investors are cautiously anticipating the key decisions from the U.S. Federal Reserve’s upcoming policy meeting. It is widely expected that the central bank will announce its third rate cut of the year and provide projections for 2025.
Giovanni Staunovo, an analyst at UBS, noted that market participants are eagerly awaiting updates from the Federal Open Market Committee (FOMC) and any hints regarding the trajectory of future rate cuts. He stated, “We expect the Federal Reserve to implement a 25 basis point rate cut this week, followed by four additional cuts next year.”
The Federal Reserve’s two-day meeting is anticipated to confirm a quarter-point rate reduction while also providing updated projections for potential rate cuts in 2025 and possibly 2026.
Meanwhile, the U.S. services sector has expanded at its fastest pace since October 2021, injecting fresh momentum into the economy, even as the manufacturing sector faces a deeper downturn. The S&P Global services index rose from 56.1 to 58.5 in December, while the manufacturing PMI fell to 48.3, marking its lowest level in 55 months.
These figures highlight a widening gap between sustained growth in the services sector and further declines in manufacturing. Factory output and order volumes have dropped at a faster pace, while the cost of imported raw materials from China has risen due to concerns over potential tariffs from the Trump administration.
Following the release of this data, projections for real private gross investment growth in the fourth quarter dropped from 2.4% to 1.2%, while forecasts for real government spending growth in the same period rose from 2.4% to 2.6%. Additionally, U.S. holiday retail sales for 2024 are expected to reach a remarkable $979 billion.
According to a recent report by Fitch Ratings, declining demand poses the most significant risk to global commodity markets if the U.S. imposes new tariffs and affected countries retaliate.
Fitch has warned that potential U.S. tariffs on China, Canada, and Mexico could weaken global economic growth, particularly in China, the world’s largest consumer of commodities. This could exert significant pressure on base metals, chemical products, and oil markets.
However, Fitch also noted that China’s economic stimulus measures could offset some of this pressure. At the same time, new tariffs on specific goods, such as steel and aluminum, could increase price volatility and disrupt trade routes.
Bloomberg reported that J.P. Morgan believes the upward trend in European government bonds is nearing its end. The firm now views Australia as the next promising market for stronger performance.
Kim Crawford of J.P. Morgan explained that there is limited room for further gains in Europe, as swap markets have already priced in the potential rate cuts by the European Central Bank. He also highlighted that the Reserve Bank of Australia’s stance, which has yet to reduce rates in this cycle, positions Australian bonds for stronger growth compared to other developed markets.

Nazdaq - Stock market after the FEDThe index is above the EMA200 and EMA50 in the 4H timeframe and is trading in its ascending channel
If the index rises towards the supply zone, which is also at the intersection with the weekly pivot and the midline of the channel, you can look for sell positions in the Nasdaq index
The failure of the drawn trend line and the loss of the specified support range will provide the downward path of the index to the bottom of the ascending channel

DXY - Dollar in the long-termThe DXY has weakened greatly in the past few weeks and the risk of selling the dollar is not attractive
It is possible to re-enter dollar sales after this downward trend!

UNEMPLOYMENT / FED FUNDS RATE - PLAY BOOKUNEMPLOYMENT / FED FUNDS RATE - PLAY BOOK
This post I intend to explore with you the cyclic relationship we can observer between:
1) US Unemployment Rate (BLUE),
2) 21D SMA (Orange) based in unemployment data, and
3) Resultant Recessions (Gray Bars)
Historically, the general play book / sequence of events suggest once we break the 21 Day SMA (orange line), it is the start of unemployment unwinding and we lead into a recession.
As the 'FED FUNDs RATE' is the artificial tool used to 'Guide' the credit market (politically correct explination), the obvious question then is;
"What is the relationship / behavior of interest rates historically with this trend? Are we experiencing similar behaviour to the last 30 - 40 years?"
The Red line show the FED funds rate on the chart. The below sequence of events show how these variable play with each other:
The story goes: the FED increases the 'FED FUNDS RATE' (aka interest rates) because low periods of interest rates is resulting in a 'HOT' economy and causing inflation (i.e. market forces the FEDs hand to raise interest rates as the return for lending money to credit markets does not match the current risks).
At some point during interest rate rises:
1) FED rise in interest rates is held constant (the lagging effect of higher rates start to hit the economy resulting in slowing down economic activity - i.e. spending)
2) Record low unemployment starts to rise (Cross of 21D SMA historically has signaled a point of no return)
3) Fed start to drop rates due to employment increase, deflationary market disruption
4) Unemployment begins to rapidly increase
5) Recession
WHERE ARE WE NOW?
According to this play book, we are in currently in step 2 and approaching point 3 .
If you find this post interesting, you may find my discussion around the 2 Year Treasury Bond Yield vs FED Funds Rate interesting.
This relationship is what I was using to speculate interest rate rises before they happened, and that they would be higher than people were expecting when there was talk of rates rising...
The Market in all cases will eventually win...

XAU/USD(GOLD) in anticipation of a price correctionInterest rates in the United States do not fall easily and are accepted by the Federal Reserve when inflation is in equilibrium. It is possible that with the reduction of international tensions, the global price of gold(xau/usd) will decrease, and if we go along with the reduction of interest rates, the increase in demand can be seen in the global price of gold.
There are two scenarios for the price movement, which are highlighted in the full picture

NASDAQ 100 TRADE IDEAWe had Massive buys on Nas100 through out last week which was also NFP news. We should expect strong retracement to the downside after price should take resistance at 15218.00 or continue to sell to the downside.

Xauusd FED ratesGold expected to have a correct on the beginning of the week
However big news is coming on Wednesday so be careful,
If FED keeps the rates , I think gold will rise till 1950 and may continue to 80
Otherwise, we can see new lows till 1860
Be careful this week , be stricter with your management this week, good luck

Interest Rate Hikes & Bank Collapse: How to Protect Your TradingThe Federal Reserve has been increasing interest rates for the past 9 months, causing a ripple effect throughout the financial world. In recent week, we have seen 3 major banks collapse as a direct result of the interest rate hikes, which has caused trouble in the financial world as well. As a trader, it's essential to understand how these events can affect your trading decisions and how to navigate the current situation.
The Impact of Interest Rate Hikes on the Financial World
Interest rate hikes have a direct impact on the financial world, including the stock market, bond market, and the housing market. As the Federal Reserve increases interest rates, borrowing becomes more expensive, which can lead to a slowdown in economic growth. It can also lead to increased volatility in the stock market, as investors react to the news and make changes to their portfolios.
The Collapse of Banks and the IT Sector
The recent collapse of two banks has caused trouble in the stock market specially IT sector, as many IT companies & startups have provided services to these banks. The collapse of these banks has caused a ripple effect throughout the financial world, leading to concerns about the stability of the financial system.
Navigating Trading During the Current Situation
As a trader, it's important to stay informed about the current situation and how it can affect your trading decisions. Here are some tips for navigating trading during the current situation:
Stay informed: Keep up-to-date with the latest news and developments related to the interest rate hikes and the banking collapse. This can help you make informed decisions about your trades.
Diversify your portfolio: Diversification is always important in trading, but it's especially crucial during times of economic uncertainty. Consider spreading your investments across different sectors to minimize your risk.
Monitor volatility: As interest rates continue to rise, volatility in the markets may increase. Keep an eye on market volatility and adjust your trading strategies accordingly.
Be patient: It's important to be patient and avoid making impulsive trading decisions based on emotions. Take the time to analyze the market and make informed decisions based on your trading plan.
Use stop-loss orders: Consider using stop-loss orders to minimize your risk and protect your investments. Stop-loss orders automatically trigger a sale when a stock falls to a certain price, which can prevent you from incurring significant losses.
Stay disciplined: It's important to stay disciplined and stick to your trading plan, even during times of economic uncertainty. Avoid making impulsive decisions based on emotions, and focus on your long-term trading goals.
Take advantage of opportunities: While economic turbulence can be challenging for traders, it can also create opportunities for profit. Keep an eye out for undervalued stocks or assets that may be poised for growth in the future, and consider taking advantage of these opportunities if they align with your trading goals and strategy.
Avoid overtrading: During times of economic uncertainty, it's important to avoid overtrading and taking on too much risk. Stick to your trading plan and avoid making impulsive decisions based on emotions or short-term market movements.
In conclusion, the current situation of interest rate hikes and banking collapse can have a significant impact on the financial world and your trading decisions. By staying informed, diversifying your portfolio, monitoring volatility, and being patient, you can navigate this challenging environment and make informed trading decisions. Remember to always prioritize risk management and stay focused on your long-term trading goals.

EJ Yearly ChartHello Traders!
BoJ (Bank of Japan) has not raised rates since 2016.
The current rate is negative.
ECB (European Central Bank) has recently raised rates over the years.
The current rate is positive.
It is reflected in the price action. Central bank traders want the best ROI (rate of return).

SilverHi
we have 2 key point
first >>>> inflation and intrest rate : if inflation cant hit 2 % we can say silver drop to 17 looklike another commodity
2nd >>> recession >>> Consequences of excessive interest rate increases >>> This MOD can pump Gold but Silver dont have safe haven character >>> if this point true XAUXAG can pump
ANYWAY SILVER CAN HIT 50$ to 10$
be careful

ArmanShabanTrading |🔴 XAUUSD - Heavy Correction is Coming ?An Important TA of $GOLD : As you can see, since yesterday the price faced buying pressure after reaching 1900.870 and was able to grow strongly to the level of 1931$, now the price is trading in the range of 1924$ and according to the today's news , I give the probability of the price falling from this range , I have specified 2 scenarios on the chart, which are accurately and detailed , the targets are $1920, $1918, and $1906, respectively!
Follow me for more analysis & Feel free to ask any questions you have, I'm here to help.
⚠️ This Analysis will be updated ...
👤 Arman Shaban : @ArmanShabanTrading
📅 02. 01 .2023
⚠️(DYOR)
❤️ If you apperciate my work , Please like and comment , It Keeps me motivated to do better ❤️

USDJPY -4hYesterday Fed has released the interest rate once again with 0.5 % and closed the year by 4.5 % overall
but in conference once again we observe dawish speech during the conference
and the most important thing for the Fed and US is to decrease the inflation and come back again to 2 percent
CPI data showed that FED did a great job during the dawish policy
i do expect that USDJPY achieve to 140 before ending the year after that we have to observe what is happening during the technical channel
if it broke above we could expect another bull run to the onside to the supply zone which i've already mentioned

InvestMate|DXY Dollar in retreat💲DXY Dollar in retreat.
💲Last week the event everyone was waiting for was the interest rate decision, which rose to 4%.
💲This was followed by a press conference in which Jerome Powell spooked the markets with a hawkish tone, which first triggered a sharp wave of dollar weakness, and Powell's words were followed by a speculative attack to strengthen the dollar.
💲The next day already brought a cooling off and the market returned to discounting the scenario of a weakening dollar in the future and a slowdown in interest rate hikes.
💲4 November Non Farm Payrolls performed very well with 261k new jobs created compared to the 200k the market was expecting.
💲After which the rate from the data we found out unemployment rose to 3.7%
💲All this data could have a positive impact on future inflation readings. Which has been falling for over 4 months.
💲Looking at the dollar index we were still last at levels seen in 2002.
💲Looking at the big picture, the bottom on the dollar took place during the 2008 crisis and since then the dollar has gradually strengthened.
💲But the real wave of appreciation has only come since inflation rose and the Fed began raising interest rates.
💲Looking ahead and combining the facts, it does not look like the FED will be raising interest rates as sharply in the future as it has done in recent months.
💲Turning to the chart. On 3 November we saw an attempt to attack the 0.618 level of the last downward wave from where the sell-off rally started.
💲Measuring the upward momentum that has been going on since the discounting of interest rate hikes in America
💲The key places will be 2 levels.
The first 0.236 and the second 0.382
💲In the long term we are likely to be at the 102 level which has been set by measuring from the last peak in 2001 to the 2008 low. Where price has repeatedly found resistance
💲If we would maintain the downward trend the levels to see this week are 108.5 and 107.300 which are the outer fibo levels of the last upward impuls
🚀If you appreciate my work and effort put into this post I encourage you to leave a like and give a follow on my profile.🚀
