SMH - Inverse H&SSMH has formed an Inverse Head and Shoulders Pattern. Looking for a bounce to 169-170 if it can close above the neck line. Trading this with SOXL if pattern confirms.
Inverse Head and Shoulders

ETH - Inverse Head & Shoulders Retesting of the .50#Ethereum
ETH looks to be printing another pair of stair stepping inverse head and shoulders with beautiful precision retests off the .50 Fibonacci
What Happens Next...?

NMDC Target 1 Reached This NMDC strategy i'm already posted but its hidden due to some TradingView House Rules Violation Please Note this
" INVERSE HEAD & SHOULDER PATTERN BREAKOUT "
Entry Level - 130
Stop Loss - 115
Targets - 145,156,164
Breakout Happened on Sep 1st With good volume
FUNDAMENTALS OF NMDC
Market Cap - ₹ 38,307 Cr.
Current Price - ₹ 130
Stock P/E - 7.74
Dividend Yield - 5.06 %
ROCE - 30.2 %
ROE - 23.0 %
Face Value - ₹ 1.00
PROS
Company has reduced debt.
Company is almost debt free.
Company has a good return on equity (ROE) track record: 3 Years ROE 27.9%
Company has been maintaining a healthy dividend payout of 38.9%
CONS
The company has delivered a poor sales growth of 8.75% over past five years.
Earnings include an other income of Rs.2,153 Cr.
Promoter holding has decreased over last 3 years: -8.86%
Working capital days have increased from 58.6 days to 102 days
Disclaimer - All information on this page is for educational purposes only,
we are not SEBI Registered, Please consult a SEBI registered financial advisor for your financial matters before investing And taking any decision. We are not responsible for any profit/loss you made.
Request your support and engagement by liking and commenting & follow to provide encouragement
HAPPY TRADING 👍

What is Immix Biopharma?I haven't looked into this company, but the chart looks interesting to me - and its ticker news shows it recently had some promising trial results.

Futes projected pathBreakout level is 11525, expected path is solid green trajectory:
- Initial target = 13189 by 4/3/2023
- Then pullback to test support at 11525
- If holds, then target = 14565 by 1/15/2024
~Alt path to initial target is most bullish scenario (dashed green trajectory, would need to break all resistance this week):
13189 by 1/30/2023

Gold IdeaCrazy thing is how Gold can actually still pullback down towards 2020/2018 support and trhen buy up from there. The other thing is it may just pullback halfway and then push up from there. Looking at that inverted head and shoulders type buy structure and the information the higher time frames is showing us, we can say buy are still valid and still to come.

Coinbase(COIN) knows the future of BTC
* 1D
Coinbase(COIN) has a inverse head and shoulders pattern.
Coinbase's stock price leads Bitcoin, so it can predict the future of Bitcoin.
In the mid- to long-term, the pattern target price can be set at $112 / $150-156 / $207-224.

Wants to go upPair is accumulating over and important support (blue line) and forming an inverse HS. I just opened a long position, If it pulls back I'll add. I wants to break out, is just a matter of time.

Avax confirming the log channel breakout.You can see on this log chart that Avax has confirmed a breakout above the yellow channel. On its way to the breakout target it has los broken above an inv h&s neckline. This is a very asymmetrical inverse head and shoulders pattern as we can see the right shoulder is extremely tiny and the head appears to be Siamese. All the same if this inverse head and shoulders pattern also validate the breakout target for it is around $56. *not financial advice*

Possible Channel Break Re-testsA quick look at how Bitcoin could drop as low as 25-26k or even 22-23 and remain bullish.
Bitcoin first broke above an inverted HS, which ultimately led to a parallel channel breakout on the weekly chart.
We haven't yet re-tested the top of that channel.
A re-test doesn't always occur, but if it does a re-test at 25-26k is easily still bullish and remains above both pattern breaks.
There's also the possibility of a pullback below the inverted HS that still remains above the channel if a re-test occurs but gets dragged out for weeks. A prolonged re-test could pullback below the inverted HS, yet remain above the parallel channel, going as low as 22-23k or even lower (below 20k) if it is prolonged further.

Keep your trades simple_ZYDUS_TRADE_SETUPWhen a stock gives you a clean breakout, you take it!!
INR 650 level had been providing a strong resistance to this particular stock for more than 4 months now. The stock, in an attempt to go past this resistance made few dips and rallies which led to formation of an inverted head &shoulders pattern on the chart.
INR 650 was the neckline of the pattern and the stock broke the neckline and closed above it with vol expansion on Thursday's trading session.
The target pattern projection suggests an upward target of around INR720-730 for the stock.
INR 650 should be a major support now.
CMP - INR 657
SUPPORT - INR 650
TARGET - INR 720
SL - INR 635
Note*- The views expressed are based on personal observations/opinions. Please do you own research before making any trading decisions.

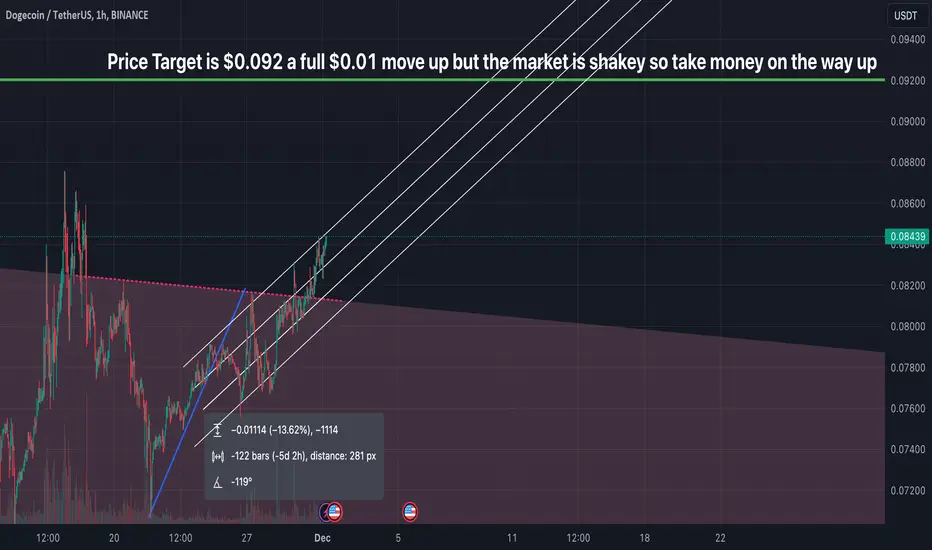
Doge Innverse H&S Target $0.092 and breakoutI was originally was tracking doge for a H&S pattern based on how bitcoin goes and if would force doge back into the downtrend and they I stumbled into this play because that and right now it's been looking strong and keeping in this uptrend channel.
Currently sitting. at$0.084 with 8 cents (80%+ left to play out)
KEEP BTC CHART OPENS AND WATCH FOR SWINGS AS PATTERNS USUALLY MEAN NOTHING DURING THOSE MOMENTS. CHEERS
FET in a sizable inverse head and shoulder pattern.We can see that the right shoulder on the FETUSD chart has just now been completed and is retesting the neckline of the inverse head and shoulders for the 1st time upon its completion. Usually in these situations lately especially in the early phases of the bul market, we have seen several other cryptos do a headfake on their first attempt at breaking above the neckline of an inverse head and shoulder pattern..some times even 2-3 fake out breaks before the inevitable real breakout…so there is then a reasonable possibility that this could see at least 1 correction or pull back before the legitimate breakout up from this pattern. In the sideways market we would sometimes get as many as 5 head fakes before the real one…in phase 1 of the bull 2-3 but if we are entering phase 2 of the bull we may see these kind of patterns start to trigger with only one head fake and ossicle no head fakes at all. If it were to confirm a breakout here soon without any pull backs then the measured move target should have it heading to a 2x or so somewhere around 1.12-1.20. I plan on accumulating a little here just in case. If we are fortunate enough to see a pull back before the official breakout I plan on accumulating more then as well because at that point the gain will be more than a 2x once it occurs. *not financial advice* Always a chance that it gets rejected and dips below the head of the pattern too thus nullifying it…but that Din of thing hasn’t really happened since the sideways market so it. Is quite a low probability.

WTI A+ set upWith the inverse head n shoulder and 8 hour bullish divergence still in play, price dropped to both trendline support during NY open. With this set up, it looks promising to tap the upper trenline as you can see in chart.

Coinbase Gearing Up for its next MoveHi guys! This is an Update on recent Technical developments found for Coinbase (COIN).
I've successfully identified the Inverse Head & Shoulders Pattern. Check out that idea down below.
We have completed the Return Rally back to test Support on the Neckline. Now ive been assessing if there are signs that we continue the Inverse Head and Shoulders with our final explosive breakout move.
This analysis is done on the 1 day timeframe.
As you can see we have tested and CONFIRMED Support on the Neckline.
After doing so we have inched higher.
Notice now, we are ABOVE the 21 EMA.
With the last 3 days of candles, forming LOWER WICKS off the 21 EMA.
This is a great sign of SUPPORT.
We must continue to stay ABOVE the 21 EMA.
Being Above the 21 EMA on any timeframe indicates that we will most likely have an UPTREND in price.
Notice also the Orange Rectangle. This highlights a consolidation zone. This shows to me that we are building up momentum for our final rally of the Inverse Head & Shoulders Pattern.
A confirmation ABOVE the Upper Border of Rectangle, will indicate Rally may be starting.
To keep us on our toes, just remember that if price action goes BELOW the Lower Border of the Rectangle, we risk testing the Neckline again. Which is always a possibility . As long as we maintain the Neckline as Support, we good.
Watch VOLUME -> We need it to start picking up for indication of the major move.
This move will essentially lead to trend reversal for COIN, confirming the bottom.
__________________________________________________________________________________
Thank you for taking the time to read my analysis. Hope it helped keep you informed. Please do support my ideas by boosting, following me and commenting. Thanks again.
Stay tuned for more updates on COIN in the near future.
If you have any questions, do reach out. Thank you again.
DISCLAIMER: This is not financial advice, i am not a financial advisor. The thoughts expressed in the posts are my opinion and for educational purposes. Do not use my ideas for the basis of your trading strategy, make sure to work out your own strategy and when trading always spend majority of your time on risk management strategy.

SPYzoomed in Inverse H/S linked to previous idea. Short into next year then flip to long for the possible Santa rally.

SPY!st person with this analysis... i like being ahead of the game...
shorts incoming back to 430s... inverse h/s possible... Now until end of Dec goes short... Jan-Feb rally possibly to the ATH then i want to believe it gets ugly from there but we will have to wait and see what happens next. I'll link this to the inverse h/s zoomed in.

TSLA: It Has Just Reached a Major Turning Point (D and W charts)TSLA shares are down today, showing a bearish reaction right after closing their gap at $242.08, which is acting as a resistance level, as expected.
The medium-term trend is up, as TSLA is recording higher highs/lows since bottoming out on October 31 at $194. In addition, it recently triggered an Inverse Head and Shoulders chart pattern after breaking through the $226 area, the neckline of this pattern, which is another bullish reversal chart structure. An IH&S pattern is nothing more or less than a bearish pivot point followed by a bullish pivot point (a lower H/L followed by a higher H/L).
Now, if TSLA really corrects, it could look for its next support levels, such as the $226 mentioned above, which is close to the 21 ema on the daily chart and close to a previous gap as well ($225.40). Despite today's bearish reaction, this top signal has not yet been technically triggered.
Could TSLA reverse and thwart this bullish sentiment? Yes, but it would need to trigger a clear bearish reversal structure (there isn't one so far) or lose the $206 again, because that key point was a previous bottom, and TSLA would make a new lower low if it lost it.
On the weekly chart, we see that TSLA is reacting around a clear support area (yellow line), but is still within a Descending Channel, as evidenced by the purple lines. Therefore, for the long term to resume its bullish sentiment, it must break out of this channel to the upside.
In any case, despite the bearish reaction and a possible pullback, medium-term sentiment is bullish and, in theory, TSLA can still seek higher levels. We'll be monitoring its key points closely. I'll keep you updated on this, so remember to follow me for more analysis like this.

SOL Nice Inverse H&S Setup. Get past 26. 36-50 is TargetNot financial advice.
All charts are made on current market conditions
Pretty simple here
Get past 26.00 we could be aiming for mid 30's and as high as 50.00 for completion of inverse head and shoulders which was a 91% head to neckline.
Trading ideas moving forward
Either entry now(It's up to you)
Or option #2
Wait til we get past 26.00 and hold that as support with mid 30's and 50.00 as targets.
Always Practice Patience
#PIK Patience Is Key
#TLAW Think Like A Whale

Prism Johnson Ltd ( LTP : 156 )Go long for prism Johnson forming inverse head and shoulder with rsi support buy on dips for the target of 250-255 holding period 1/1.5 years

AMZN Inverse H&SAMZN has broken the neckline on a nearly 2 year inverse H&S pattern.
Not financial advice, just an observation.

Solana nearing the precipice of a breakout?We can see that solusd’s price action is now retesting the top trendline of this purple symmetrical triangle it has been in since around august of 2023. Obviously it only matters once we break above this trendline and flip that trendline to solidified support. Until that time one must remain levelheaded and not chase any breakout that is unconfirmed. If it were to trigger a breakout sometime within the next few days the target would be around $50 or slightly higher. The top trendline of this triangle also qualifies as an inverse head and shoulders neckline. We can also see that the measured move target for the breakout from the descending tan channel is above this neckline which increases the probability we will trigger the breakout of the purple triangle on the way up to hit the measured move target of the tan descending channel breakout. *not financial advice*

DREDGECORP - Inverted Head and Shoulder Strong bullish pattern inverted head and shoulder with depth of 70 points in head.
Strong buy between 330-340
Immediate support right shoulder low - 300-308
Immediate target shoulder depth i.e. 30-40 points
Final target 400+
Sustaining above 400 can give us great move in future
