Going Short Solana HereSolana has reached it's target from a long-standing inverse H&S pattern (zoom out to see). Daily RSI is over 86 as of this post. Going short here. SL 48. Target 32.
Not fin advice. Entertainment only.
Stewdamus
Inverse Head and Shoulders

It's an animalHuge inverse HS playing out. The last 3 months price has been pushing against the resistance. Break out is coming, SL triggers when price drops below the minimum of the current monthly candle and a daily candles closes at that level. Use limit orders to TP and take profits on the way up.

TRX MANA XRP If I'm Right XRP and MANA getting ready to crushNot financial advice.
All charts are made on current market conditions.
This is a correlation chart and shows how TRX has already performed the inverse head and shoulders move and has risen 23.25%...
Pay attention to the moves on XRP and MANA... It's Moving in exact same manner and once the neckline is broken big gains await us.
Always find your first movers and pay attention to how they move then find corresponding charts for repeat moves.
Both MANA and TRX need to break the necklines as noted but once they do we are A Ok.
Always practice patience
#PIK Patience is Key
#TLAW Think Like A Whale

$Mana : Advanced Analysis of Potential Trend Reversal!
"Unlocking Cryptocurrency Insights:"
In the realm of sophisticated technical analysis, Mana, a cryptocurrency of interest, is currently in the throes of a breakout from a meticulously observed weekly triangle pattern. This pattern signifies a pivotal juncture in price dynamics.
Moreover, the formation of an Inverse Head and Shoulders pattern, consisting of left, head, and right shoulders, is now on the radar. This pattern is renowned for its potential as a market reversal indicator. However, the fulcrum of the analysis pivots upon the forthcoming Bitcoin halving event, a seminal occurrence in the cryptocurrency domain that profoundly influences market sentiment and trajectory. s3.tradingview.com s3.tradingview.com BINANCE:MANAUSDT

FILUSD working on a potential inverse head & shoulders breakout.First candle above the neckline is rarely the candle that confirms the breakout, but if we can get the current candle to close above the neckline as well as 1-4 more candles the probability of a breakout increases quite a bit with each additional candle close. For now w are still working on even getting our first candle close above the neckline but it does look promising. *not financial advice*

Btcusd finally hits 100% target of inv h&s patternTook a long time for this one to finally reach its target but as we can see it just did with pinpoint accuracy. Been watching this one for a long time now. *not financial advice*

Link breaking up from bullflag & inv H&SNot even factoring in the much larger monthly pattern link is breaking up from here and only focusing on the inv h&s and bullflag. Will be interesting to see how price action plays off these measured move lines on the way to their targets. While it seems like we have definitely triggered the breakup from the bullflag I don’t think it has officially broken upward from the inv h&s neckline just yet, but likely will soon. *not financial advice*

BTC Weekly Analysis: Breaking Trendlines & Anticipated Targets A comprehensive examination of Bitcoin's recent performance reveals a noteworthy development: its current valuation stands at $29,700, having breached a significant weekly trendline. This breach suggests a potential trajectory, with the immediate target identified at $31,818, followed by a subsequent level at $34,083. However, it's important to acknowledge the potential for a retracement to $29,038, though such a move is considered less probable at this juncture.
I'm looking for it to complete a Three-Drives-Pattern to the high.
#NFA

BTCUSD 12H Inverse Heah & Shoulder Breakout#BTC #ETH The 12 hour chart is showing an inverse head and shoulders formation that is coming to an end. Make sure you use support line for stop loss as always.
THis chart is sharable. If you scroll back on it you will see just how crazy accurate the cloned support line is with resistance tops. The 2018 actually lines up as will with resistance!
Anyways. I don't know where take profit will be. But I'll just set an alert on Tradingview and let them worry about it.
Good hunting!

a close upA bit closer look at BNT/USD... not a huge fan of fan fib but here's an example. we could see this push up to the .66 and if there is a break we could see some major movement within this coin. Not financial advise keeping a small bag to make a decent profit as XRP/USD is a more reputable coin in the long term. This coin is strictly for scalping some quick profits to put somewhere else but we could see something big coming up.
remember Risk management and good luck, have fun with it.

Solidifying 31.7k as prolonged support could trigger an invh&sWe can see that awhile back we formed a very subtle and tiny left shoulder to this potential pattern that most people may tend to overlook, and the rejection from our most recent high on bitcoin helped solidify a potential neckline for this currently speculative inverse head and shoulder pattern which then gave us the ability to make a measured move guesstimate for its breakout target, and it is quite staggering. From what I’m seeing here, if we were to maintain solidified support above this neckline for a prolonged period of time then it should trigger this pattern and give us the opportunity to reach a breakout target somewhere between 64k and 65k! This of course is the target we are giving when viewing this on the log scale shown here….when you switch it to linear the target you get is around 48k which I think currently is a much more practical target to shoot for than the 65k log chart target,however we may see both come to fruition before Q3 of next year. I anticipate the 48k target before Q2 of next year. I arbitrarily placed the dotted measured move breakout line at November 11th but there’s a chance it could breakup even sooner than that possibly the 29th of October even…also a chance the neckline could maintain resistance all the way well into december or perhaps even as long as ja unwary or February of next year. We must remember that there have been plenty of times in the past, especially during the sideways phase of the market where price can break above the neckline and then ultimately go back under it 2, 3, even 4 times before finally confirming the breakout of the pattern. Must remain patient and vigilant. As Larry Fink stated, many blackrock clients now view crypto as a flight to quality and the way the world is going, we may see people implement those flight plans sooner rather than later. *not financial advice*

XMRBTC Inverse head and shoulder sets up breakoutQuickpost
XMRBTC has been exploding sideways for over 1400 days. While it has done so it has created a macro symmetrical triangle that I suspect will break to the upside. There is a inverse head and shoulders that has been developing for about the last 6 months and is seems ready for the right shoulder to makes its move to the neckline then perform.
The inverse head and shoulder market is a mere 25%
The triangle target is about 400%.
This leads into the XMRUSD cup and handle which I want to get 150x out of.

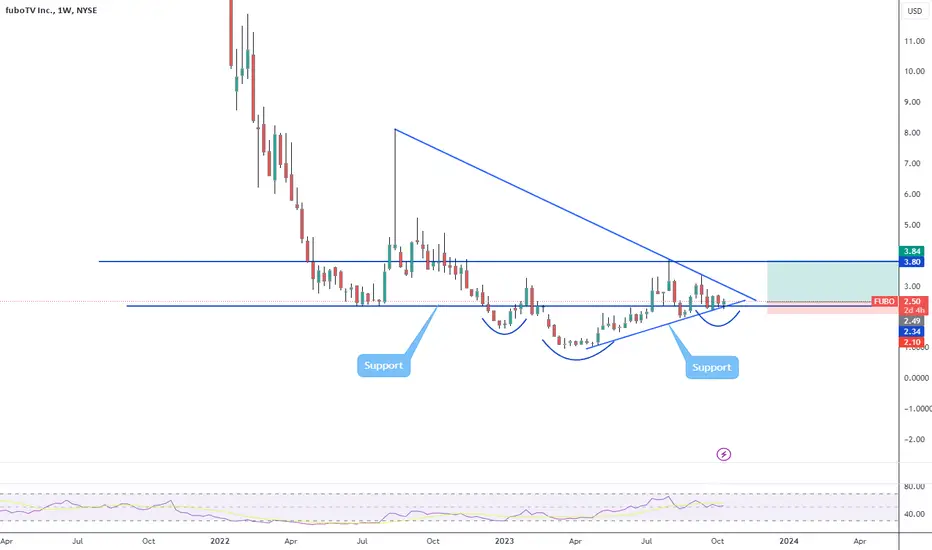
Good entry pointPrice is forming a triangle and inverse HS and is trading just over a strong support zone. It's a good entry point bc risk and reward is great. Low risk for a big gain. My SL triggers if a weekly candle closes below the support, I do it this way bc is a very volatile stock.
Who likes banks?The chart is very explicit. Price is forming an inverse HS at the trendline support. It can break out at any moment, today, tomorrow but soon. Even if the price is pushed back I wouldn't close the position. That trendline is very strong and most likely to try go higher again.

Great chartChart and fundamental very best stock for investment
Consider for portfolio stock
My Target is 7450 stoploss and 9500 Target
Israel war so be careful may be stock market bearish so take own risk no recommendation for buy and sell
No recommendation from me for buy or sell
Take own analysis

Potential quick break outPrice keeps pushing the upper vertex. Seems like an inverse HS is about to break up. The 4.2 - 4.8 zone is a strong resistance, If it pulls back I don't think is going to break that resistance zone mostly likely to try go high again. SL triggers if a daily candles CLOSES below support zone.

A little early but looks fineThe charts says it all, potential inverse HS. I'm already long but if I see that the pattern is playing out I will add. It could take a few more weeks or not, with this crazy market anything could happen. This pair is difficult, I has tried to break out before and it failed (yellow markups) so take profits on the way up.

Buying LTC HereTraders,
In addition to breaking out of the triangle, LTC has now formed and broken the neckline of an Inverse Head and Shoulders. The target here takes us straight to the underside of that RED TL (major resistance) and that will be my target.
Entry = 67.67
Target = around 78-80
SL = under 63
R/R = 2.5
Additionally, I have move the stops of ALL my other trades up to capture at least half the profit of each trade. ALL are in the profit now.
Best,
Stew

Bitcoin - Ready to reach 30k! (watch this trendline)
Bitcoin is bullish and is ready to reach 29167 in the next few days or at the start of October. Of course, 30k will follow, but 29k is a strong resistance, and we should see a pullback from it!
Watch this yellow trendline, which is a gateway to the ultra-huge bull market. Once it breaks, I expect a massive uptrend, but be aware of a possible retest first. Your stop-loss needs to be safe!
So why is the 29167 level of resistance strong? We have the 0.618 Fibonacci retracement of the previous downtrend, and we also have a point of control on the volume profile. What's more, it's the start of the fair value gap. I am definitely expecting a pullback from it!
It's always important to do an Elliott Wave analysis because it gives us an outlook on the overall trend and market structure. In the downtrend from 31k to 25k, I see a complex correction—the triple-three pattern WXYXZ. This is a corrective move and shows a lot of weakness. That's why I am bullish!
26k is still a good price for Bitcoin to buy in the long term because I expect 120k in 2025. Why 125? Check out my profile or my previous analyses!
It's also important to watch altcoins and how they are doing because it gives us another good indicator for Bitcoin. Of course, altcoins such as ETH, XRP, and DOGE are bullish. This was a quick update on the local price of Bitcoin.
This analysis is not a trade setup; there is no stop-loss, entry point, profit target, expected duration of the trade, risk-to-reward ratio, or timing. I share my trades transparently and privately.
Thank you, and for more ideas, hit "Like" and "Follow"!

Coinbase Textbook Bottoming Pattern Found Hi Guys! This is a Technical Analysis of Coinbase (COIN) on the 1 week timeframe.
As you can see we have drawn out a Inverse Head & Shoulder Pattern forming in COIN.
This is a textbook pattern as it follows to the t the necessary criteria both in price action and volume.
Stages of the Price Action
Downtrend to form Left Shoulder
The rally from Left Shoulder does not breach the Neckline
Downtrend from peak of rally to form Head
The rally from the Head also does not breach the Neckline
Downtrend from Peak of rally to form Right Shoulder
The rally from the Right Shoulder breaches the Neckline
A Return move from the breakout back to Neckline -> This stage we are currently playing out
Volume Signs of Textbook Inverse Head & Shoulder
1. Left Shoulder has taller volume bar (higher volume) than Head Volume
2. Lighter volume or shorter bars seen for Head than Left Shoulder
3. The rally from Head to Right Shoulder has increasing volume that exceeds volume of the rally from left shoulder to neckline
4. DOwntrend to Right Shoulder -> shows a declining volume bar height / declining volume
5. Sharp Spike on Volume during rally from Right Shoulder to Neckline breakout
6. Declining Volume during current move, the Return Move
Thoughts:
Both times we rallied from the shoulders we reached a Resistance zone and got rejected.
I believe we are currently in the "Return Move" to test the Neckline as Support
-> The areas i am looking is:
1. 0.5 FIB Level, this is also where the 21 EMA converges so a Support zone to watch
This area is important because it is the "Golden Zone" for FIB, as well as where the 21 EMA is at. This makes this area a place to observe for potential bounce. Though i believe this to be short lived.
2. Testing Support on the NECKLINE SUPPORT line
3. This one is least likely but nevertheless still possible, the 0.382 FIB Level, a potential scenario being a WICK down from testing support on Neckline
After testing these levels i believe that Coinbase will start its Bull run where it has tremendous growth in market cap
A first target would be breaching the Resistance zone and confirming it as Support.
Take a look for yourself. Experts let me know what yall think!
Stay tuned for more updates on COIN in the near future.
Thank you for taking the time to read my analysis. Hope it helped keep you informed. Please do support my ideas by boosting, following me and commenting. Thanks again.
If you have any questions, do reach out. Thank you again.
DISCLAIMER: This is not financial advice, i am not a financial advisor. The thoughts expressed in the posts are my opinion and for educational purposes. Do not use my ideas for the basis of your trading strategy, make sure to work out your own strategy and when trading always spend majority of your time on risk management strategy.

Double bullish patternWe have here a double bottom working as the head of an inverse HS and this a two weeks chart. Price tested the support and passed the test. It wants to go higher. I find this setup very reliable, SL below the lower level of two months ago. Just be patient we may see a lot back and forward in the upcoming days.

Beyond Meat Bottom Pattern Formation SpottedHi Guys! This is a Technical Analysis on Beyond Meat (BYND) on the 3 Day Timeframe.
I believe we are in the process of forming an Inverse Head & Shoulders Pattern.
Currently in the process of solidfying the Right Shoulder.
Which i believe will/ can take couple weeks to form before rallying past neckline.
So far every part of this pattern has been textbook.
SUCH THAT ->
Every part of the Head & Shoulders that formed, the VOLUME has reacted a specific way.
Stages of the Price Action
1. Downtrend to form Left Shoulder
2. The rally from Left Shoulder does not breach the Neckline
3. Downtrend from peak of rally to form Head
4. The rally from the Head also does not breach the Neckline
5. Downtrend from Peak of Head rally to form Right Shoulder
6. The rally from the Right Shoulder breaches and moves above the Neckline
7. A Return move from the breakout back to Neckline
8. Test of Support and a bounce from here going above the peak of Right Shoulder Rally
So far we've hit Stages 1-4.
We are currently in the process of forming the Right Shoulder and completing stage 5.
We need to pay attention on the completion of the Right Shoulder and the next stages of the Inverse Head & Shoulder, particularly this next potential RALLY.
It MUST Breach and move above the NECKLINE.
Volume Signs of Textbook Inverse Head & Shoulder
1. Left Shoulder has taller volume bar (higher volume) than Head Volume
2. Lighter volume or shorter bars seen for Head than Left Shoulder
3. The rally from Head has increasing volume that exceeds volume of the rally from left shoulder to neckline
4. Downtrend to Right Shoulder -> shows a declining volume bar height / declining volume
After the formation of the Right shoulder we need to see:
1. Sharp Spike on Volume during rally from Right Shoulder to Neckline breakout
2. Declining Volume during the Return Move
So far so good. And we need to continue to pay attention to make sure all the criteria is being hit.
Now targets for Right Shoulder Rally, is hard to tell.
BUT the previous rallies could not pass the RED RESISTANCE ZONE. So im thinking we can move into it but we dont get ABOVE it.
We need to watch the VOLUME -> there has to be a sharp spike on volume during this rally.
__________________________________________________________________________________
Thank you for taking the time to read my analysis. Hope it helped keep you informed. Please do support my ideas by boosting, following me and commenting. Thanks again.
Stay tuned for more updates on BYND in the near future.
If you have any questions, do reach out. Thank you again.
DISCLAIMER: This is not financial advice, i am not a financial advisor. The thoughts expressed in the posts are my opinion and for educational purposes. Do not use my ideas for the basis of your trading strategy, make sure to work out your own strategy and when trading always spend majority of your time on risk management strategy

How to Head and ShouldersGreetings, Financial Enthusiasts! 🌟 If you appreciate our charts, give us a quick 💜💜
The Head and Shoulders pattern is a well-known chart formation in technical analysis. It indicates a reversal from a bullish to a bearish trend, usually at the end of an upward trend.
Key Points:
- Head and Shoulders: Chart pattern signaling trend reversal.
- Formation: Three peaks on a baseline - two lower outer peaks and a higher middle peak.
- Bullish to Bearish: Suggests a shift from an upward trend to a downward one.
- Applicability: Seen on all timeframes, suitable for various traders and investors.
- Entry Levels: Easily identifiable, aiding in trade implementation.
Why It Matters:
The Head and Shoulders pattern provides traders with a visual representation of a trend reversal. It's widely used due to its simplicity and applicability across different timeframes.
The Pattern:
- Formation (Market Tops):
1. Left Shoulder: Price rises, forms a peak, then falls.
2. Head: Price rises again, forming a higher peak.
3. Right Shoulder: Price falls again, then rises but forms a lower peak than the head.
- Formation (Market Bottoms):
1. Left Shoulder: Price falls, forms a trough, then rises.
2. Head: Price falls again, forming a lower trough.
3. Right Shoulder: Price rises again, then falls, forming a higher trough than the head.
Neckline:
- For Market Tops: Connect the low after the left shoulder to the low following the head to create the neckline.
- For Market Bottoms: Connect the high after the left shoulder to the high after the head to form the neckline.
Trading the Pattern:
- Wait for the pattern to complete before trading.
- Entry when price breaks below the neckline (tops) or above it (bottoms).
- Stops placed above the right shoulder (tops) or below it (bottoms).
- Profit targets calculated based on the head-to-shoulder difference and added (bottoms) or subtracted (tops) from the breakout level.
Why It Works:
- Sellers enter as price falls from its peak, reducing aggressive buying.
- The neckline marks a point where traders exit positions, driving price toward the target.
- A lower right shoulder (tops) or higher right shoulder (bottoms) signals a trend shift.
- Profit target assumes forced exits by those in losing positions.
- The neckline prompts many traders to exit, pushing price towards the target.
- Volume analysis helps confirm patterns; expanding volume (bottoms) shows increased buying interest.
Pitfalls:
- Waiting for pattern completion may require patience.
- Not all patterns lead to successful trades.
- Profit targets aren't always reached.
- External events can disrupt patterns.
- Patterns can be subjective; traders should define their criteria.
The Head and Shoulders pattern, though not foolproof, provides a structured approach to identify and act on trend reversals.
