GODREJCP FUTURESGodrejcp Jan Futures made inverse head n shoulder pattern on 30 min TF with good OI build up.
Could be bought with mentioned stoploss & target.
Inverse Head and Shoulders

MNST | Inverse Head and Shoulder | BullishMonster Beverage Corporation, through its subsidiaries, engages in development, marketing, sale, and distribution of energy drink beverages and concentrates in the United States and internationally. The company operates through three segments: Monster Energy Drinks, Strategic Brands, and Other. It offers carbonated energy drinks, non-carbonated, ready-to-drink iced teas, lemonades, juice cocktails, single-serve juices and fruit beverages, ready-to-drink dairy and coffee drinks, energy drinks, sports drinks and single-serve still waters, and sodas that are considered natural, sparkling juices, and flavored sparkling beverages. The company sells its products to bottlers, full-service beverage distributors, as well as sells directly to retail grocery and speciality chains, wholesalers, club stores, mass merchandisers, convenience chains, drug stores, foodservice customers, value stores, e-commerce retailers, and the military; and concentrates and/or beverage bases to authorized bottling and canning operations. It provides its products under the Monster Energy, Monster Energy Ultra, Monster Rehab, Monster Energy Nitro, Java Monster, Muscle Monster, Espresso Monster, Punch Monster, Juice Monster, Monster Hydro Energy Water, Monster Hydro Super Sport, Monster HydroSport Super Fuel, Monster Super Fuel, Monster Dragon Tea, Reign Total Body Fuel, and Reign Inferno Thermogenic Fuel, as well as NOS, Full Throttle, Burn, Mother, Nalu, Ultra Energy, Play and Power Play (stylized), Relentless, BPM, BU, Gladiator, Samurai, Live+, Predator, Fury, and True North brands. The company was formerly known as Hansen Natural Corporation and changed its name to Monster Beverage Corporation in January 2012. Monster Beverage Corporation was founded in 1985 and is headquartered in Corona, California.

$NVDA Inverse HEAD AND SHOULDERS$NVDA has an inverse head and shoulders on the daily chart. Short term target is $190

NVDA - approaching neckline (bull watch)NVDA was gyrating in a wild and wide base in the last 6 months. On 14 Dec it even went above the 200 day moving average but alas it proved to be shortlived as it began to retace 61.8% of the swing (AB) , forming what is now apparent a potential inverse Head & Shoulders pattern.
As of now NVDA is trading above it's 200 day moving average again (a postiive) and a golden cross could happen (although not yet) in the near future (2nd positive if and when it does happen). The odds of a successful breakup is higher than it was earlier.
An aggressive trader would buy the next breakup @ 184 (#1 in chart) with initial stop loss below 170 while a more conservative approach is to wait for the 1st pullback after the breakup and only enter the trade as it rebound and starts to surpass the first high above the neckline (#2).
The #2 or more conservative way of going long is to wait for the upside momentum to be firmer such that retracements are likely to be less steep by then.
Disclaimer: Just my 2 cents and not a trade advice. I may or may not enter into this trade. Kindly do your own due diligence and trade according to your own risk tolerance and don't forget that money management is important! Take care and Good Luck!

Inverted HNS — Reversal of the downtrendAfter the ceasefire in Ukraine, many traders are cautiously optimistic as the markets may be turning around. The appearance of an inverse head and shoulders pattern hints at a possible reversal in the downward trend since the Ukraine invasion. This could be a sign of a positive shift in the markets and could potentially open up some great investment opportunities. Traders should be sure to watch the markets closely for any potential opportunities that arise in the coming weeks.
The appearance of bullish flag pattern in the right shoulder might also indicate a continuation of recent uptrend.
The price is currently in a strong weekly resistance zone. This is a strong resistance zone that matches 0.5 level of weekly Fibonacci retracement, also it is the neckline of the inverse head and shoulder pattern. I am eagerly awaiting the break of this resistance, which will be a big big opportunity. For the breaking, I am looking for breaking candle body to be greater than 1.5 ATR; and if there is no break, I am looking for reversal candle which could be e decline from the resistance zone.
Additional confirmations
—————————————-
The cables most negatively correlated EURGBP pair is also in its weekly resistance zone. This pair is in the process of making a double top chart pattern in 4H TF. This could indicate a rejection from the resistance zone and if that happens, the price will face down as the GU faces the opposite direction.

VGI | Wave Projection | Inv. H&S TFW Breakout Target +30% upsidePrice action and chart pattern trading setup & target
> This wave analysis in weekly timeframe indicates a possible new 1-wave ABC uptrend reversal pattern with an inversed head & shoulders pattern support.
> ENTRY: A possible pullback trade at neckline breakout zone
> TARGET: head & shoulders targeting 1.618 extension +30% upside
> RESISTANCE: 1.0 Fibonanci extension zone 5.30+ baht
> STOP: right shoulder zone -10% risk
> RRR: 3:1
Always trade with affordable risk and respect your stoploss
Goodluck

BTCUSD: Bearish Bat Looking to retrace back to $18448.51Bitcoin looks ready to begin creating the Potential Right Shoulder of this Potential Inverse Head and Shoulders as it is at the level of what would have to be the neckline while overbought and within the 0.886-1.13 PCZ of this Bearish Alternate Bat it's traded within.
If this Inverted Head and Shoulders plays out, the Alternate Bat will underperform and not give us the full 100% Retrace backdown to 15.3k; but if not the price will go much lower and perhaps even lower than 15k so i will be managing risks from here.
For the time being i will be taking a third of my profits off and buying a monthly strangle along with a seperate weekly slightly OTM put as a way to secure my position on price action at a lower risk.

Celo forming a beautiful inv h&s patternCurrently wicking below the neckline on the right shoulder…I’m not 100% confident it will trigger a breakout on the first candle of the right shoulder to reach the neckline, so I arbitrarily moved the measured move line a few daily candles forward to give it some time to fight the neckline resistance…whenever we see that it has clearly triggered the breakout above the neckline then I will readjust the dotted green measured move line accordingly to the point of the break out. For now it’s just been placed there arbitrarily. Will update when and if we have a valid breakout….there’s no guarantee we will even validated a breakout just yet. The way the market is going recently probability currently favors a breakout slightly, but my guess is it will take a few candles testing the neckline first as we can see that the current daily candle is wicking down exactly after testing the neckline. *not financial advice*

BTC ready for pumpHello Guys,
There is a inverse head and shoulder finished on 2H on the chart a breakout and than a swap of 17500 liquidity soon.

Long Idea As we can see here HST has been moving in a huge symmetrical triangle as we can see here the stock consolidates for about 2 weeks and a half once touching down at support before breaking out to the upside to once again touch the resistance.
Things to NOTE:
1. Bullish Divergence on the RSI
2. Inverse H & S @HERE
3.Bullish PIN BAR on the WEEKLY time frame
These are very strong indicators that HST may see a move up on the upcoming weeks. Play it as you will, I'd love to hear your input on this or exchange ideas on other possible stock moves. Happy trading fellas :" }

MANA pump?here we have an inverse head and shoulders on the four hour time frame. Other metaverse coins are showing strength, seeing if we can catch MANA

KHC: WARREN BUFFET'S HOLDING BREAKOUTKHC (Kraft Heinz):
I like the risk vs reward on the daily chart as it broke the neckline of an inverted head and shoulders and has just come to retest the breakout spot.
Good enough for a long swing trade for me. Target of the inverted head and shoulders is in the 45 zone.
If you look at the weekly chart, you'll see a nice rectangle range between 32.65 and 44.65.
We're now in the middle of that range so if the inverted head and shoulders plays out we could reach the top of the rectangle.
Stop at 38.2.
Trade safe!

ILMN - inverse H&S breakupILMN has broken up of an inverse H&S neckline last Friday on relatively strong volume.
Let's see if the stock can make a more decisive move to the upside in the coming days.
Otherwise it could continue to be choppy pending earnings release (expected on 3rd November). In any case, it looks like the bottom is in with this base formation
Disclaimer: Just my 2 cents and not a trade advice. Kindly do your own due diligence and trade according to your own risk tolerance and don't forget that money management is important! Take care and Good Luck!

Binance 80% CRASH! Black swan crypto event.
Fundamentals first. Binance Exchange is losing customers; that is a fact that everyone knows. The huge scandal occurred just before Christmas, but it looks like people have already forgotten what happened.
What is causing Binance Exchange to lose customers? First of all, Binance Exchange itself is banning users all around the world for no reason. My friend got banned before Christmas, 1 day after he opened a short position on BNBUSDTPERP futures. I received a lot of messages from people all around the world saying they received an email with a permanent account suspension. Half of them could withdraw their funds; the other half could not. So if you received this email and you don't know why, Binance Exchange can ban you without any reason, just if they want to.
There is a conspiracy theory (not verified) that Binance cannot have a monopoly on crypto; bigger players refuse to accept this fact, so they need to reduce it by force.
I think Binance is a great exchange, the most liquid exchange. But these are facts that everyone can verify.
BNB coin is currently worth 245 USDT. In my opinion, the price is very expensive at this moment, due to recent scandals and lost customers. 50 - 100 USDT is a fair price to me; I am not willing to pay more for the coin.
If something is too big, it will destroy itself, so there needs to be competition. Monopoly is not a good thing.
I want to give you some tips: do not short BNB directly on the Binance exchange if you don't want to get permanently banned like my friend.
The best option is to store your cryptocurrency in a hardware wallet such as Trezor. And use only a portion of your funds on exchanges to trade spot or futures. Leverage is good because you don't need all your funds and will transfer the risk to the exchange. Together with "stop limit" orders, you can trade very effectively even with a small amount of your funds on exchanges.
Binance CEO Changpeng Zhao (CZ) said on Twitter that "for most people, for 99% of people today, asking them to hold crypto on their own, they will end up losing it." In other words, if you hold crypto on your own, you will lose your funds, so you should hold all your funds on exchanges. I was shocked when I saw this. He made this statement during the massive bank run on his exchange, giving the impression to others that he was threatening people and convincing them that their funds are safe only in his exchange.
-----------------------------------------------------------
Now let's take a look at the technical analysis, which is the main reason why I am bearish on BNB. Both the technical and fundamental analyses are bearish.
The uptrend from June 13, 2022, to November 7, 2022, is clearly weak. It's an ABC corrective pattern, which is usually followed by a massive crash.
80% crash to 48 USDT is, in my opinion, very possible. Everything is going down, including META stocks, TSLA, etc. So if you believe in the future of Binance, 48 USDT is your desired price.
You have no idea how much BNB people accumulated in previous years or how many leveraged long positions on futures are open. The market usually wants liquidity.
The price has been moving in the descending parallel channel, and we can retest the channel from the downside.
As per my Elliott Wave analysis, the whole structure looks very weak. The first impulse wave appears to be an ending diagonal wedge. The bulls are not interested in this coin.
48 USDT is a very strong support because it marks the beginning of the massive gap from 2021 as well as the breakout level of the previous structure from 2020.
I am very bearish on the crypto space, not just the BNB coin, as you may have seen from my previous posts.
Binance is the most liquid exchange and CZ Binance did a great job bulding it.
Thank you, and happy New Year!

XRP - Whales will start buying XRP here. But first a 55% DROP!
This head and shoulders pattern on the weekly chart is almost ready for a breakdown, so this is your last chance to sell XRP and save your money!
On the other side, it's a great opportunity to short XRP on the futures market, as I already did at the top of the right shoulder (see my previous idea)!
But be careful; XRP is the beast, and I know XRP very well, more than most other people. Overlaps between waves are common, and movements can be difficult at times, but they are doable.
If you ask me when moon for XRP? I can tell you that after we hit 0,1 - 0,09 USDT, the whales will start buying massively.
The whales are going to send XRP to the moon! And I am telling you it will be massive; you don't want to miss it, so hit the LIKE if you think I am right.
But let's be realistic; this is the biggest bear market in history, and it's better to buy XRP at a cheaper price.
XRP is stuck in this parallel channel on the weekly chart, and the bears are in full control. There are no signs of a trend reversal at all. No buying alerts from whales
As per my Elliott Wave analysis, this downtrend is so incomplete. We are in the middle of the bearish trend that started on April 13, 2021. But we are basically finishing the downtrend that started in 2018.
It can take another 1-2 years for XRP to bottom out. XRP is ranked 6 on CoinGecko, which is pretty impressive.
Transactions on XRP are extremely fast and extremely cheap, so it's a pleasure to use it for payments. But it's not a digital gold nor a store of value and will never be, this can only be Bitcoin.
Thank you, and for more ideas, hit "Like" and "Follow"!

FTM Could be long Due to Pure PA With Proper RMI Have draw A chart of FTM/USDTPERP and during analysis found to price action scenario with bullish moment.
First It's Inverse H&S Pattern and Second Bullish flag.
Both Patterns are pure bullish but seeing a market now days totally sideways or ranging so if I trade this pair so I'm calculate Risk Management with safe side Margin %age. Because everyne knows trading is risk so when market gave pattern then Should be pick a opportunity.

HUGE SPY Call(+100%)This one was HUGEEEEE. I've noticed one thing now. TRADE INVERSE HEAD AND SHOULDERS. I mean my goodness, we traded it 3 timtes this week or around there, and didn't lose once. Opposite of that on every play we had +50% or more.
Entry:
INVERSE HEAD AND SHOULDERS(Best strategy ever)
5 min -
Inverse head and shoulders
RSI above 50
1 min -
HUGE inverse head and shoulders
Got the trade off pullback of right shoulders(marked the zone green from top of body to low of body and took the trade once it got in there).
Instead of buying as soon as it got in the zone, I bought when price closed above 14 EMA
BT cloud flip
Held trendline

Fractalic inverse H&S (and double bottoms) The title says it all.
The volume also contradicts the bearish trend and confirms the subsequent bullish trend/correction.
Hope this helps you in your market analysis!

MAHINDCIEInvestmentPick
MAHINDCIE
Inverse Head & Shoulders Pattern
Already gave buy @ 263_267 & active from 267. Now breaking out of Inverse Head & Shoulders Pattern. MCB above 316 will be confirmation of break out & its pattern tgts - 460 / 560.
Long-Term Tgts - 650 / 780 / 990

XRP Inverse Head & Shoulders Pattern Forming - 4Hr ChartA different perspective for my same call to .44cents 0.618 golden ratio fib extension.
Inverse Head & Shoulders Pattern Forming on the 4Hr Chart.
I think we are due for a reversal very soon...

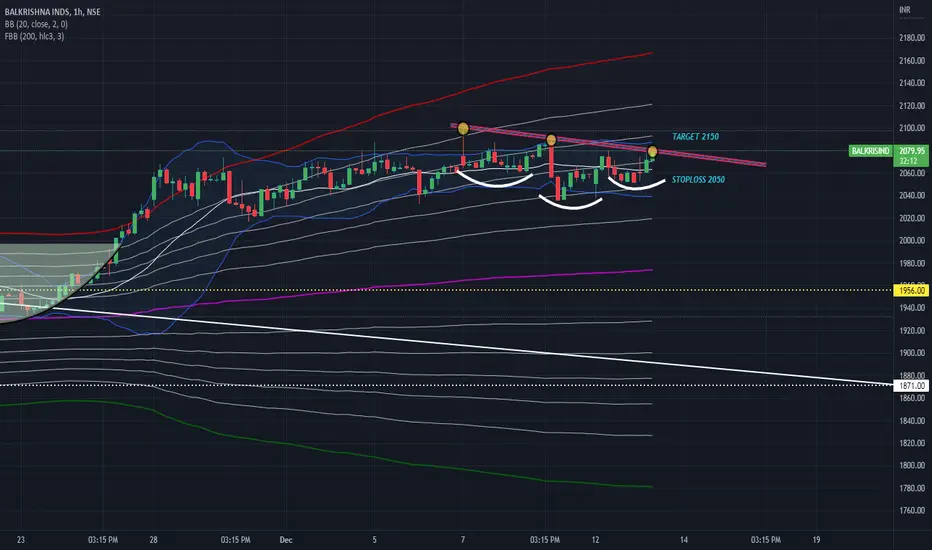
BalkrishnaBalkrishna made triangle & inverse H&S pattern on hourly charts with decent volumes & is on the verge of breaking neckline.
Could be bought with mentioned stoploss & targets.
Silver appears to be triggering an inverse head & shouldersOne of the bigger green candlesticks we’ve seen on the daily chart for silver in awhile…would not be surprised if this breakout takes us to the $22 measured move target. The 1day 200 ma(in blue) will be waiting in that zone to likely provide resistance. *Not financial advice*

GE Weekly View - Potential Inverse Head and Shouldersmost of my notes and thoughts are on the chart
- 3 major moves to the down side, with what appears to be a iHnS potential taking shape
--Need to see much more volume (buying) to confirm with better probability that this pattern pans out
---low volume with price increase would indicate weakness imho
- IF, this were a legitimate inverse HnS and the pattern completed:
--Target of ~$300.00 as indicated by blue horizontal trendline
--*a more conservative target of ~$195 could be made and the higher target could fail due to resistance at yellow trendline
**(marked by the yellow X and the 2nd yellow X near $195)
*Note the time frame of this trade....several years to see in totality. This is something to just keep an eye on for longer term investment
this is not financial advice, simply notes on what i see and should be used for observation/education only
