An even bigger inverse h&s pattern appears on ALGOOn our way to hit the 2 targets I posted about previously from former inv h&s neckline breakouts, algo has now brought price action above an even higher inverse head and shoulder neckline. Stoch RSI is pretty over extended at this point so it would not surprise me at all if we see a dip back down to retest the neckline or even a few wicks or a candle close below the neckline before we are ready to validate the breakout above this new neckline. Of course, it could also just decide it wants to pump all the way to our next measured move target with no correction at all. I will keep hodling, but if I was leveraged i would dial down a good portion of my leverage after hitting the previous targets and try to add it back in upon a successful retest of the new neckline as support…if we do dip below the neckline as long as it holds the 50ma as support any dip below should be temporary. We maintain overall support on the 50 and then solidify support on the white neckline here we will likely validate another inv h&s breakout by the time algo’s golden cross occurs. *not financial advice*
Inverse Head and Shoulders

TU | Wave Projection | Bullish Dragon Pattern +25%Price action and chart pattern trading setup:
> A bullish dragon pattern with an uptrend ABC wave currently making a pullback to the rising channel support at the volume profile point of control
> The price is below key dynamic support SMA200 and SMA50 which is considered a downtrend movement or could just be a false break dump and pump
> Entry @ SMA50 and SMA200 breakout zone once the price recovered
> Stoploss @ B wave position -7% downside
> Target @ 1- 1.618 extension dragon head & shoulder zone
Always trade with affordable risk and respect your stoploss

BPCLBPCL made inverse head n shoulder pattern on an hourly chart with good volumes.
Could be bought with mentioned stoploss & target

VET Bullish Long!VET is going to finish the cup on a bullish trend and then go on to inverse head and shoulders! I see this heading to the first black line drawn on the chart in early December and the head and shoulders inverse completed in early January. After the new all time highs will be established!
#VET is #bullish in every way in my opinion.
This is my opinion and not financial advice.
Happy #CryptoTrading!

$CHZ - Ready for the Kick SHOTHello my Fellow TraderZ,
As FIFA World Cup is approaching closer, keep all the Football or the Fan Tokens in your radar. They will go insaneously popping up out of nowhere.
$CHZ #CHILIZ is one of them.
Look, $CHZ is forming class Inverse H&S on DTF. Though it is currently at the confluence of Resistance Zone of Horizontal R + Neckline of Inv. H&S, I'm bidding this one to break and go high after a slight pullback.
Either wait for the Break and retest or coming to the Support.
CHEERS!!!

1020: Bank Al JaziraPotential Setup
Needs confirmation (Inv. H & S Pattern in formation).
Watchout for Breakout
Short setup can be traded from bottom to the identified trendline
Watchout for breakout
Trade with stoploss
Ride the trend with trailing stop loss

Algorand appears to finally be triggering the inv h&s breakoutJust needs to flip the 1 day 200ma (in blue) to solidified support and it should reach both breakout targets not so long after. If it does I’m pretty confident it will see a golden cross in its near future. *not financial advice*

ULTRARECH CEMENT Has formed an inverse head and shoulder patter.ULTRATECH CEMENT has formed an inverse head and shoulder pattern and it is about to give a breakout after that we can plan for an entry.

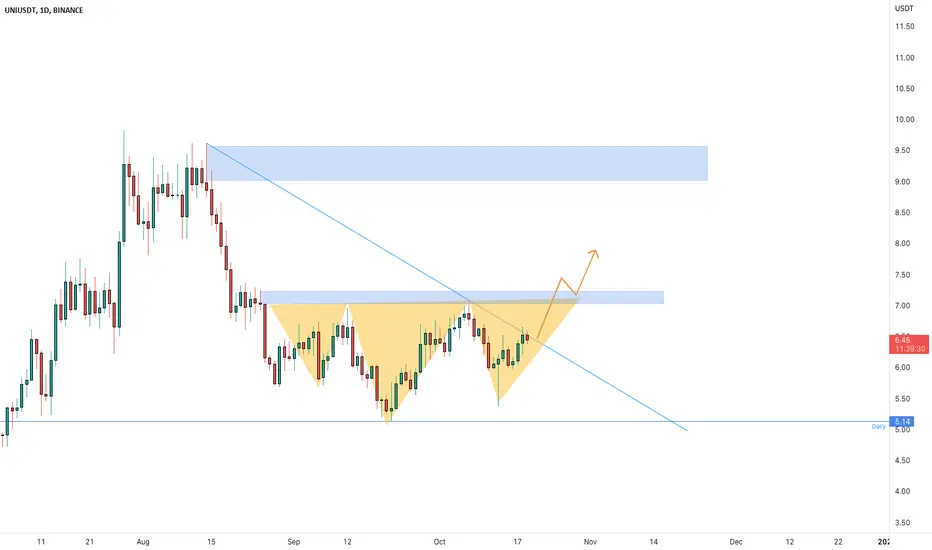
UNIUSDT is creating an inverse head and shouldersThe price bounced on 5.14 Daily support after a double top at 9.5$
Now the price is creating an inverse head and shoulders on the daily timeframe and the price is testing the dynamic daily resistance.
How to approach it?
IF the price is going to have a breakout and retest the resistance as new support, According to Plancton's strategy , we can set a nice order
–––––
Keep in mind.
🟣 Purple structure -> Monthly structure.
🔴 Red structure -> Weekly structure.
🔵 Blue structure -> Daily structure.
🟡 Yellow structure -> 4h structure.
⚫️ black structure -> <= 1h structure.
–––––
Follow the Shrimp 🦐
Curve CRV - 2000% profit! (lifetime opportunity)
This is a once-in-a-lifetime opportunity to buy CRV at this very low price because this coin can explode anytime soon!
2000% profit is real, no problem at all. You can buy this coin on the spot market or you can open a long position on the futures market.
CRV is currently ranked #78 on coinmarketcap, so there is a lot of room to go up. The market cap is relatively low.
Curve is a decentralized exchange for stablecoins that uses an automated market maker (AMM) to manage liquidity.
This setup is amazing from the Elliott Wave perspective because you can catch the third wave of the third wave, which is a dream setup!
The main trendline is breaking out, and wave 2 has been completed. It looks very promising; do not miss this opportunity.
I don't know what about you, but I am buying this coin! You can buy it with a small amount of your funds, if you want to allocate your capital somewhere else.
All-time high resistance is of course a strong resistance, so I recommend taking profits below this major level to make sure you will get filled.
Look at my ideas about crypto's total market cap, Bitcoin, and LDO in the related section down below.
For more analysis, hit "Like" and "Follow"!

Matic nearing a potential golden cross. 2 current bull targetsIf the golden cross occurs and sustains itself, we should see both of these bullish targets hit in the near future. We are currently above the yellow neckline and would reach the yellow target first. On the way there it would take us above the white channel, and flipping that channel to solidified support would validate its breakout and take us to the white price target. Best to keep an eye on the top trendline of the white channel as it is imperative that we flip its current resistance to solidified support in order to reach either target. *not financial advice*

SHIB: Looking VERY GOOD! Key points to watch next.• SHIB is trying to trigger an IH&S chart pattern just above the key support at the black line;
• Would be important to see SHIB breaking the blue and purple lines in order to trigger a bullish reversal – this could make it seek higher levels;
• However, if it loses the black line, it will frustrate any possible reversal thesis, and the next stop is at the next support, around the red line;
• Whatever side it breaks, SHIB looks interesting. For now, let’s pay attention to these lines on the chart.
Remember to follow me to keep in touch with my analyses!

$LIT - Will Lit your PortfolioHello my Fellow TraderZ,
This is to bring to your attention that next $MASK could be your $LIT #Litentry - another web3 project based on the ecosystem of #Polkadot.
On DTF, it seems like $LIT is forming an Inverse Head & Shoulder and incase it plays out will give a massive 70-80% profit.
Note : - This Resistance Zone is very crucial, so enter after breakout and retest only.
Trade Happily my Friend. CHEERS!!!

QQQ possible inverse head and shoulders on the dailyThe $QQQ is triggering a long setup on the right shoulder of a possible inverse head and shoulders.
A (conservative) measured move of the head to the neck, from the lower right shoulder, gives a target of $302.40.
The FOMC meeting is on Wed 11/02.
News on 10/27: "Economists at BlackRock are speaking with financial advisers, saying that they are expecting "pivot language" at the next Federal Open Market Committee (FOMC) meeting".
If these rumors prove true at the FOMC meeting, the market and QQQ could have the catalyst to reach the target (quickly).
This idea is only based on the charts, but the FOMC could provide a catalyst.

ERAA Reversal patternERAA . D1 time frame. Inverse head and shoulders pattern.
TP1 442.
TP2 470.
SL 408.
Watchout after it reach TP1, it might have retrace first before it goes to TP2.

TWTR | Wave Projection| Take Profit Position | Bear DivergencePrice action and chart pattern trading - The key area to watch
> The price is approaching the upper resistance channel and the target inverse head & shoulders pattern with a slight bearish divergence RSI signal.
> A possible partial profit taking zone and the price could retest its channel support SMA50 zone.

CDAY - will earnings be the catalyst?CDAY has formed an inverse H&S and is now trading close to it's 200 day moving average. However, the stock might not be on a sustainable uptrend just yet until it can clear the neckline around 70.80.
With earnings expected on 2nd Nov (AMC), let's see if it could propel the stock above the neckline. When it does, it is still prudent to place an initial stop loss (say) just 5% below the neckline (to avoid sharp drawdowns). It is always better to keep losses small and re-enter when technicals look right again.
Disclaimer: Just my 2 cents and not a trade advice. Kindly do your own due diligence and trade according to your own risk tolerance and don't forget that money management is important! Take care and Good Luck!

SIMP. Waiting for the next swing low. SIMP .
The story: after it broke the resistance, the resistance has become a support. Now it retest the support. The last candle is a bearish candle with little wick/shadow/tail. It means minim rejection, or I assume there was no rejection. So, it potential break the support and go down to the demand area to pick up some volume before it bounch back. If it happened, it will be inverse head and shoulders pattern and we are looking for the next swing low to enter. That is 1st scenario.
The second scenario, bull power so strong in the next candle and break the swing high (HH). If this happened, we can enter soon after it breaks the HH.
I think, in my prediction, 1st scenario will going to happen. Any other point of view, guys? Please share with me. Thank you.

SPY Bullish reversal survives earningsWith (hopefully) the most disappointing earnings reports behind us and depending on the news over the weekend, I'll be ready Monday to look for a move, from bulls or bears, that rebounds off the buy zone of ($386.96 - $389.29). I will note, while I acknowledge the possibility of a bearish move above, the bulls seem to have considerable advantage considering the the general trend formation at the moment.
There was a large inverse head and shoulders pattern that developed on the SPY chart over the past few weeks. Going into earnings I didn't feel the urge to act on it yet, but with big companies having reported, ill be looking to act on this more in the coming weeks. If we break out the math and study our levels: it appears the shoulders formed at $357.09, the head at $348.11, and the neckline at $375.45. This indicates that breaking to the upside yields a mid term technical goal of $402.79. Which just happens to be in the next buy/sell zone. These points seem to be confirmed by the characteristic volume spikes on the left shoulder, and head, while the sellers became noticeably absent about time of the right shoulder allowing bulls to regain control.
This play has a Risk to reward ratio of over 5, with the stop loss being a close under the lower limit of the buy zone : $386.96
As always, good luck to all.

WHA | Wave Projection | ABCDE Rising Triangle TargetPrice action and chart pattern trading setup:
> The key level to watch for the price now almost reaches the upcoming channel resistance and minor ABC pattern T1 zone.
> Take partial profit recommendation, most likely to retest the triangle neckline or breakdown making E wave dump and pump pattern.
> Entry @ neckline pullback zone 0.382 and S2 @ 0.618 SMA200D zone
> Target @ T2 Major ABC Target and Inverse Head & Shoulders +25%
> Stoploss @ SMA200D zone -8%
> Risk reward ratio: 3:1
Always trade with affordable risk and respect your stoploss

HEROMOTOHeromoto made inverted head & shoulder on hourly charts with good volumes, also breaking out of one month range with volumes.
Could be bought with mentioned stoploss & targets.

If tezos can flip the 50dma 2 support the invh&s should validateNeed to flip this orange 50 daily moving average to solid support and then we can validate the inverse head and shoulder breakout and head to this target. *not financial advice*

✅Bitcoin - Last chance to buy under 20k!
This is your last chance to buy Bitcoin below 20,000 USDT before it explodes to new all-time highs!
An inverse head and shoulders pattern is currently breaking out! The price is above the neckline, and you could wake up to a massive green dildo on the chart any day now.
If you are pumped, hit the like button right now!
Don't forget that November is the second strongest month for Bitcoin, with an average return of +21%.
The Elliott Wave is currently extremely bullish because we have completed an ABC correction for a previous impulsive wave and now we are preparing for a third impulse wave, which is usually the strongest.
If you are bearish, then comment on this idea!
The next stop is 30,600 USDT, which is a reasonable resistance. It is the head and shoulders measurement target + the previous symmetrical triangle point of control (POC). I expect a temporary downtrend from this level.
Inflation is on the way to 0% in a few years, as per my previous analysis, which you must check out in the related ideas down below!
We can hit a new all-time high next year. It's definitely a possible scenario, so you don't want to miss this upcoming huge move.
If you think this idea is interesting, then you should hit the like/boost button. Thank you!
