One more SPOOK for Halloween?Looks like an inverse H&S Potentially forming here.. into downward diag resistance..
Likely another spook for Halloween, to form the right shoulder, then a thrust up for November.. "Upvember"
Inverse Head and Shoulders

Bandusdt: Sell for Infinity fallHello traders!
Welcome back to another episode with Analyst Aadil1000x.
Today we are going to sell BANDusdt because of the inverse Head and Shoulder Pattern.
Stoploss 1.0978(-4%)
Target 1, 0.9922(+6%)
Final Target, Let it run

SPX - this rally could have legsDespite that bullish engulfing candle with strong volume on 13 Oct, the market continued to climb a wall of worry for the next 5 days. However last Friday's strong close is a "follow through" day that added to my conviction that this rally could last a fair bit.
On the Monthly Chart (not shown here):
A potential "bullish piercing candle" (monthly ) will be formed if by the end of this month we have a close above 3762. So let's see!
On the weekly chart:
1. SPX had rallied after testing the first major support @ 3500 on 13 October (last major support is around 3200, may not get there)
2. we see bullish divergence playing out
On the daily chart:
if SPX can close above it's immediate resistence @3800 (a mini inverse H&S neckline and also the 50% fib retracement of the recent XY down swing, then it could attempt to rally (minor pullbacks not withstandng) towards 4100 (inverse H&S target, incidentally 4000 - 4100 zone is critical as it also where the major downward trendline resistance is. The bears and bulls will be having their last battle here.
Could this be just another bear rally (albeit a strong one) or could the market have bottomed out at it's most recent low of 3491? I guess we will never know for sure except on hindsight.
The market seem to be resisting much lower levels than 3500 (at the worst case we could have a double dip back towards 3500 within the next few months although I feel the chance of market going lower than that is diminishing. Still protective stop loss is must.
p/s Fed starting to sound less hawkish in the coming days could be the ultimate signal for the bulls.
definition of "follow through day" here: www.investors.com
Disclaimer: Just my 2 cents and not a trade advice. Kindly do your own due diligence and trade according to your own risk tolerance and don't forget that money management is important! Take care and Good Luck!

HMPRO | Wave Projection | Complex Inv. Head & Shoulders BreakoutPrice action and chart pattern trading setup
> A possible bullish uptrend ABC scenario with complex inverse head & shoulders pattern with SMMA50D as its neckline BREAKOUT!
> The candlestick pattern is consolidating just above the breakout area which possibly retest its neckline next week before price push higher.
> Entry @ B1: PULLBACK retesting neckline within area of candlestick consolidation B2 @ breakout as follow buy.
> Target: Inverse head & shoulders T1 is fibo 1.0 extension and T2 just below 1.618 ext. zone + 12 - 18%
> Stoploss: right shoulder zone - 7 - 8%
> Risk reward ratio: 1.5 - 2: 1
> Indicator: RSI > 60 bullish channel and breakout MA
> The key fundamental analysis found that this coming high season after Thailand major flooding could trigger a boost in revenue and profit in upcoming Q4 company performance.
Always trade with affordable risk and respect your stoploss.

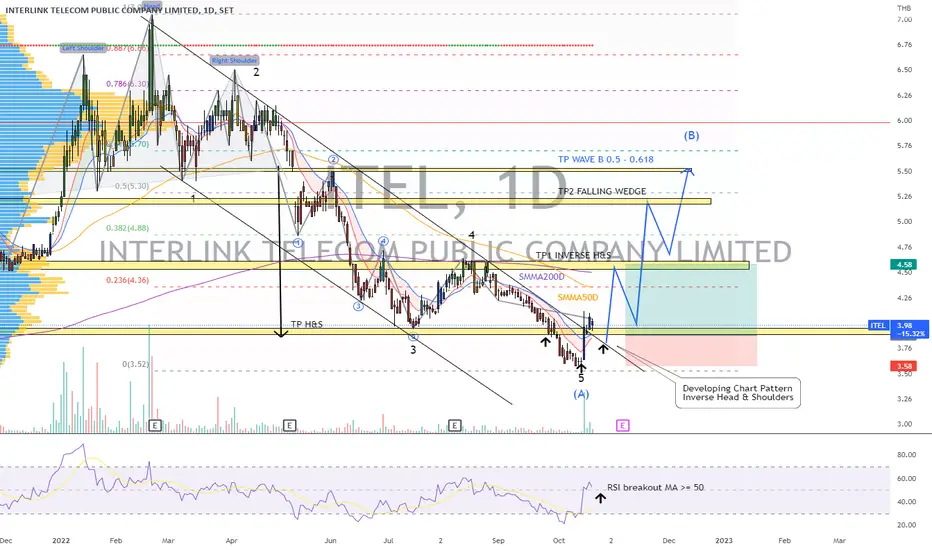
ITEL | Wave Projection | Downtrend Channel Breakout - A-Wave?Price action and chart pattern trading setup:
> A possible downtrend A-wave reversal zone at the 5-wave uptrend Head & Shoulders target
> Now breakout downtrend 5-wave channel and developing an Inverse Head & Shoulders reversal pattern below SMMA200D zone.
> If breakout successfully, A possible scenario for long entry, we could wait for price to retest its neckline.
> Target zone 1 - 2 - 3 as follows: Inverse H&S SMMA200 zone, bullish channel target, and B-wave targeting 0.5 - 0.618 retracement zone.
> Stoploss at inverse head & shoulders' head - 7 - 8%
> Risk reward ratio: 2:1 / 2.5:1 / 3:1 respectively
Always trade with affordable risk and respect your stoploss, nothing is 100%.
inverse head and shoulder Inverse head and shoulder appearing on support for SPX 500 much chance of going up as Rsi is also making bullish div double confirmation to head up to above mentioned resistance.
DYOR!!

Bitcoin - 2018 vs 2022
I know that bullish analysis on Bitcoin is extremely unpopular at this moment. I can feel it in the comment section of my several previous Bitcoin analysis.
The most popular ideas on TradingView are extremely bearish, and the sentiment is very negative and fearful.
Pretty much everyone is expecting 13k. In this case, I am not saying the crowd is wrong, because during a fifth impulse wave, the crowd might often be right.
The situation is, of course, very different this time compared to 2018, but I have seen a lot of these comparison analyses on Bitcoin, so let's do it.
The triangle in 2022 is really weird. It's probably not even a triangle. It looks like an inverse head and shoulders with a steep neckline or a double bottom reversal pattern.
Triangles usually appear just before the end of the trend or at the end of the trend. These patterns are, of course, very tricky.
There is a possibility of a last scam wick to the downside to 17,600-17,900 before the price explodes to the upside! But I hope the bulls will defend 17611 USDT because it's very important from the Elliott Wave perspective.
I hope the bulls will prevent Bitcoin from falling because I don't want a 5-year bear market, I think no one wants it in the crypto community.
For more analysis, hit "Like" and "Follow"!

TOST - potential golden cross & inverse H&SDespite the volatility, TOST is still showing superior relative strength to the market, now trading 66% above it's June's low of $12.
A golden cross (50day MA crossing above it's 200day MA) might be happening soon, plus it is also trading close to the neckline of now a more apparent inverse Head & Shoulders Base.
Perhaps these are signs that earnings (expected on 3 Nov) could surprise to the upside. Let's see!
p/s still a very volatile market. trade at own risk.
Disclaimer: Just my 2 cents and not a trade advice. Kindly do your own due diligence and trade according to your own risk tolerance and don't forget that money management is important! Take care and Good Luck!

7200 (MIS)Trendline Breakout
Inverted Head & Shoulder Pattern Formation
Biased: Bullish
Series of HH, HL
Watchout for the formation of HL (Retest)
Aggressive entry can be taken at current level (106.2)
Safe entry can be taken after formation of HL
Trade with SL,
Target Prices (fib levels) are mentioned, Ride the trend with trailing stop loss

NZDCADBottom blue levels indicate monthly support. Market reached support, also fulfilled Daily Fibonacci "D" extension.
Anticipating market movement towards monthly resistance (after Fibonnaci extension hit market begins new retracement phase).
Monthly = Direction
Daily = High or Low price
1Hour = entry
According to daily timeframe we are at a low price, still forming new Fibonacci "ABC" sequence.
Getting early entry on lower timeframe (1Hr) as market is forming higher highs and lows.
Also notice the head and shoulders pattern formation at monthly support.
Fundamentals in favour of NZD at time of posting this. LOTS of retail sellers in the market as we know most retail traders tend to lose money...
Entry:
11:00AM SA time
SL: 0.77563
TP: 0.78821 (next resistance)
Lot: 0.5

Quant continuing to pump; nearing a golden cross. Quant seems to be leading the market. Continuing to pump before the other cryptos and making its way towards a potential new inverse head and shoulder neckline. Of course it doesn’t have to find resistance at this neckline, but there is good probability it will…if so it should give us a great idea of where it’s next measured move will be once it breaks above the neckline. Also vastly approaching a golden cross here. Will be interesting to see where it’s price action goes in the next couple weeks but as of now I think I can safetly predict that it will at the very least reach this white line. *not financial advice*

We just hit my top QNTUSD breakout target & now have a new one!That was incredibly fast with practically no correction in between the last 3 targets we’ve hit. What’s interesting is the correction wick started forming at around 225 which essentially caused us to form another potential inverse head and shoulder pattern. This pattern is still very speculative considering we haven’t even began to form a right shoulder yet and with enough doom the price could easily blast back above this potential neckline and nullify the inv h&s pattern…however since I was able to predict the last inv h&s pattern precisely before the right shoulder formed and things tend to play out in fractals, it’s worth speculating that we may indeed be looking at yet another, bigger inverse head and shoulders pattern beginning to form its right shoulder here. Another great sign of bullish confluence for this becoming an inv h&s is if it does the breakout target (aka measured move) for this inv h&s would bring price action back up to the exact All time high! Anyways thought I post this now just in case it plays out like my previous ideas. Watching them obey TA so well has been very entertaining. No guarantee they will continue to do but would be awesome if they did. I will post my previous quant ideas below so you can see how well this has been playing out since June. *not financial advice*

Quant’s next target = $221-224We have hit our recent target and now set our sights on the $221-224 breakout target of the inverse h&s pattern with the white neckline. Often times we will se a slight correction or consolidation in between going from hitting one breakout target to hitting the next. However, sometimes price action can just keep pumping until it hits both targets. As of now, we haven’t really seen any significant correction after reaching our first target here but it could still potentially correct enough to even retest the white neckline. If we were icky enough to get that steep of a correction first and the neckline then confirms as solidified support that would be a location where I would add to my position. No guarantee it will return there before reaching the $221 target though so once again hodling is paying off. *not financial advice*

EURUSD SHORT TERM UPSIDE TREND CHANGE Looking for more rejection on and around 0.97 for a push to the upside.. I do think price can make a bit of a long term consolation from around this long term support... Be patient as always! trade smart and keep on top of risk management before entering any trade! Hope everyone has a good week

Bullish Dragon Litecoin Setup to Revisit $54.80 then $62.00Litecoin on the 4 Hour seems to be preparing to reverse trend and target the 54 dollar level at a minimum if we get really lucky it will go all the way to 62 before slowing down again.
On a sidenote the RSI is developing a Bullish HnS.

4164: NAHDI (TASI)Bullish Trend
Retracement from 50% fib level, Horizontal Support
Inv. H&S pattern formation
Entry @ current level (201)
TPs are mentioned, trade with Trailing Stoploss

WATCH $MDRX Bearish
- Inverse HS
- Inverse Cup and handle
- Broke upward trend
- Price at major S/R level / neckline
“Failure is simply an opportunity to begin again, this time more intelligently.”

WATCH $SCHWBearish
- Inverse HS
- Multi rejections upward trendline
- Multi rejections major S/R level
- Bear flag
- Multi rejections at 0.5 fibo retracement
“It always seems impossible until it's done.”

Cotton Candy Inverse head and shoulders on weekly btc chartThis is probably more valid on a 3 day chart or so but still valid on a weekly chart as well. We currently have 1 daily candle poking its ahead above this downward slanted bubble gum neckline. I’d say if we can close 2 consecutive 3day candles above the neckline it should validate the breakout. For now the breakout is not confirmed, but if it confirms here the breakout target will be 26.9k *not financial advice*

WATCH $BLKBearish
Too big to fail ?
- Inverse HS
- Double tops
- Inverse Cup and handle
- Price at major S/R level
“We are what we repeatedly do. Excellence, therefore, is not an act, but a habit.”

WATCH $ACIBearish
- Double tops
- Inverse head and shoulders
- Inverse cup and handle
- Bear flag
- Broke down neckline
- Broke down trend line
Everything bearish appeared here.
“A quitter never wins and a winner never quits.”

Wal-Mart (WMT) Appears Prime for a Run to the Upside!Wal-Mart Appears Prime for a Run to the Upside!
Patterns Identified- ABCD and an Inverse head & shoulders pattern on Wal-Mart's (WMT) daily chart!
I expect a break of the neckline over the next few sessions. We popped above the trendline today and came back inside the triangle. Also we closed slightly below the zone (see screenshot below).
My next entry on Wal-Mart will be above 135 or after we break and hold above the upper trendline.
Short % of float 1.09 (as of October 1, 2022).
Bias-Bullish
Peace in Love,
MrALtrades00

WATCH $UNPBEARISH
Trade what you see, not what you think.
“Life is 10% what happens to you and 90% how you react to it.”
