Once Crvusd confirms the invh&s breakout the target is .8737Currently firmly above the neckline of this inverse head and shoulders pattern. Could definitely still find a way back below the neckline but if it does return to the neckline and maintain it as support that is a solid place to go long or add to a position for my own personal strategy. *not financial advice*
Inverse Head and Shoulders

JUP/USDT: Classic Inverse Head & Shoulders Breakout!🚀 JUP Inverse Head and Shoulder Breakout – 80% Potential Incoming?! 👀🔥
Hey Traders! If you're all about high-conviction plays and real alpha, smash that 👍 and tap Follow for more setups that actually deliver! 💹💯
JUP is breaking out of a textbook Inverse Head and Shoulders pattern on the 12H timeframe — signaling a strong bullish reversal after a long downtrend.
🟢 Pattern: Inverse H&S
📊 Breakout Confirmation: Neckline flipped into support
🎯 Target Zone: $1.05+
🛡️ Invalidation: Close below $0.534
Momentum is shifting, and bulls seem to be back in charge. If this pattern plays out fully, we’re looking at a potential 70%+ move from current levels.
Let the chart speak. Keep this one on your radar!

EURAUD – Bullish Breakout from Inverse Head & Shoulders + Target🔍 Pattern Insight: Inverse Head & Shoulders – A Powerful Reversal Formation
On the weekly timeframe, EURAUD has completed and broken out of a textbook Inverse Head & Shoulders (IHS) pattern — a highly regarded bullish reversal setup that often signals the end of a downtrend and the beginning of a sustainable uptrend.
Let’s break it down:
Left Shoulder: Formed in mid-2021 after a strong downtrend, price found support and rebounded, forming the initial shoulder low.
Head: A lower low was established around early 2022, marking the deepest point of the pattern. This represents the last dominant push by sellers before exhaustion.
Right Shoulder: In late 2022 to early 2023, bulls stepped in earlier than before, establishing a higher low — a strong sign of decreasing bearish momentum and accumulation.
Neckline : A descending resistance trendline connecting the peaks between the shoulders and the head. Once broken, it confirms the IHS breakout and trend reversal.
This multi-year formation reflects a major psychological shift: sellers lost control at the head, and buyers gradually regained dominance at the right shoulder, eventually breaking resistance.
📉 Retest in Progress – High Probability Entry Zone
Post-breakout, price action has pulled back for a technical retest of the neckline and curve line support — a dynamic trendline representing growing bullish momentum. This retest is essential for validating the breakout and building the base for a continuation rally.
The convergence of support zones (neckline + curve line) around the 1.70–1.72 area provides a strong confluence zone where buyers may step in again. This is often viewed as a second-chance entry for traders who missed the breakout.
🎯 Measured Target Projection & Resistance Levels
The IHS pattern gives us a clear measured move:
Measured Move Target: Distance from the head to neckline (~2,800+ pips) projected from the breakout point.
Target Zone: 1.92 – 1.95, just above the major resistance zone.
Resistance Zone: 1.85 – 1.87 is a historically significant supply area and may act as interim resistance.
Break and close above the resistance zone would further validate the bullish trajectory and open the door for higher targets.
📌 Risk Management – Defined Parameters
To manage risk effectively, consider:
Stop Loss: Below the recent retest low and curve line support, ideally placed at 1.63848, protecting against a false breakout.
Entry Idea: If bullish confirmation (e.g., bullish engulfing candle, higher low on lower timeframe) appears at retest zone, initiate a long position.
Risk-to-Reward (RR): Targeting 1.92 from an entry around 1.72 offers a 4:1 RR or better — highly attractive for swing and position traders.
🧠 Psychological and Structural Significance
This pattern is not just technical — it represents behavioral change in the market:
The head shows capitulation — a final wave of bearish pressure.
The right shoulder indicates growing confidence in bulls and waning selling interest.
The neckline breakout is where sentiment flips — traders recognize the change and enter long positions, fueling the breakout.
The current retest phase is crucial. Many professional traders wait for this moment to confirm that support holds before fully committing.
🔎 Final Thoughts & Strategy
Trend has shifted bullish on the weekly chart after years of consolidation and decline.
We’re seeing a classic breakout–retest–continuation setup.
A breakout above 1.85 would likely trigger momentum traders and institutions, driving price swiftly toward the 1.92–1.95 range.
Invalidation: Break below 1.63848 would invalidate the pattern and shift sentiment back to neutral or bearish.
📈 Trade Plan Summary:
Pattern: Inverse Head & Shoulders (weekly)
Bias: Bullish
Entry Zone: 1.70 – 1.73 (retest area)
Target: 1.92+
Stop Loss: Below 1.63848
Risk Level: Medium (weekly setup, but long-term play)

Potential Inverse H&S120660 should be Crossed & Sustained
for further Upside (with Good Volumes)
Inverse H&S Potential Target is around 138000-140000

Bullish Setup
Closed at 141.02 (21-05-2025)
Beautiful Bullish Divergence +
Inverse H&S in progress.
As mentioned earlier, 144 - 146 is
an immediate resistance; once crossed
& sustained, we may witness 152 - 155
& then 175 - 180.

Beautiful SetupClosed at 141.02 (21-02-2025)
Beautiful Bullish Divergence +
Inverse H&S in progress.
As mentioned earlier, 144 - 146 is
an immediate resistance; once crossed
& sustained, we may witness 152 - 155
& then 175 - 180.

$ETH / $BTC Inverse Head and Shoulders Confirmed! NGL pretty much every chart i'm looking at rn looks crazy bullish 🐂
Inverse Head and Shoulder confirmed on ETH / BTC 🤯
The real test comes at the 200DMA as CRYPTOCAP:ETH has not traded above it in the past 307 days.

Bullish
Closed at 34.03 (21-05-2025)
Hidden Bullish Divergence on bigger tf.
Bullish Divergence on shorter tf.
Immediate resistance is around 34 - 34.10
Crossing & Sustaining this level may exposes
upside towards 47 - 48
However, mid way, 40-41 & 44-45 are important
resistances that should not be ignored.
On the flip side, 30 - 32 are important Support levels.
and 29.80 Must not Break on Monthly Basis.

Possible Setup..Immediate Resistance is around 40 - 40.50
Crossing this level will take it to 42.50 - 43

Inverse H & S pattern appearing..Currently at Resistance around 24.50
Inverse H & S pattern.
Sustaining this level may reach towards 25.50 & 26.70
It should not break 18.50; otherwise we may see trend
reversal.

Cup & Handle Pattern and Inverse Head & Shoulder Breakout - CDSLTechnical Analysis:
Current Price: ₹1408.8 (Note: Live prices can fluctuate. As of the market close on May 16, 2025, CDSL closed around ₹1417.00 on the NSE).
Target: Your target of ₹1800 suggests a significant potential upside.
Cup & Handle Pattern Breakout: This bullish continuation pattern, if confirmed, indicates potential for a strong upward move.
Inverse Head & Shoulder Breakout: This is a bullish reversal pattern, suggesting the end of a downtrend and the start of an uptrend. The confluence of these two bullish patterns adds strength to the potential upside.
Time Frame: A 1 to 3-month timeframe is reasonable for these patterns to play out, assuming the breakouts are sustained.
Confirming the Breakouts:
Volume: It's crucial to assess if both breakouts were accompanied by a noticeable increase in trading volume. Strong volume adds conviction to the validity of the breakouts.
Sustainability: Monitor if the price holds above the breakout levels in the coming trading sessions.
Potential Upside:
Target (₹1800): Represents a potential upside of approximately 27.8% from the ₹1408.8 level (or around 26.9% from the ₹1417.00 closing price).
Quarterly and Yearly Results & EPS Comparison:
Latest Quarter Result (March 2025): CDSL reported a consolidated net profit of ₹100.31 Crore, a decrease of -22.4% compared to the same quarter last year (March 2024). The total income for the quarter was ₹255.78 Crore, a decrease of -4.34% YoY.
Yearly Result (FY2025): For the full fiscal year ending March 2025, CDSL's total revenue stood at ₹984.58 Crore, a growth of 32.53% compared to the previous fiscal year (FY2024). The profit after tax for FY25 was ₹462.10 Crore, a growth of 27.19% YoY.
EPS Comparison:
Quarterly EPS (March 2025): ₹3.86, compared to ₹4.66 in March 2024.
Yearly EPS (FY2025): ₹22.11, compared to ₹34.77 in FY2024. The yearly EPS shows a decrease despite revenue and profit growth, which could be due to an increase in the number of outstanding shares or other accounting adjustments.
P/E Comparison:
Based on the closing price of ₹1417.00 and the TTM (Trailing Twelve Months) EPS of approximately ₹25.20, the current P/E ratio is around 56.23.
Comparing this to peers like Computer Age Management Services (CAMS) with a P/E of around 43.73 and KFin Technologies with a P/E of around 55.97 (as of recent data), CDSL's P/E is in a similar range or slightly higher than some peers.
Corporate Action:
Dividend: CDSL has declared a final dividend of ₹12.50 per share for the fiscal year ending March 31, 2025, subject to shareholder approval. The ex-dividend date and payment date will be announced later.
In the quarter ending March 2024, CDSL declared a dividend of ₹3 per share.
Key Factors to Monitor:
Breakout Confirmation: Watch for sustained price action above the breakout levels with good volume for both the Cup & Handle and Inverse Head & Shoulder patterns.
Earnings Impact: Analyze how the market reacts to the recent quarterly and yearly results. While the yearly revenue and profit showed growth, the decrease in quarterly profit and yearly EPS might be a point of concern for some investors.
Market Sentiment: Overall market sentiment and the performance of the financial services sector will influence CDSL's price.
Dividend Announcement: Keep an eye on the record date and payment date for the declared dividend.

Is about to do somethingPrice just tested the support zone and is bouncing off. This is not a dead cat bounce, is going for more. TP 1 at 4.5, TP 2 at 6. SL triggers if a daily candle closes as shown. But it has to close. This stock is highly volatile, be careful.

NIFTY ON SALE SALE SALENifty is in the making of inverse head n shoulder pattern on daily charts.
Risk:Reward = 1:20
Could bought here with closing basis stoploss below 21775 & target is almost 2000 points from here.
Not to b missed level.

Inverse H&SBeautiful Inverse H&S pattern in place.
Sustaining 42 may lead it towards 48 & then 50 - 54.
39 - 40 can be an immediate Support.
However, breaking 36 may bring more Selling pressure.

BAJELBAJEL seems a perfect candidate for very short term momentum play. Showing Inverted H&S pattern breakout with decent volume. We may see 18-20% rally from this breakout level. Pattern may confirm pause in recent fall and now showing strong reversal from here. 178 is very strong support. Risk reward is in favor!

$COIN is FLYING! 33% UpsideNASDAQ:COIN Trade Alert 🚨
🎯$240🎯$286 (MM)
- Inverse H&S Breakout ✅
- Massive Volume GAP ✅
- Bullish H5 Indicator ✅
- Crypto flying ✅
Not financial advice

Bitcoin Chart Pattern Signals Possible Dip Before Pump!🚀 Hey Traders! 👋
If you’re finding value in this analysis, smash that 👍 and hit Follow for high-accuracy trade setups that actually deliver! 💹🔥
📉 #BTC – Potential Inverse Head & Shoulders in Play
Bitcoin is showing signs of a classic inverse head and shoulders formation on the daily chart. However, it's facing heavy resistance near the neckline around the $106,000 zone.
🧠 Possible Scenario:
A correction toward the GETTEX:92K –$93K range could complete the right shoulder before a potential breakout. If we see a clean bounce from that level, bulls might reclaim momentum.
⚠️ Invalidation:
A daily close above $106,000 would invalidate the structure and signal early continuation.
💬 What do you think of this setup? Drop your views and analysis in the comments below!

$SOL / $BTC Inverse Head and Shoulders BREAKOUT!!CRYPTOCAP:SOL / CRYPTOCAP:BTC Inverse Head and Shoulders reversal pattern confirmed 🥳
PA has also reclaimed the 50DMA
Bullish Divergence on RSI
So many signs indicators aligning across the market.
IS IT REALLY TIME !!?!?

$BTC Huge Daily Close Above the .618 Fib !Very BIG Daily Close for ₿itcoin above the .618 Fib 🥵
CRYPTOCAP:BTC needs to close the next week in or above the green box demand area in order to keep the rally alive and flip resistance into support.
As I originally mentioned in my idea, PA either needs to correct accordingly or this is the long-awaited PARABOLA in the making.
I still stand with my original belief on how this will play out, and have numbered my ideas accordingly.
1. Correct to 200DMA
2. Correct to 50DMA
3. Inverse Head and Shoulders reversal pattern
4. PARABOLA 🚀
I hope it's time to MOON more than anyone!
but I still have a good chunk of cash on the sideline in case the market needs more time 🤓

$QQQ Inverse H&S ready to GO!NASDAQ:QQQ
We’ve spotted an Inverse Head & Shoulders breakout on the 1-hour chart, and we’re currently in the retest phase.
- Measured Move (MM): $483.55
- Measured Timeframe (MT): May 1st @ 7 PM
Let’s see if we can maintain momentum tomorrow and steer clear of any unexpected news or market shocks tonight.
Not financial advice

$BTC Rejected at .618 Fib - Correction Coming!Textbook rejection at the .618 Fib for CRYPTOCAP:BTC
Now on its way to retest the 200 and 50DMA as expected.
If that does not hold, we’ll go back to my original inverse head & shoulder idea ~$78k.
This will be the catalyst for Bitcoin’s next leg up to $130k end of June.

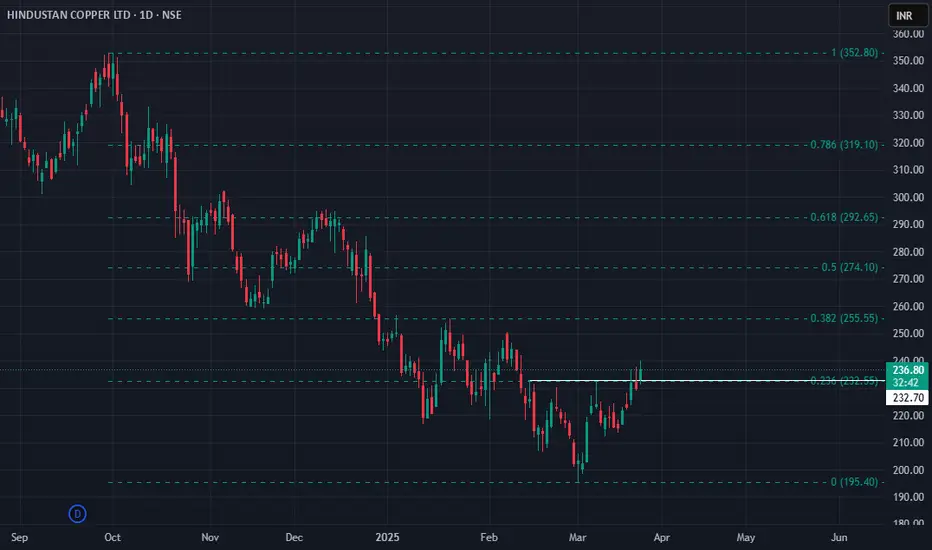
Hindustan Copper: Ready for Reversal? 🚀 Hindustan Copper: Ready for Reversal? 🚀
📉 Current Market Price (CMP): ₹237
🔒 Stop Loss: ₹210
📈 Targets: ₹256 | ₹285
📊 Why Hindustan Copper Looks Promising:
🔹 Technical Reversal Signal:
The stock has formed a small inverse head and shoulders pattern on the daily chart, indicating a potential reversal from current levels. This small base formation suggests upcoming bullish momentum.
🔹 Macro Tailwinds:
With the DXY (U.S. Dollar Index) decreasing and copper prices rising, there is additional support for an upward move in Hindustan Copper.
🔹 Swing Trading Opportunity:
With quarterly results on the horizon in April, this presents a timely swing trading setup to capture short-term gains.
💡 Strategy & Risk Management:
🔒 Stop Loss: Set a strict stop loss at ₹210 to protect capital against adverse movements.
📈 Staggered Entry: Given the recent market rally, it's wise to scale positions gradually while maintaining a balanced risk-to-reward ratio.
⚠️ Caution: While technicals are encouraging, the market has shown significant movement recently—adjust position sizes accordingly to manage risk effectively.
📍 Outlook:
With a confirmed inverse head and shoulders pattern and supportive macro factors, Hindustan Copper presents a compelling swing trade opportunity leading up to the April earnings season.
💬 Do you see this reversal playing out? Share your insights below!
📅 Follow for more technical insights and actionable market updates.
📈 #HindustanCopper #TechnicalAnalysis #SwingTrading #InvestmentOpportunities #MarketInsights #BreakoutStrategy
📉 Disclaimer: As a non-SEBI registered analyst, I encourage investors to conduct independent research or consult with financial professionals before making investment decisions.
Inverted Head & Shoulders Pattern for BTC??!!!??!Bitcoin appears to be trading in an inverted h&s pattern.
Which coincides with a bullish breach of a Bullish Expanding Triangle highlighted in red to the upside!!
A double bottom is where the head of the inverted triangle can be formed, the space between the two bottoms forms the apex of the head of triangle.
First upside target of $90k USD
Second upside target is $260k USD
