Silver in inverted head and shoulders.Silver - Intraday - We look to Buy a break of 19.67 (stop at 19.57)
A bullish reverse Head and Shoulders is forming.
Previous resistance located at 19.65. A break of bespoke resistance at 19.50, and the move higher is already underway.
There is scope for mild selling at the open but losses should be limited.
Our profit targets will be 19.94 and 20.20
Resistance: 19.65 / 20.00 / 20.20
Support: 19.20 / 19.00 / 18.60
Risk Disclaimer
The trade ideas beyond this page are for informational purposes only and do not constitute investment advice or a solicitation to trade. This information is provided by Signal Centre, a third-party unaffiliated with OANDA, and is intended for general circulation only. OANDA does not guarantee the accuracy of this information and assumes no responsibilities for the information provided by the third party. The information does not take into account the specific investment objectives, financial situation, or particular needs of any particular person. You should take into account your specific investment objectives, financial situation, and particular needs before making a commitment to trade, including seeking advice from an independent financial adviser regarding the suitability of the investment, under a separate engagement, as you deem fit.
You accept that you assume all risks in independently viewing the contents and selecting a chosen strategy.
Where the research is distributed in Singapore to a person who is not an Accredited Investor, Expert Investor or an Institutional Investor, Oanda Asia Pacific Pte Ltd (“OAP“) accepts legal responsibility for the contents of the report to such persons only to the extent required by law. Singapore customers should contact OAP at 6579 8289 for matters arising from, or in connection with, the information/research distributed.
Inverse Head and Shoulders

Wish you all the bestGL to all...
Do your research, trust nobody, look first then leap, and don't trust your "feelings" that much...

Inverse head and shoulders with breakout confirmation LUNCUSDInverse head and shoulders with breakout confirmation also known as break hook and go LUNCUSD. Just in time for the 1.2% burn tax


$XRP - Road To HELL or HEAVEN ?Hello my Fellow TraderZ,
Today we going to analyse the chart of the BEAST In-Survival - $XRP.
On DTF, we can see here #RIPPLE is forming an Inverted HEAD & SHOULDER Pattern. The break of the TrendLine is done and a Retest in progress.
Well, we have Two Scenarios here :
1. Price closes the Daily candle above the both EMA55 an Neckline of the Inverse H&S which will maintain the validation of this pattern
2. Price closes the Daily candle again below the Neckline and EMA 55 which would invalidate this pattern further. This is more likely as the Today's SELL volume is stronger than the previous Days' volume.
Keep an close eye on $XRP in both the scenario as this WEEK will be very volatile on either side for Global Maket.
Happy Trading . CHEERS !!!

Inverse Head and Shoulder As we can see There is an Formation of Inverse Head and shoulder pattern which is Reversal Pattern.
Just wait for Proper Breakout For long Entry.
Trade safely my friends and let me know your views in Comments.

XRPETH just hit the target of a micro inv h&s breakoutWe can see it has wicked slightly higher than the measured move breakout target. More importantly, in reaching the target of the mini inverse head and shoulders, it has taken price back above the neckline of a larger inverse head and shoulders pattern as well. I anticipate a retracement candle or few to retest the neckline of the larger inverse head and shoulders neckline as support if it can solidify that larger neckline as support we should see XRP continue to make considerable gains against ethereum in the coming weeks and possibly even months. Once we have confirmation that we are likely to validate the breakout of the larger inv h&s pattern I will post another chart that focuses on its measured move. *not financial advice*

XRP dominance is currently retesting the neckline of inv h&s.Currently one candle close above the neckline and the current candle is so far retesting that neckline as support. If this validates we should see xrp gain a considerable amount of market dominance back that it had lost over the last few years. May take a few candles to confirm..could also easily dip back below the neckline for a bit as well as is common on most inv h&s patterns after the first initial breach above the neckline. Also possible it could trigger in the next few candles *not financial advice*

OH MY $SPY !! Here is my full analysis - Lots to Review!$SPY has me on the edge of my chair here on the weekly and boy is there lots to review..
Let's start with where we left off last time..
The INVERSE HEAD & SHOULDER is still in play, I know, I sound like a broken record, but it's true, not broken, and we closed the daily on the $390 support level to back up this theory.
(Green Outline) represents a BROADENING DESCENDING WEDGE (Bullish) which has been respected since the beginning of the year in January. A bounce off $390 will send it upwards to a 3rd tap of the upper trendline and possibly break-through. A break through does not necessarily mean new ATH, OMG we broke through, "new all time highs" .. umm no sir .. this particular pattern could break-out and epically FAIL.. here is why..
(Purple Outline) is highlighting a RISING WEDGE (Overall Bearish) - should we hold the line here, at $390 on the weekly, this pattern will continue upwards to tap the upper trend for a 3rd time (generally followed by a heavy rejection - hence bearish), this compliments the INVERSE HEAD & SHOULDER mentioned above, but technically would end up failing as it nears the neckline aka top channel of the rising wedge.
But let's not lose sight so quickly, we still have to hold the line near $390 tomorrow in order for these patterns to play out without failure. I provided a chart earlier today from my phone of the current falling wedge on spy 15 min - 1 hour time frame so I am hopeful for a run up BUT if we break below -- there are many areas of support and plenty of gaps to fill and trades to be played.
GAPS are marked in RED.
Good luck traders!

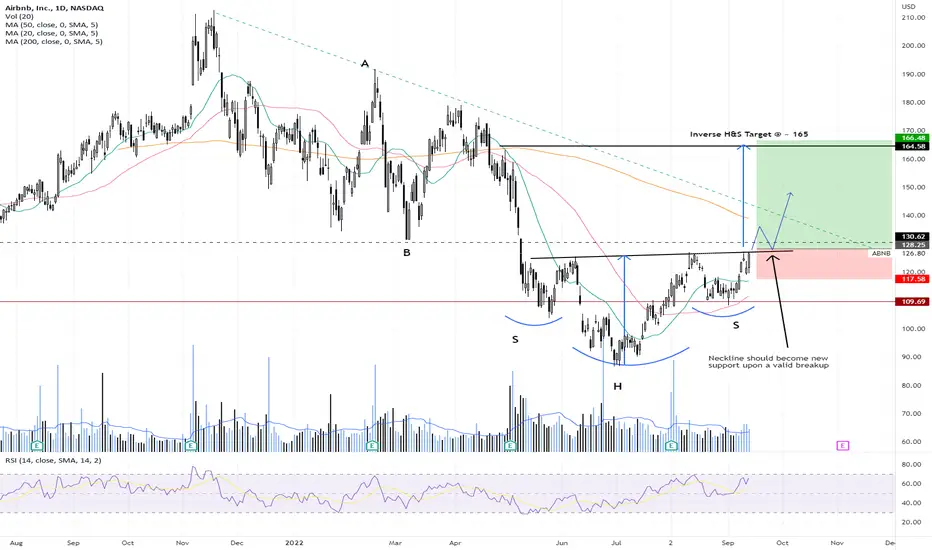
ABNB - Inverse Head & ShouldersABNB has completed the formation of an invert H&S bottom and looks to be on the verge of breaking up. Will it happen?
When it does breakup, it is normal for the stock to retrace after a few days to retest near the neckline (which ideally should then become the new support). If and when this happens, it will present a 2nd opportunity to stake.
Theoretical Target will be the distance between the lowest point (head) of the pattern to the neckline, and then projecting this same distance up from the neckline (ie around 165).
Let's see if this trade will work out!
Disclaimer: Just my 2 cents and not a trade advice. Kindly do your own due diligence and trade according to your own risk tolerance and don't forget that money management is important! Take care and Good Luck!
USDT.D inverted head and shoulders#USDT.D
The dominance of USDT is inside a descending channel, and below the upper line of this channel.
also as you can see it shaped an inverted head and shoulders.
🐮 the neckline of H&S pattern is the same with upper line of channel, so breaking out from this resistance can increase dominance toward resistance zone around 8.5%, that will cause more fall in crypto market.
🐻 rejection from upper line of channel can reverse the short-term trend and possible to drop to lower line, and as you know this move will cause reversal in crypto market and crypto will move upward.

$TSLA strong - Will it clear 305, 309?Look at the daily candle for 13Sep and you would have no idea that U.S. markets tanked on the same day. This is relative strength, and it shows in today's price action as well (see smaller timeframes).
There is a recent inverse H&S pattern, shown by the peach zigzag arrow. In order to move higher, buyers must move price over 304-305 (volume shelf) and then clear 309. That leaves a volume gap which should quickly see price reach 320.
RSI and stochastic, as shown in yellow circles, indicate strength and room for price to move higher. Note that %K (gray line) may zigzag but %D is still rising and if it crosses over 80 then TSLA should see the late buyers come in.
* RSI LESSON (14-day) - On 4 Aug RSI moved over 70, which indicates bullishness. When RSI turned down with price, it stopped just over 40 (green bar) and turned back up. 35-40 is a bull support zone. RSI showed buying strength when it held 40 and moved back over 50 without retesting this level as price kept rising.
*** Note: TSLA crossed 304 and drew in sellers at 306 while I was writing this. Watch for a pullback to 302 on smaller timeframe if you want to buy calls and check indicators for a good trade setup. It may drop lower if market retreats in the afternoon. (based on 30m chart)

$SOND extremely bullish setup. PT's are labelled based on chart patterns.
- MMU (measured move up/ ABC)
- Bull flag breakout imminent and the PT breaks the neckline of the inverse head and shoulders.
- A break of the neckline of the inverse H&S gives us the PT based on Thomas Bulkowski's statistical work.
It is also important to note that the MACD crossed to the upside on the daily and the RSI is still not oversold. No bearish divergences in the momentum indicators. THIS IS EXTREMELY BULLISH.

Shiba Inu - Fake breakout! 60% crash soon | Elliott Wave
We are in the middle of the crypto bear market. Altcoins like SHIB, ADA, XRP, SOL, DOT, and LINK are going to crash hard. You really don't want to buy these coins at this moment.
I think Shiba doesn't deserve to be ranked at #13 on Coinmarketcap with this terrible price action. Yes, we had a massive pump that lasted only 30 days in 2021, but now we've been bleeding for 320 days.
On the daily chart, we have a descending parallel channel on the LOG scale with a fake breakout. It was a trap, and there were clearly missing buyers on this token. The token is still so expensive that buyers are not interested.
The price should go down to the previous swing low at 0.00000510, which is an extremely strong support and potential buying opportunity.
I would like to see a bullish divergence on the weekly timeframe, and this divergence will definitely be created if we drop down to 0.00000510.
From the Elliott Wave perspective, we need another impulse to the downside to complete a major impulsive wave, so I think we have already started the downtrend.
Maybe Shiba is a great altcoin, but it is very overpriced and expensive. Definitely not a good investment at this time.
For more analysis, hit "Like" and "Follow"!

NEAR inverted head and shoulders#NEAR/USDT
$NEAR shaped an inverted head and shoulders pattern.
🐮 if price hold the previous low at $4.088, the right shoulder is completed and price can head up to break out the neck line and rise as high as head.
🐻🐮 I think price can have another leg down to make the low of right shoulder around $3.9 which is around parallel trend line of neckline, then increase to complete the H&S pattern.

Quant testing the top trendline of the 1day symmetrical triangleWe can see that priceaction is currently attempting to both test the top trendline of the symmetrical triangle (in chartreuse) as well as trying to climb back above the 1 day 50ma(in orange). If price action can flip the 1 day 50ma back to solidified support then it can validate the bullish breakout from this symmetrical triangle. The breakout target from that symmetrical triangle will take price action far above this white line which is actually the neckline of an even bigger inverse head and shoulders pattern. If we are to hit 100% of the breakout target for the triangle ($165), this will greatly increase the probability of it also triggering the breakout of the inverse head and shoulders pattern as well which can send it considerably higher afterwards($224). Of course for now the 1 day 50ma is still resistance so we want to see a couple daily candle closes above that and any confirmation candles after that that retest it, testing it as strong support. Flipping tat 1day 50ma back to strong support will also confirm that the golden cross that recently happened will be sustained instead of flipping back into a deathcross and confirming a golden cross fake out. *not financial advice*

GBPUSD LongOANDA:GBPUSD
GBPUSD failed to create a new lower low, forming a reverse head and shoulder pattern.
Should price break above previous lower high, it will give us a bullish setup.

Ethbtc currently above inv h&s neckline.No confirmation yet but it’s looking quite bullish *not financial advice*

AMD Ppotential inverse head and shoulder Potential inverse head and shoulder
MA 50D Support at bottom

$SPY $SPX 5 Reasons to be Bullish vs 5 Reasons to be BearishBULL
1. SPY had an incredible bounce yesterday printing a bullish hammer at the $390 level which is a huge area of support. Inverse Head & Shoulder is still in play.
2. The RSI has created a bullish divergence (might be temporary - see bearish view).
3. MACD has started curling up after the big corrective decline.
4. Stoch RSI is and has been negative (oversold) for days.
5. The chance of 75bps (interest rate hike) announced at the next meeting is already mostly priced in as the FED gave a hawkish speech at Jackson Hole.
BEAR
1. RSI has not reached oversold territory on the daily (a double bottom could resolve that).
2. The weekly RSI was over-bought and has already began making its way down.
3. POWELL is actively trying to bring the markets lower.
4. Many gaps to the downside.
5. 50MA/100MA are squeezing on the daily - indicating volatility incoming, which also could be a bullish move.
Overall - bullish until proven support is broken.

Litecoin LTC - A new bull market started! | Elliott Wave
Great news for all Litecoin hodlers and traders! As per my technical analysis, this downtrend established in 2018 has finally finished!
This is the LTCBTC pair on the weekly timeframe. It means that it would be better to hold LTC instead of BTC. But there is no guarantee of the USDT value of your holdings.
Regarding my Elliott Wave analysis, a major impulse wave has been completed, and now I expect at least a retracement to the upside.
Also, we can spot very nice local inverse head and shoulders and falling wedge patterns that are very close to a breakout!
The falling wedge has been destroyed by the bulls successfully, and now we are waiting for the head and shoulders pattern.
The last weekly candle of the downtrend is an extremely strong bullish engulfing candle, which is absolutely great to see!
The BTC.D Dominance chart confirms this analysis (I will post the BTC.D technical analysis probably next week).
For more analysis, please hit "Like" and "Follow"!

IVZ - Right ShoulderInverted H&S pattern
The right shoulder arm is yet to form, this is when we can expect bullish results on this Weekly timeframe
It may even escape this huge horizontal range shown with the horizontal line
Very bullish pattern

SPY inverse h&s within greater patternSpecifically looking at yellow here, although purple, larger pattern in the making may play out as well with a large rally into the end of the year.
With media barking about how September is such a poor month for stocks + a lot now baked in post-Jackson hole meeting, I could see a large rally begin soon into SPY 420ish (5.82% move roughly). Potential of a higher move if it were to bust out of supply levels.
Looking for an easing up of selling pressure at these levels in the short term. Note the VIX in recent days has been net flat/red with a declining market.
