Inverse Head and Shoulders

Nifty Making Inverted Head & ShoulderNifty making Inverted Head and Shoulder on Daily and hourly , closing above 17500 on daily will make the target to 19400 in comings weeks :)
Waiting for New life high soon.

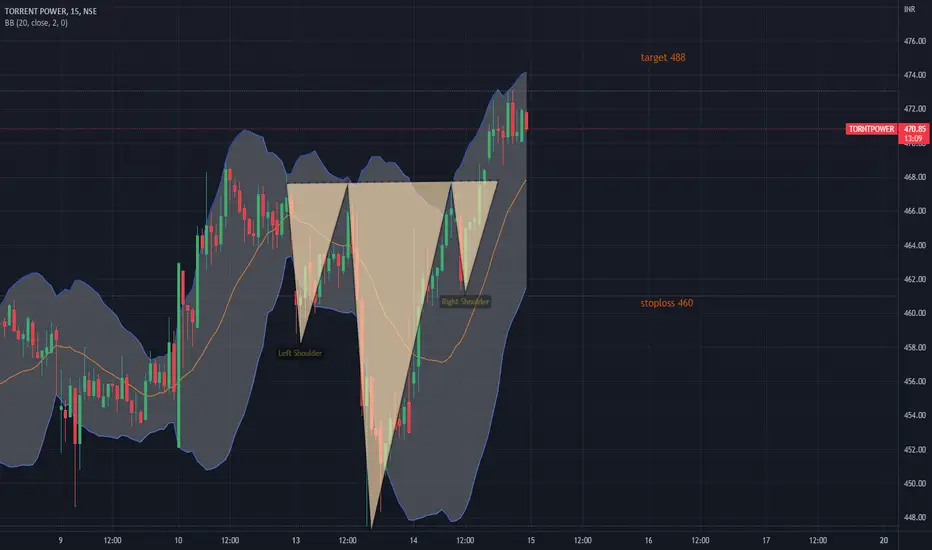
Torrent PowerTorrent Power made inverted head & shoulder on smaller time frames with good volumes.
Could be bought with mentioned stoploss & targets.
BTC - 4h - iHS idea23.04.2022 - 07:46
As long there is now LL, i think we see iHS.
When we see a LL, i think RED down line is next target.
When you want to long, this area is a good Option, but with SL or small Position to rebuy later low

TSLA IHSSeems like an inverted head and shoulders is forming on TSLA (1hr)
The left shoulder and pivot price being $680.20
A failure of that support to hold, we might retest lows at 615 (strong support, head) and 600 (psychological level)
If market bounces and we can form a right shoulder at $680 (rejection and support) we could push higher towards 785 (base)
I will be watching price tomorrow and next few sessions. I have no bias.

ALGO inverted head and shoulders#ALGO/USDT
$ALGO shaped inverted head and shoulders pattern and now try to break out from neck line.
🐮 breaking out from neck line will increase price to touch resistance zone between $0.47 and $0.49.

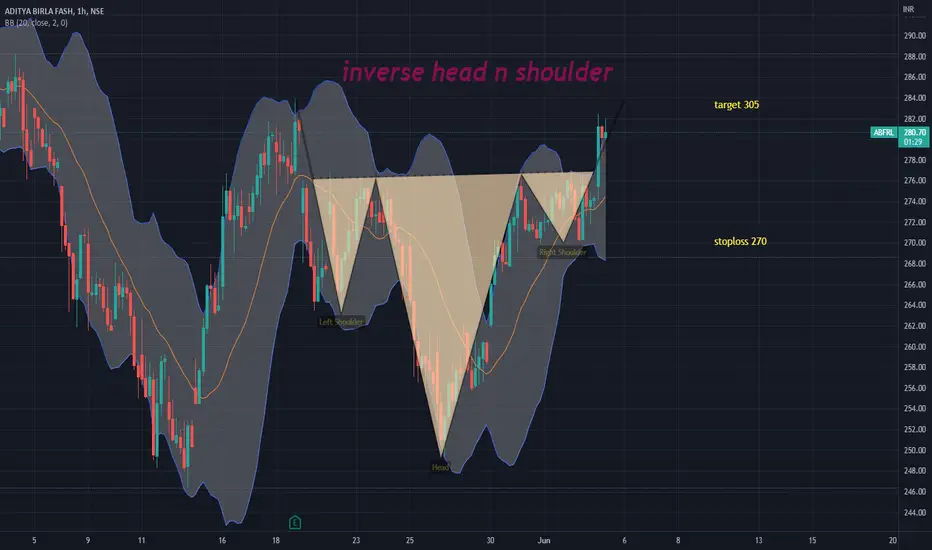
abfrlabfrl made inverse head n shoulder on an hourly charts with decent volumes.
could be bought with mentioned stoploss & targets.
$TRX > $BTC (MEGA BULL)Free bitcoins. Tell your friends. Not financial advice. #TheCryptocracy @dropaganda

XPRT Persistence Token Showing Inverse H&S Pattern FT 1.97Persistence Token XPRT is showing an inverse head and shoulders pattern on the 4hr. right now. With Bitcoin dominance BTC.D almost precisely tagging resistance at 47%, I believe the alts now have a small opening in the clouds to rise. That being said wait for this candle to close in 3+ hours on your 4hr chart for entry confirmation.
Entry = Price upon candle close on the 4hr.
Stop = Somewhere below neckline. I chose 1.53
Target = 1.97 but taking profits along the way.
Risk/Reward = 3.33
Best to you!
Stew
Here's the BTC.D chart showing resistance:


Long BTCUSDTlot of people had lost money buying YFII and investing in scam coins and wanted to recover their losses,
Whales had been defending this 29k-30k level multiple times.
Everytime, it drops below 29k, it will rebounce back, this shows a sign of strength where whales are accumulating.
This might be your last chance to buy bitcoin at the dip.
BTC had made a bullish flag pattern and it fake out of the range.
It made an inverse head, and closed back into the range.
This is a bullish formation whereby btc made a fake up before going up.
Now , btc is doing a small weird correction before going up to 38k
This is very bullish .
This should be the macro bottom.
Hence, btc should moon from here and target 38k .
This is not a signal and do not follow but a trade idea.
Disclaimer - This analysis alone DOES NOT warrant a buy or sell trade immediately. Before you enter any trade in the financial market, it is very important that you have a proper trading plan and risk management approach

Lucid breakout?I'm liking the look of this inverse Head & Shoulders forming, as well as approaching the down trend resistance we've been in since November. RSI broke this downtrend a while ago and recently re-tested, so I'd expect to see similar happen on the chart.
We're also in a descneding broadening wedge, recently bouncing off the bottom and looking to head towards resistance.
Waiting for confirmation will be the best trade, breaking $20 then getting a successful re-test of the neckline and trendline. My take profit target will be $25 to secure profits of about 25%, although it may overshoot to previous resistance of up to nearly $30.

GBPUSD Bearish Divergence4H Inverse Head & Shoulder
4H Bearish Divergence
1H Bearish engulfing is about to close 10 pm est. (Start of drop/pullback)
Expecting drop to 4h 50 EMA where previous support was or possibly a lil further.
Expecting one of the 2 levels to hold as support before continuing inverse head and shoulder pattern to upside.

Wirex (WXT) is in uptrendHello Friends,
Currently, most of the cryptocurrencies are in a downtrend but WXT is in uptrend. It also looks like Wirex is forming an inverse head and shoulder pattern. We can get some decent profit if WXT continuous uptrend. Don't forget to manage your risk as the crypto market is highly volatile in nature.
Wirex (WXT) is a unique multi-blockchain cryptocurrency that powers the X-tras rewards program. Wirex customers can earn up to 4% back in WXT every time they use their Wirex cards in-store or online, or up to 12% annually on the balance of their WXT accounts with the Savings Bonus feature.
Do share your opinion in the comment section.

GBPUSD INVERTED HEAD & SHOULDERSGBPUSD has formed an inverted head n shoulder pattern indicating a bullish retracement is happening.
The Retracement target is the broken support turned resistance.

SPY possible Inverted H&S ?Here is a look at the possible Inverted Head and Shoulder formation on SPY (1hr)
One thing to keep in mind, SPY is clearly in a downtrend, and there is no point in trying to time the bottom, the smartest thing to do is play what you see, take profits, reset and do it again.
On this 1 HR chart, there is a possible inverted H&S in the making.
Left shoulder being at 394.75 level (approximate) Head being the low at 385 and now SPY could attempt to put in the right should (394.75)
SPY has a very strong resistance at 404 / 406 level, which would be the neckline . Below that level, We are still in a bear trend. Above, we could have bottomed.
I want to see if we are going to pullback towards 394.75 to form the right shoulder and see where it goes from there.

U.S Dollar index U.S Dollar index , is very bullish today because it has formulated inverted head and shoulder and the target is 103.700 with a stop loss of %3 of your account.

Dow Jones dji index Dow Jones dji index , expected to be bullish and going long would ideal for today with a target of 33000 and stop loss of %3 of your account.

Mini Double Top Formation, what next?Hey Traders!
The inverse head and shoulders are weak, the MACD is also forming signs of a potential retest towards 27k.
Safe trading,
-Pulkanator

BTC is anyone seeing this?Hello Birdies.
I think BTC is forming a inverse H&S. It has a 72% success rate. If this happens it will put BTC right at the red line which we are looking to short as another big dump.
You can look into our previous charts and you will see that purple price tag there as well..

BTC inverse head and shoulders#BTC/USDT
$BTC broke out from neckline of inverse head and shoulders pattern.
and confirmed it as support.
so holding the neckline as support can increase price to resistance zone between $33k and $34500.

INVERTEDE HEAND & SHOULDER PATTERN 🎉A clear picture of APEcoin doing an inverted head and shoulder pattern on H4 TF, it depends on bitcoin bias and outplay.

BTC Inverse Head and Shoulder (UPDATED)As you can see, the market is following the predicted movement. The only problem we're facing is because of Terra a.k.a. $LUNA.
Apparently, Luna Foundation has transferred 80,394 $BTC from their reserves to Binance and Gemini. Let's see what their next movement is headed to.
If you like my idea then please like, share, and comment below.
