BTC ScalpAccording to my view,Technicaly can be seen a inverse head and shoulder pattern in 15 min time frame, If BTC trying to test neckline I ll open my long position arround $ 29,500 - 29,750.
TP1 - $ 32000
TP2 - $ 33000
SL - $ 28750
#DYOR#
#IamNotaFinancialAdvisor#
Thank You
Inverse Head and Shoulders

GBPAUDGBPAUD took support from Daily EMA12 and it's forming inverse head & shoulder on the lower timeframe. Watch out for the breakout for the targets marked on the charts.

TSLAGonna post this one once again right here.. inverse H/S setting up .. gonna create lots of TSLA fanboys to come out of no where lol and hope for 1200 test.
Close under 696 on the week and this may not play out.

Right on the DOT/USDTDOT/USDT
🟢entry: $18.060- $17.295
❌stoploss: $17.730
🎯tp1: $28.420- $27.360
🔼potential %profit: +56.57%
🔽potential %loss: -10.66%
r/r: 5.31
Hi Everyone,
🥀this trade idea is fairly self-explanatory. i see an inverse head-and-shoulder pattern developing. in addition to the chart pattern, there is significant volume and the left shoulder, the head, and (to a lesser extent) the right shoulder. this price/volume combination strengthens my confidence in the pattern.
🥀i am setting up the entry in a fairly tight range at the right shoulder, between $18.060 and $17.295.
🥀stop-loss is placed at an appropriate distance below entry, although there is not much in the way of price structure to give further guidance in placement.
🥀target exit is at the last point before price dropped off with volume and began to form the left shoulder of the pattern.
check back for updates as the position progresses.
feedback and constructive criticism is always appreciated.
✌️all good luck and always practice strict risk management!

#Hex vs #Doge. #Memes, #Metaverse plays & #NFT's are doomed. Inverse Head and Shoulders: The two targets represent a Unlogged & Logged projection from the Head to the neckline. Giving two vastly different results. To meet the 100:1 doge:hex ratio could signal which seems outrageous. But during a prolonged bear market. we can definitely witness a Doge at a Penny. And the premier store house of value reach a Dollar in the next 12-18 months.

INDUSINDIndusind made inverse head & shoulder pattern on an hourly charts with good volumes.
\
Could be bought with mentioned stoploss & targets.

Bitcoin - Small bull trade ideaKeep it plain, simple and minimize the noise!
We nailed our last few trades! :)
Sorry for the phone upload, but here we have an inverse head and shoulder retesting the neckline with a bull flag (continuation pattern).
If we get our confirmations, my target is around 33k.
Also not surprised if we just nuke straight through this, as the market is clearly bearish.
At the moment - the market is sideways, choppy and RISKY.
I have various different set-ups I'm watching and always waiting for confirmations of each one BEFORE entering a trade.
Comment your ideas down below :)

MACYS Inverse H&S WeeklyAn inverse H&S formation on the Weekly chart on Macys
The price will form a right shoulder and climb out of 1.618
This is bullish for price once completed

XAUUSD BuysThis is just a simple chart pattern that shows you the head and shoulder pattern inversed. Safe trade to secure a few pips. The target will be 1917 for XAUUSD.
OANDA:XAUUSD

DOGE/USD Inverted Head and Shoulders at PCZ of Bullish ButterflyWe are at a PCZ of a Bullish Butterfly printing a Potential Right Shoulder of an Inverted Head and Shoulders Pattern Visible on the Weekly with a bit of Bullish Divergence to top it off.
My Stop loss will be below 10 cents and my TP will be above 30 cents.

Nifty 50 potential positional long trade
Potential inverse head & shoulders pattern developing on Nifty 50. The trade can be initiated upon the break of the neckline with a target of All Time Highs.

Short-term technical upward move likelyThis is a short-term trade. On the technical side, we've got the following things that make a bullish move more likely:
According to seasonality, in the last 15 years, only in one year went the price down within the timespan from the 7th of May until the 23rd of June. So, it's a bullish time for this stock according to seasonality.
The prior inverse H/S pattern got broken; the price went up, came down, and tested precisely the neckline yesterday.
A clear hammer candle formed yesterday.

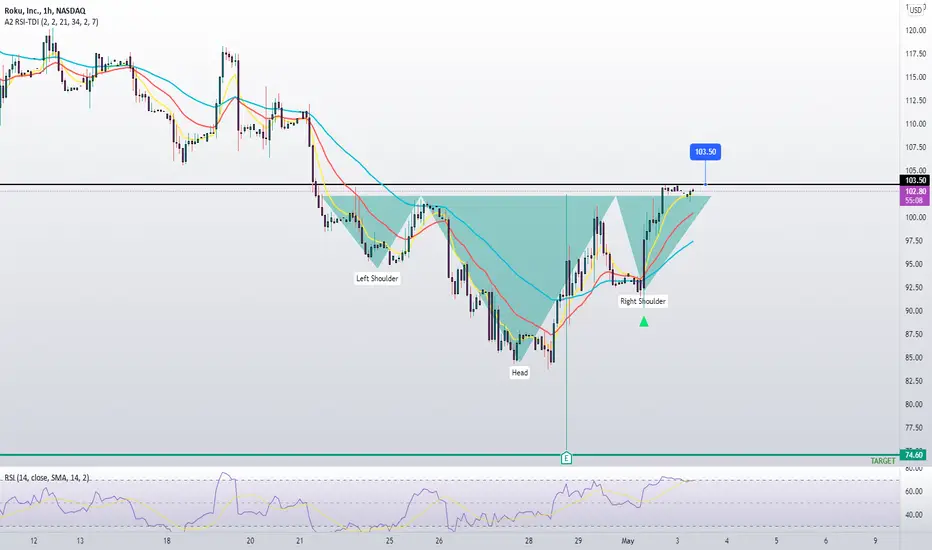
ROKU Inverted H&SClassic inverted H&S on ROKU,
Waiting for a break of the neckline for a confirmation.
FOMC tomorrow, so market might be choppy, be careful!
EOS inverse H&S and bearish flag#EOS/USDT
$EOS 15 min
🐮 inverse head and shoulders can increase price to upper line of parallel channel.
break out from parallel channel can increase price to 0.5 fib level of daily swing down around $2.3
🐻 rejection from upper line or middle of channel can shape bearish flan and drop price to $1.78

GBPUSD 4-Hour Inverted Head & ShouldersHi Traders,
Happy Monday!
Hope you all had a great weekend.
Today we are looking at a possible Inverted Head & Shoulders on the 4-Hour Chart
We have seen nothing but bearish price action for the past month on most FX pairs.
The DXY has been going parabolic
GBP/USD has wicked down to a support level not seen since July 2020.
Is this a good time to buy?
I only enter positions that match my setup, which could be a possible play.
Yes, it is a counter-trend which is not always advisable.
This is why I would only risk a very small position on this as I wouldn’t class this as an A grade Setup.
I am waiting for the price to break and close above that 4 Hour Resistance. If it does this I will be waiting for a possible retrace before potentially taking this pair long with a RR of 1/4
Hope you all have a great week!
See you on the next one,
The Vortex Trader

🐂EUR/JPY LONGEUR/JPY has shown bullish signs on higher timeframes as price broke major previous highs.
The market as pulled back, retested previous lows, pushed up breaking previous highs and has started to form what looks like an inverse head & shoulders.
With the EUR value rising and JPY still in blood bath, it only makes sense to take this continuation.
Profit target are marked in red.
OANDA:EURJPY

Locked and Loaded FET/BTC #FET $FET #FETBTCThere appears to be an Inverted Head and Shoulders on our FET BTC chart ! That's good . That's a bullish structure . You can see the structure has been building since we bottomed out near 640 sats not that long ago . It shouldn't be long now until we complete the right shoulder which we are already halfway through . And then this should go up ! First target area would probably be near the top of the Ichimoku cloud around 12xx sats or so. Where the green arrow is .
After that we have to consolidate on top of the cloud and will need to break through our previous resistance of 1550 but then we should definitely see more upside ! FET looks great for this year ! A gem .
PS - you can see we've clearly closed above that previous Falling Wedge we were in so that's also Bullish .

DAR completed inverse H&S#DAR/USDT
$DAR pumped and increase more than 240% from our entry ✅
now price completed invers head and shoulders pattern.
🐮 if bulls can't break out from current resistance zone, probably price pullback to support zone then continue its ally to resistance zone between $0.5 and 0.618 fib levels of whole swing down.
🐻 break down from support zone can drop price to ascending support line.

Telsa InverseHead&ShouldersSupport at to of red band. Inverse Head & Shoulders formation.
Disclaimer: Stratford Research newsletters reflect the research and opinions of only the authors who are associated persons of Stratford Consulting Ltd. The newsletters are for informational purposes only and are not a recommendation of an investment strategy or recommendation to buy or sell any security or digital asset (cryptocurrency, etc.) in any account. The information provided within the newsletters is not intended to serve as the basis for any investment decision. Any third-party information provided therein does not reflect the views of Stratford Consulting Ltd. or any of its subsidiaries or affiliates. All investments involve risk including the loss of principal and past performance does not guarantee future results.

DJI possible inverse Head and ShouldersWe could be seeing a possible inverse head and shoulders on short term here especially with DXY possibly topping out soon.

HOT ready to fly#HOT/USDT
$HOT broke out from long term descending resistance and dropped to ascending support.
🐮 holding this support can increase price to resistance between $0.0054 and $0.0062.
if price continue its rally to break out from resistance of $0.0076 it can reach $0.01 to complete the inverted head and shoulders.
🐻 break down from ascending support will drop price to $0.004 and even $0.003.

ENS inverted H&S#ENS/USDT
$ENS shaped an inverted head and shoulders pattern.
🐮 price can increase more to touch the descending resistance that is the neck line of inverted H&S then head up to resistance zone between $26 and $28 to complete this pattern.
🐻 break down from ascending support will invalid this scenario.

EURNZD are you gonna print us $$$🤑🤑 ????EURNZD broke a resistance area of 1.61000 and already came back for a retest of the broken structure.
Price is currently heading upward and forming an INVERSE HEAD AND SHOULDERS (BULLISH PATTERN), We are patiently waiting for the price to break and retest the current neckline for a BUY
WATCH OUT
1. Break and retest of the neckline
2. Bullish candlestick confirmation after break and retest of neckline for a continuation
3. Wait patiently
Kindly like, comment and follow for more setups
REPOST AND SHARE 💙💙💙💙
