Inverted Head and Shoulders at Bullish BatWe have a Potential Right Shoulder at the PCZ of a Bullish Bat with Hidden Bullish Divergence that could take the SPX up to the 1.13 Fib Extension if it plays out.
Inverse Head and Shoulders

USDT DOMINACE BREAKOUT! BTC IS IN DANGER!!Hello everyone, if you like the idea, do not forget to support with a like and follow.
Welcome to this USDT DOMINANCE update. USDT Dominance does not look good here.
USDT.D breakout from the inverse head&shoulder pattern in an 8hr time frame which is a bullish pattern. And you know when USDT Dominanc pumps all the crypto market BTC and Alts starts dumping. This is not a good sign for a cryptocurrency market.
Although still, we have two resistance levels 4.90 and 5.22 from there we can expect a reversal. If USDT.D breaks the 5.22 level then it's really really bad for BTC. Stay cautious with your trades and keep your stop losses tight until we get any bullish confirmation.
What do you think about this?
Share your views in the comment section.
If you like this idea then do support it with like and follow.
Thank You!

ALGOUSDT iH&SSupport on ALGO touched. Easy to put a stop loss with massive potential gains.
SL should be around 0.67$
Inverted Head & shoulders on daily.
Hidden bull divergence on MACD histogram and RSI on daily.
4H showing a partial decline with 3 rising valleys with hidden bull on MACD.
1.54$ is the first level second should be 1.83$ 50% fib level.

DOT bearish flag of inverse H&S?#DOT/USDT
$DOT is below middle line of parallel channel.
🐻 if price hold the resistance of middle line of parallel channel and break down from lower line, this move can act as bearish flag and price will drop to support zone around $16.
🐮 if price break out from middle line we can see an inverted head and shoulders patten and price can head up toward resistance zone around $22.

Massive Inverse Head and Shoulders on SPY!!!!!!!! Super Bullish Looking at this massive inverse head and shoulders on spy, Using a fib ext we could see the breakout from the right shoulder up to 465 with the next Pocket up around 510!!! this all aligns perfectly with witching in June, All indictors say its a go, Stoch and MACD are also ready for an up move

SunPharmaSunpharma made an inverted head n shoulder pattern on an hourly chart with good volumes.
Could be bought with mentioned stoploss & targets.

FTM reverse head and shoulders#FTM/USDT
$FTM shaped an inverse head and shoulders pattern in daily time frame and we can see its fractal in right shoulder is another inverted head and shoulders in 4h time frame.
🐮 holding the support zone will increase price to neck line and then resistance zone around $1.4 to complete the 4h H&S.
🐮🐮 neck line of daily H&S is at target of 4h one so break out from this resistance will head up price to resistance zone between $2 and $2.3 to complete daily H&S.
🐻 break down from support zone will invalid this scenario.

S&P500 Future OutlookIf this week closes above $4500 for the SP500 it would be a bullish engulfing week.
So far, for the past few weeks we've been going sideways between $4400 and $4550 on a weekly closing basis as the volume declines. The volume declining as the price consolidates indicates a bullish outlook. If the bulls maintain the price above $4450 it would put in a Higher Low from mid March which would indicate a continuation of the up trend since we placed a Higher High earlier.
In the short term, I'd like to see a retest of $4450 as that would serve as a confluence of support with the trend line extending from the late December 2020 lows. A bounce from $4450 would be extremely bullish as it would indicate that bulls are ready to move out of this range (between $4400 and $4550).
Needless to say, a further rally from here would work towards the Inverse Head & Shoulders that everyone's been talking about ;)

#KSM Inverse HSH#Kusama ready to make another +100%
In daily timeframe we seen a massive Inverse Head and Shoulder
Wait for confirmation price to close above the neckline
Send it to $410

GLMR inverse H&S#GLMR/USDT
$GLMR broke out from neck line of inverse head and shoulders pattern.
🐮 price can increase as high as head to reach $5

Mindacorp on verge of breakoutMindacorp is trying to give a breakout from inverted head and shoulders pattern.
Good trade if closes above 210 today. Safe above 215.

NAS100Monthly has large wicks rejecting 14000 price area. 2 months back-to-back. Monthly Bullish Engulfing as well.
Weekly candle stick analysis could be a double bottom forming or a higher low. Due to Daily analysis expecting this to be a weekly higher low.
Daily has created an inverse head & shoulder pattern with bullish divergence.
If price rejects this zone and breaks structure for turnaround of buys. Expecting price to continue pattern to upside near 15600 long term.

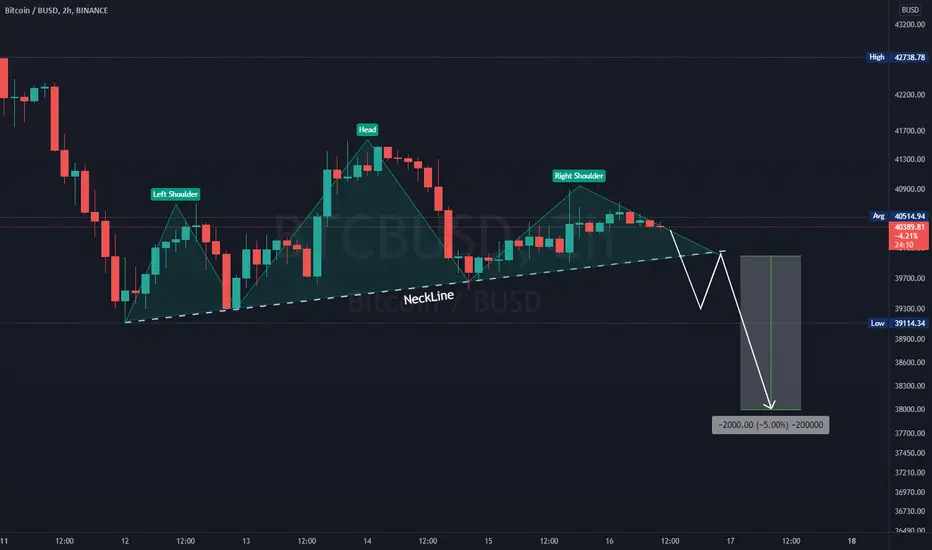
#BTC More dip ? In 2H Timeframe, we seen a inverse head and shoulder.
If bulls can't reach above Head ($41,600) we might see another dump below the neckline
If 1H candle close below the neckline its time to short it until $38,000
Inverted Head and Shoulders at PCZ of Bullish SharkLike many other alt coins we have an IHNS at the PCZ of a Bullish Harmonic here if we could get some follow-through it could be great.

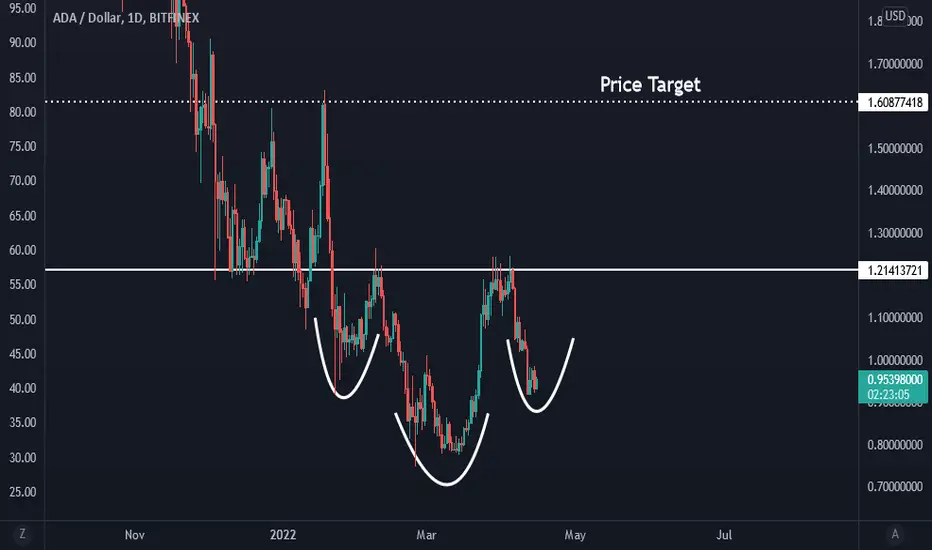
ADA Inverse Head and ShouldersAda potentially gearing up for a big move with this inverse head and shoulders set up. These aren't the strongest performing patterns, so be patient when trading. It is also hard to be bullish while ADA is under 1.00, but this could change everything if it plays out. The price target of this pattern is the 1.60 range, a 75% pump. We are also testing key levels of long term horizontal support, if these lines don't hold things could get ugly. Moving to the long term VPVR, the point of control is around 1.30, which could be a good range to take profits. Being below almost all of the volume from the past year is also alarming, another reason to be cautious here. The daily EMA ribbon also flipped bullish for the first time since September 2021, but is currently struggling to stay that way. All of this convergence is pointing to an explosive move soon, lets just hope its in our favor.
Bulkowski on Head and Shoulders Bottoms: thepatternsite.com
GBPCAD | New perspectiveDespite the obvious that we are in a long-term downtrend situation on this pair; the appearance of a structure that looks more like an inverse head and shoulder pattern on the 4H time frame is suggesting we are on a verge of a reversal as we anticipate a breakout/retest of structure to hop in a potential bullish momentum.
Risk Disclaimer:
Margin trading in the foreign exchange market (including commodity trading, CFDs, stocks etc.) has a high risk and is not suitable for all investors. The content of this speculation (including all data) is organized and published by me for the sole purpose of education and assistance in making independent investment decisions. All information herein is for your reference only and I take no responsibility.
You are hereby advised to carefully consider your investment experience, financial situation, investment objective, risk tolerance level, and consult your independent financial adviser as to the suitability of your situation prior to making any investment.
I do not guarantee its accuracy and is not liable for any loss or damage which may result directly or indirectly from such content or the receipt of any instruction or notification therewith.
Past performance is not necessarily indicative of future results.

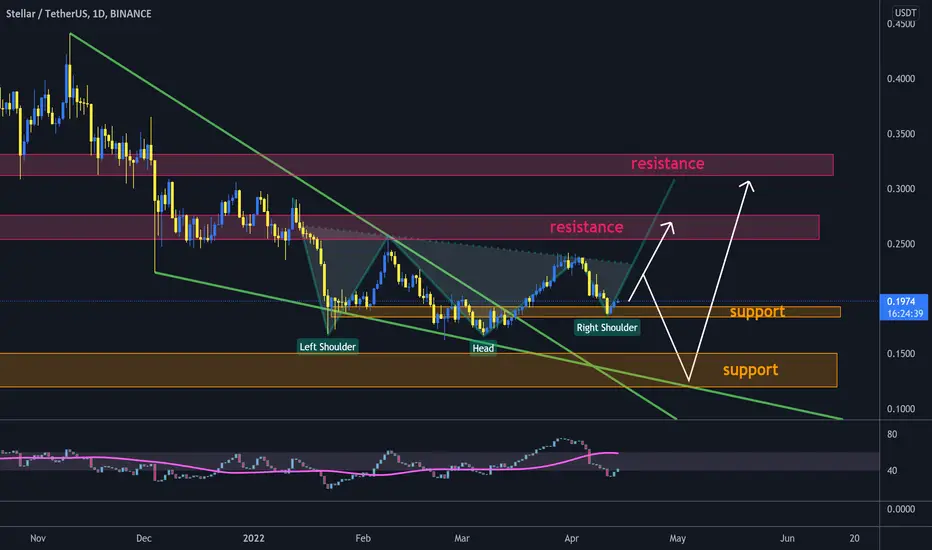
XLM broke out falling wedge and can shape inverse H&S#XLM/USDT
$XLM broke out from falling wedge, and hold the support zone.
🐮 holding the support can increase price to $0.23 that is around neck line of inverted head and shoulders pattern.
break out from neck line will increase price to resistance zone around $0.27 and $0.32.
🐻 rejection from neck line will drop price to break down current support and reach support zone between $0.15 and $0.12, that will be a pullback to broken falling wedge.
GBPCAD - Rare W1 Setup With H4 ReversalW1 - bottom of the range
H4 - bullish convergence
H4 - inverse head and shoulders

Nasdaq AnalysisOn the Nasdaq chart, we can see a possible inverse head and shoulders forming on the daily timeframe to continue a bull run. Once price reaches the blue zone, look for bullish price action confluences.
The red line indicates the scenario if the inverse Head and shoulders fails

ADA 1D Bullish / inverse head and shouldersDid you notice the inverse head and shoulders?
How do you feel about it?

YFIIUSD: Inverted Head and Shoulders at the PCZ of a Bullish BatThere is an Inverted Head and Shoulders Pattern with Triple RSI Bullish Divergence at the PCZ of a Bullish Bat.
You likely don't want to see price trading below $1,480 and your first area for taking profit will probably be around $4,165

LINAUSD: Inverted Head and ShouldersLike many other alt coins Linear Token is printing a potential Right Shoulder to a Potential Inverted Head and Shoulders Pattern for us on the Daily and if it plays out the next major resistance will be very far out and should lead to some crazy Bullish action

DEGO inverted head and shoulders#DEGO/USDT
$DEGO pumped and now struggle to break out from descending resistance that is the same with resistance zone.
also price shaped an inverted head and shoulders pattern in daily time frame that its neck line is near to break.
🐮 break out the neck line of H&S can increase price to touch resistance zone between $6 and $7.
keep eye on it 👀
