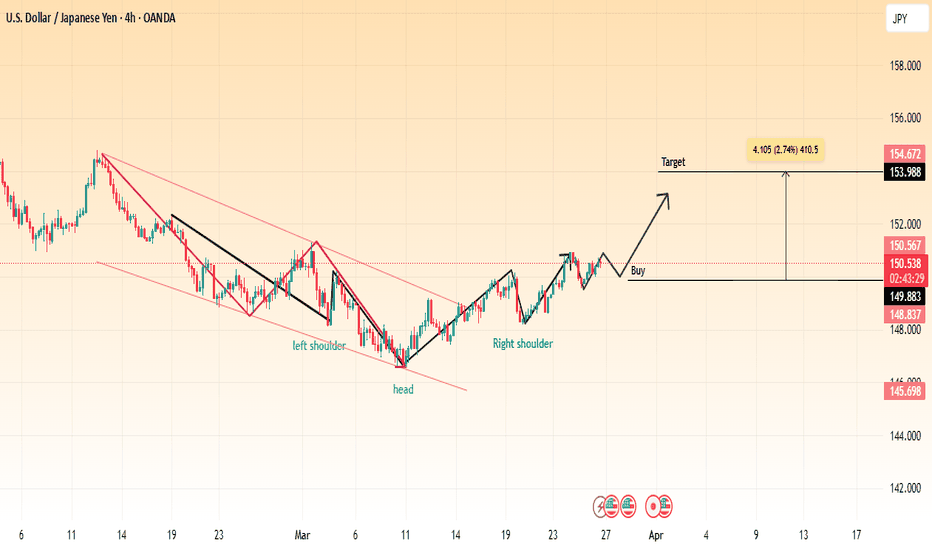
USD/JPY Bullish Reversal (Inverse Head & Shoulders)📌 Pattern: Inverse Head & Shoulders
📌 Analysis: The chart showcases an inverse head and shoulders pattern, a classic bullish reversal formation. The price has successfully broken out of the downward trendline, indicating potential upside movement.
🔹 Left Shoulder: Formed during the previous retracement.
🔹 Head: The lowest point of the pattern, marking strong support.
🔹 Right Shoulder: Completed with a breakout above resistance.
📈 Trading Plan:
✅ Entry (Buy): After a confirmed breakout and possible retest.
🎯 Target: 153.988 - 154.672 (2.74% potential gain).
🔻 Support: 149.883 - 148.837 (Stops should be placed accordingly).
📊 Conclusion:
If the price maintains above the breakout level, we may see a strong rally toward the resistance target. Watch for volume confirmation and pullback retests before entering a trade.
Inverseheadandshouldersidea
Inverse Head and Shoulders the accurate chart patternInverse Head & Shoulder Pattern Tutorial -
Invesre Head & Shoulders pattern is similar to Head & Shoulders pattern but reversed. The inverse Head & Shoulders is observable in a downtrend and indicates a reversal of a downtrend.
The formation of a Inverse Head & Shoulders pattern resembles a baseline or neckline with three bottom where the middle bottom is the lowest price between between the two left and risght bottom.
Both the H&S and Inverse H&S patterns are most accurate price action pattern.
Also Checkout previous post about Head & Shoulders pattern for better understanding ()
Stay Tuned, 👍;

